. 2024 Jun 26;200(1):114-136.
doi: 10.1093/toxsci/kfae047.

Single-cell transcriptomics unveiled that early life BDE-99 exposure reprogrammed the gut-liver axis to promote a proinflammatory metabolic signature in male mice at late adulthood

Affiliations

Single-cell transcriptomics unveiled that early life BDE-99 exposure reprogrammed the gut-liver axis to promote a proinflammatory metabolic signature in male mice at late adulthood

Joe Jongpyo Lim et al. Toxicol Sci. .

Abstract

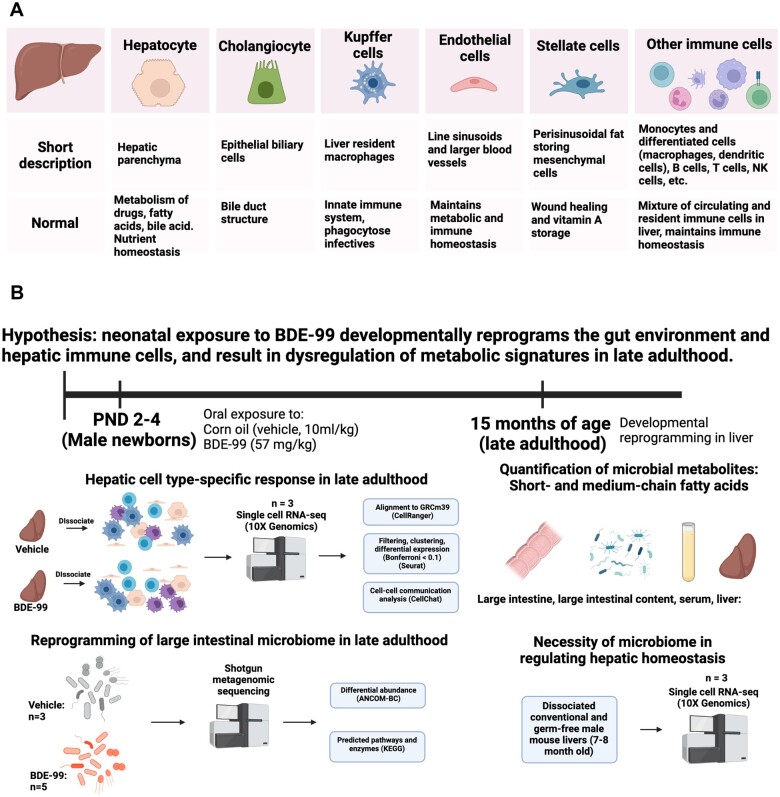
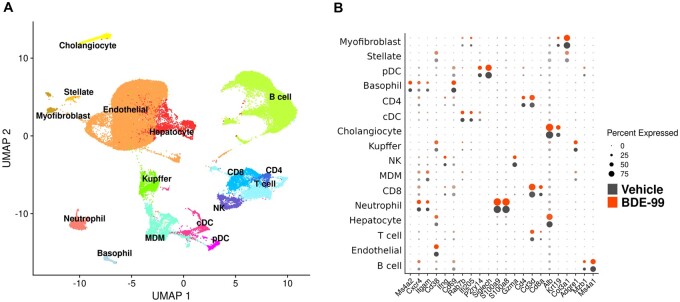
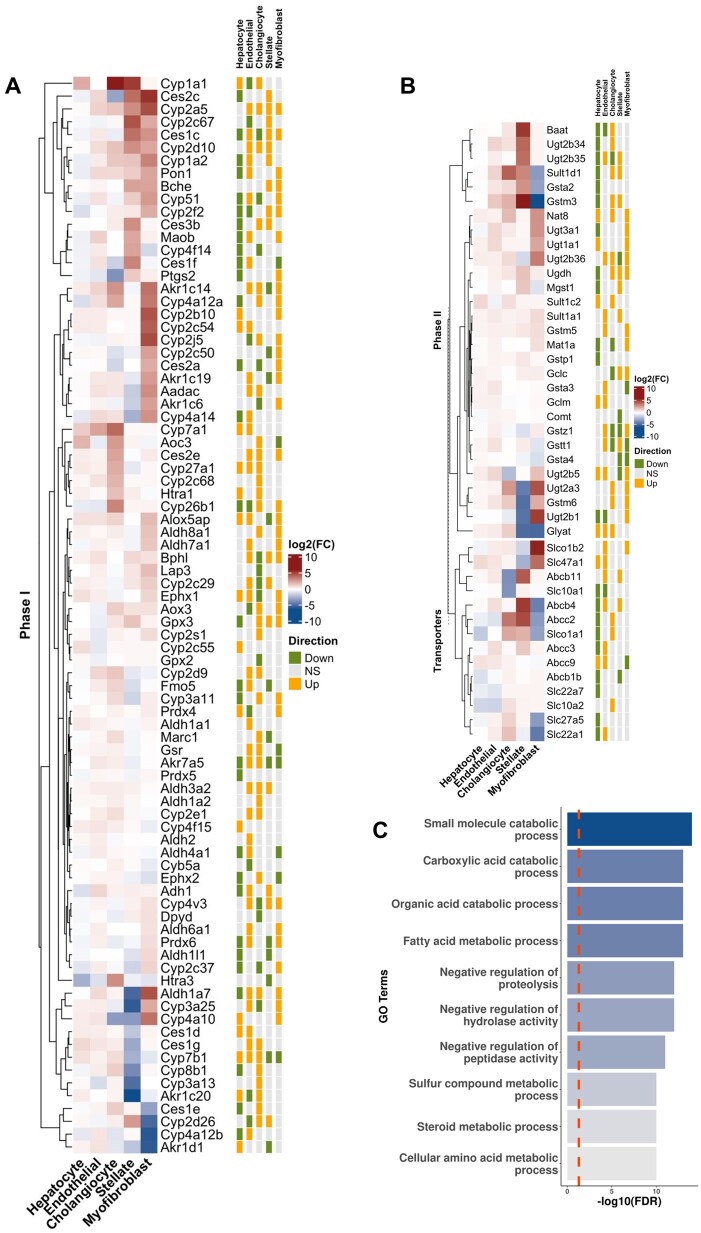
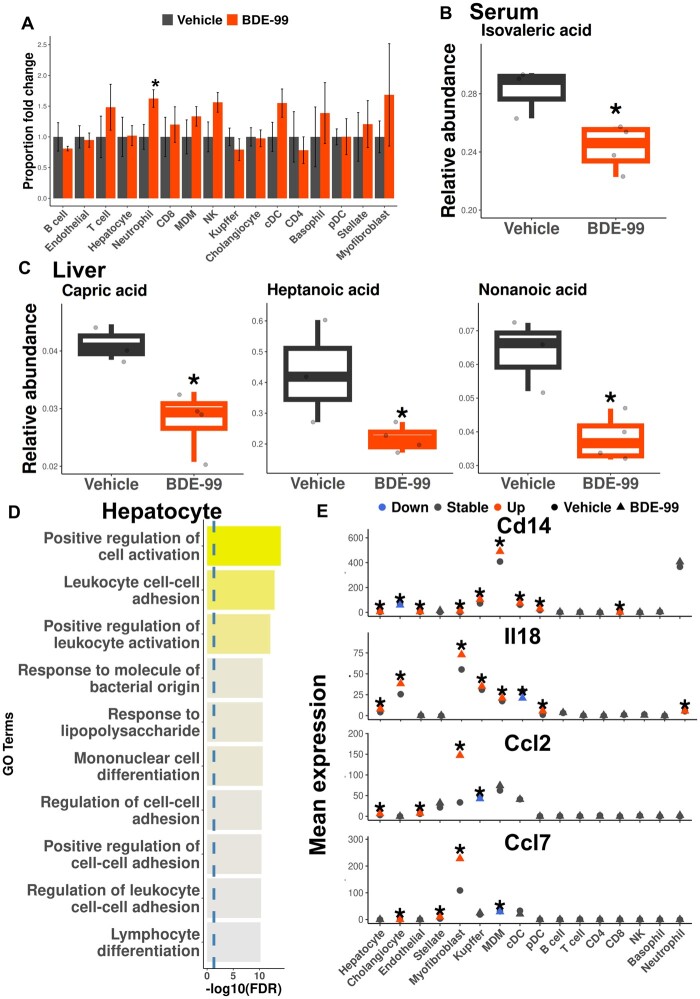
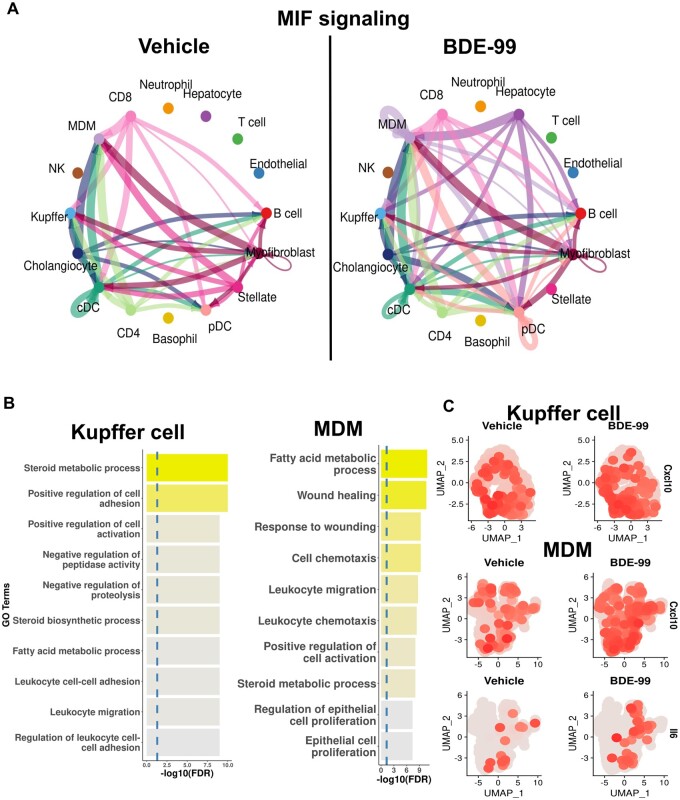
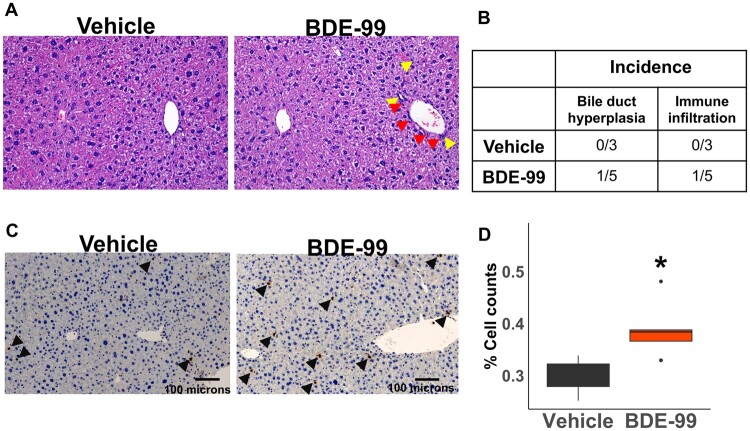
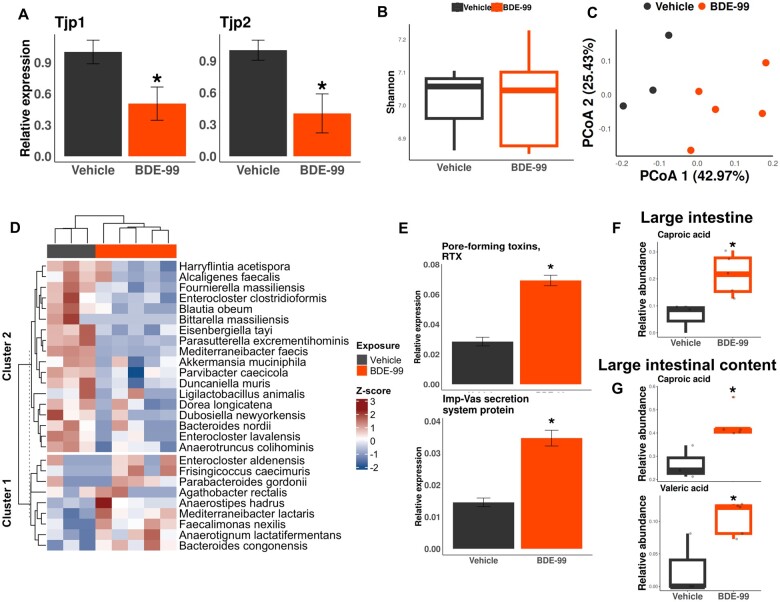
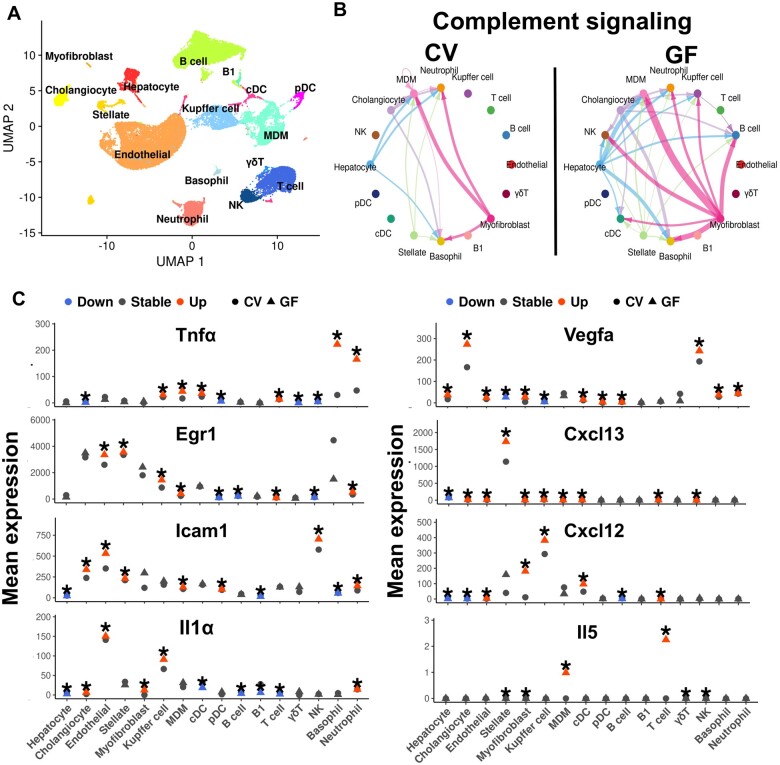
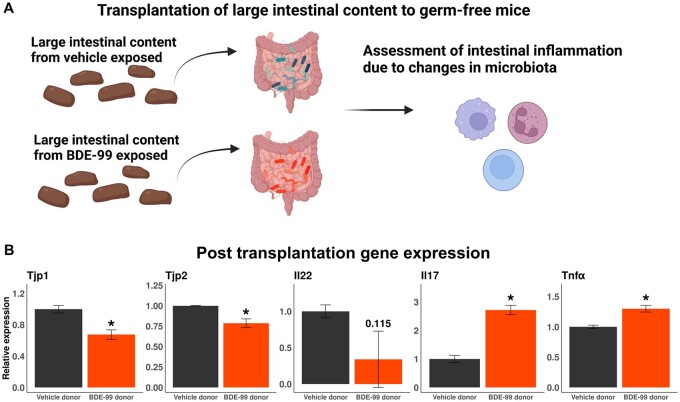
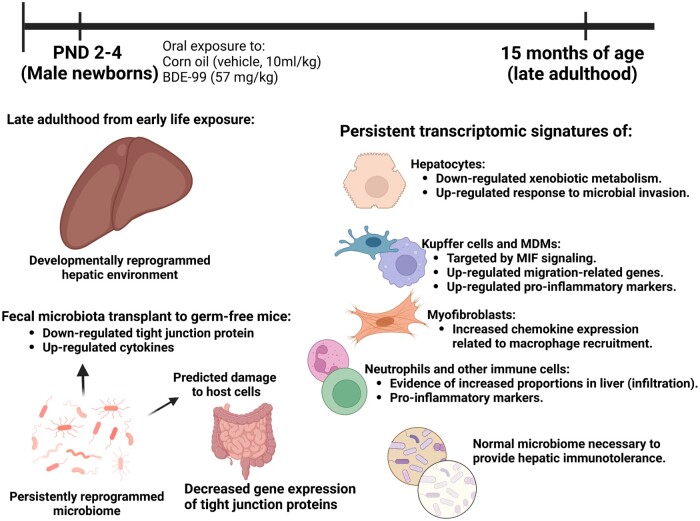
Polybrominated diphenyl ethers (PBDEs) are legacy flame retardants that bioaccumulate in the environment. The gut microbiome is an important regulator of liver functions including xenobiotic biotransformation and immune regulation. We recently showed that neonatal exposure to polybrominated diphenyl ether-99 (BDE-99), a human breast milk-enriched PBDE congener, up-regulated proinflammation-related and down-regulated drug metabolism-related genes predominantly in males in young adulthood. However, the persistence of this dysregulation into late adulthood, differential impact among hepatic cell types, and the involvement of the gut microbiome from neonatal BDE-99 exposure remain unknown. To address these knowledge gaps, male C57BL/6 mouse pups were orally exposed to corn oil (10 ml/kg) or BDE-99 (57 mg/kg) once daily from postnatal days 2-4. At 15 months of age, neonatal BDE-99 exposure down-regulated xenobiotic and lipid-metabolizing enzymes and up-regulated genes involved in microbial influx in hepatocytes. Neonatal BDE-99 exposure also increased the hepatic proportion of neutrophils and led to a predicted increase of macrophage migration inhibitory factor signaling. This was associated with decreased intestinal tight junction protein (Tjp) transcripts, altered gut environment, and dysregulation of inflammation-related metabolites. ScRNA-seq using germ-free (GF) mice demonstrated the necessity of a normal gut microbiome in maintaining hepatic immune tolerance. Microbiota transplant to GF mice using large intestinal microbiome from adults neonatally exposed to BDE-99 down-regulated Tjp transcripts and up-regulated several cytokines in large intestine. In conclusion, neonatal BDE-99 exposure reprogrammed cell type-specific gene expression and cell-cell communication in liver towards proinflammation, and this may be partly due to the dysregulated gut environment.

Keywords: RNA-seq; environmental chemicals; microbiome; omics research; persistent organic chemicals; systems biology.


Figures

Figure 1.
Figure 1.
(A) Summary of cell types detected in liver and their overall functions. (B) Experimental design and data analysis. From postnatal days (PND) 2 to 4, male C57BL/6 mouse pups were supralingually exposed to BDE-99 (57 mg/kg) or corn oil (10 ml/kg) as the vehicle control. Livers were removed at 15 months of age for scRNA-Seq (n = 3 per group). The shift in expression in drug processing signatures, cell-cell communication patterns, and immunological markers were investigated in each cell type. For mechanistic investigations of the gut-liver axis in mediating PBDE hepatotoxicity, we compared the hepatic transcriptomic signatures to our recently published dataset on gut microbiome in adult male C57BL/6 mice that were developmentally exposed to BDE-99 or vehicle using the same dosing regimen. Furthermore, the necessity of the gut microbiome in maintaining basal hepatic immune tolerance is validated using scRNA-seq conducted in livers of adult conventional and germ-free mice.
Figure 2.
Figure 2.
Clustering and visualization of specific marker genes in each cell type of liver. (A) Visualization of all labeled cell clusters detected through scRNA-seq (vehicle and BDE-99 exposed groups were combined). The first 2 uniform manifold approximation and projections (UMAP) were used. (B) Representation of key marker genes used for cell type labeling. Each marker gene was uniquely enriched for the corresponding cell type cluster in both vehicle and BDE-99-exposed groups. Black and red colors indicate vehicle and BDE-99 exposed groups, respectively.
Figure 3.
Figure 3.
Dysregulated expression signatures of drug-processing genes in resident hepatic cell populations at late adulthood following neonatal exposure to BDE-99. (A) Phase-I drug-processing enzymes that were differentially expressed (rows) in at least one of the major hepatic resident cell types (columns) with xenobiotic biotransformation capabilities are shown in a heatmap (left side). The colors of the heatmap represent the log2-fold change of liver genes of the BDE-99 exposed adults as compared with the vehicle control. “Direction” indicates whether a gene is up- (orange) or down- (green) regulated from neonatal exposure to BDE-99 (Bonferroni-adjusted p-value < .05). (B) Phase-II enzymes and transporters involved in xenobiotic metabolism processes that were differentially expressed (rows) in at least one of the major hepatic resident cell types (columns) with xenobiotic biotransformation capabilities are shown in a heatmap (left side). The colors of the heatmap represent the log2-fold change of liver genes of the BDE-99 exposed adults as compared with the vehicle control. “Direction” indicates whether a gene is up- (orange) or down- (green) regulated from neonatal exposure to BDE-99 (Bonferroni-adjusted p-value < .05). (C) Top 10 Gene Ontology enrichment of down-regulated genes in hepatocytes following neonatal exposure to BDE-99.
Figure 4.
Figure 4.
(A) Changes in proportions of the liver cell types in 15-month-old adult mouse livers following neonatal exposure to BDE-99. Y-axis shows the fold change in each cell type of BDE-99 exposed group over that of the vehicle-exposed group. Asterisks represent p-value < .05 (two-way t test with assumption of unequal variance). (B) Relative abundance of isovaleric acid detected in serum. Asterisks represent p-value < .05 (one-way ANOVA with Tukey’s post hoc test). (C) Relative abundance of medium-chain fatty acids detected in liver. Asterisks represent p-value < .05 (one-way ANOVA with Tukey’s post hoc test). (D) Top 10 up-regulated gene ontology terms in hepatocytes from 15-month-old males by early life exposure to BDE-99. (E) Average expression of proinflammatory markers in hepatic cell types following neonatal exposure to BDE-99. Red and blue colors represent up- and down-regulation, respectively. Vehicle and BDE-99-exposed groups are shown as circles and triangles, respectively. Asterisks indicate differential expression (Bonferroni-adjusted p-value < .05).
Figure 5.
Figure 5.
Increased macrophage migration inhibitory factor (MIF) signaling among multiple liver cell types and changes in downstream immune signatures in adult mouse livers following early life exposure to BDE-99. (A) Visualization of the cell-cell communications of the MIF signaling pathway in vehicle and BDE-99-exposed groups. Each cell type contains a unique color, and the matched colors represent signal communication direction from one cell type to another. The thickness of the arrows represents the probability of communication. (B) Top 10 up-regulated gene ontology enrichment results in Kupffer cells and MDMs in adult mouse livers following neonatal exposure to BDE-99. (C) Up-regulated expression of proinflammatory markers in Kupffer cells and MDMs. Grey and red indicate low and high expression, respectively.
Figure 6.
Figure 6.
(A) H&E staining of results for males neonatally exposed to vehicle or BDE-99. The left and right holes represent the central vein and portal triad, respectively. Kupffer cells and lymphocytes are located in the sinusoids. Yellow arrows indicate bile duct hyperplasia and red arrows show immune cell infiltration by neonatal exposure to BDE-99. (B) Pathology evaluation results showing the incidence of bile duct hyperplasia (yellow arrows) and immune infiltration (red arrows) by neonatal exposure to BDE-99. (C) Neutrophil elastase staining results for males neonatally exposed to vehicle or BDE-99. Black arrows show positively stained cells identified as neutrophils. (D) Percent of positively stained neutrophils relative to estimated total cell count by QuPath. The asterisk shows statistical significance at p  < .05 (two-way t test with unequal variance).
Figure 7.
Figure 7.
Evidence of a dysregulated gut environment by early life exposure to BDE-99. (A) Down-regulated expression of tight junction proteins by RT-qPCR in the large intestine in 15-month-old males following neonatal exposure to BDE-99. Asterisks show p-value < .05 (two-way t test with assumption of unequal variance). Alpha diversity using Shannon’s index (B) and Beta diversity using Bray-Curtis distance (C) comparing the large intestinal microbiome from adults neonatally exposed to vehicle or BDE-99. (D) Long-term alteration of the gut microbiome by early life exposure to BDE-99 at the full species level. Two main clusters are formed by k-means (k = 2). Top bars represent adults neonatally exposed to vehicle (black) or BDE-99 (orange). Red and blue colors show statistically significant increase or decrease of taxa abundance, respectively (ANCOM-BC, BH-adjusted p-value < .05). (E) Up-regulation of predicted functions linked to host cell damage from altered gut microbiome composition. Increase of metabolites in the large intestinal cell (F) and large intestinal content (G). Asterisks show p-value < .05 (two-way t test with assumption of unequal variance).
Figure 8.
Figure 8.
Up-regulated immune hepatic signaling patterns in the absence of gut microbiome. (A) UMAP representation of cell clusters labeled by cell type in both CV and GF mice. (B) Cell-cell communication signaling visualization for the complement signaling pathway in CV and GF livers. Each cell type contains a unique color and the matched colors represent signal communication direction from one cell type to another. The thickness of the arrows shows the probability of communication. (C) Average expression of proinflammatory markers and immune regulators in CV and GF liver cell types. Red and blue colors represent up- and down-regulation, respectively. Vehicle and BDE-99-exposed groups are shown as circles and triangles, respectively. Asterisks indicate differential expression (Bonferroni-adjusted p-value < .05).
Figure 9.
Figure 9.
Changes in microbiome composition by early life exposure to BDE-99 is linked to regulation of inflammation. (A) Experimental schematic of fecal microbiota transplantation to adult male germ-free mice. To study the impact on the immuno-modulation in the gut environment from the changes in the microbiome from early life exposure to BDE-99, large intestinal content was transplanted to adult germ-free mice. (B) Down-regulation of the transcripts of tight junction proteins and up-regulated proinflammatory cytokines in the large intestine posttransplantation of large intestinal content from adults neonatally exposed to vehicle or BDE-99 in germ-free mice, as determined by RT-qPCR. Asterisks represent p < .05 (two-way t test with unequal variance).
Figure 10.
Figure 10.
Summary of key findings. Neonatal short-term oral exposure to the human breast milk-enriched persistent organic pollutant, BDE-99, reprogrammed the transcriptome of key liver cell types in late adulthood. Early life exposure to BDE-99 resulted in down-regulation of xenobiotic metabolism and up-regulation of proinflammatory signatures in hepatocytes in late adulthood. The BDE-99-mediated down-regulation of tight junction proteins in the large intestine, together with the dysregulation of liver disease-associated taxa and the up-regulated hepatic signatures of microbial invasion responses, suggest that gut-liver axis may be a contributor to PBDE-induced alterations in the liver transcriptome. Following neonatal exposure to BDE-99, MIF signaling was increased targeting Kupffer cells and MDMs, which also displayed signatures of inflammatory phenotypes. Chemokines related to macrophage recruitment were up-regulated in myofibroblasts. Early life exposure to BDE-99 resulted in increased proportions of neutrophils. The absence of the gut microbiome resulted in increased inflammatory signatures, suggesting that the presence of a healthy microbiome is necessary for the liver to be immune tolerant. In the large intestine, the change in microbial composition in the large intestine is linked to the down-regulation of tight junction proteins and up-regulation of proinflammatory cytokines as evidenced by large intestinal microbiota transplantation. These results suggest that early life exposure to BDE-99 leads to a dysregulated crosstalk between the gut environment and liver and that the effect of neonatal exposure can induce a long-term increased risk or severity for chronic liver disease.

Similar articles

Cited by

References

    1. Abdelhamid M. K., Rychlik I., Hess C., Hatfaludi T., Crhanova M., Karasova D., Lagler J., Liebhart D., Hess M., Paudel S. (2021). Typhlitis induced by histomonas meleagridis affects relative but not the absolute Escherichia coli counts and invasion in the gut in turkeys. Vet. Res. 52, 92. - PMC - PubMed
    1. Aleksunes L. M., Klaassen C. D. (2012). Coordinated regulation of hepatic phase I and II drug-metabolizing genes and transporters using AhR-, CAR-, PXR-, PPARα-, and Nrf2-null mice. Drug Metab. Dispos. 40, 1366–1379. - PMC - PubMed
    1. Alexa, A., and Rahnenfuhrer, J. (2017). topGO. Bioconductor. 10.18129/B9.BIOC.TOPGO. - DOI
    1. Allen J. G., Gale S., Zoeller R. T., Spengler J. D., Birnbaum L., McNeely E. (2016). PBDE flame retardants, thyroid disease, and menopausal status in U.S. women. Environ. Health 15, 60. - PMC - PubMed
    1. Allen K., Jaeschke H., Copple B. L. (2011). Bile acids induce inflammatory genes in hepatocytes: A novel mechanism of inflammation during obstructive cholestasis. Am. J. Pathol. 178, 175–186. - PMC - PubMed

Substances

LinkOut - more resources