. 2024 Apr 22;7(7):e202302547.
doi: 10.26508/lsa.202302547. Print 2024 Jul.

Porphyrin overdrive rewires cancer cell metabolism

Affiliations

Porphyrin overdrive rewires cancer cell metabolism

Swamy R Adapa et al. Life Sci Alliance. .

Erratum in

  • Correction: Porphyrin overdrive rewires cancer cell metabolism.
    Adapa SR, Hunter GA, Amin NE, Marinescu C, Borsky A, Sagatys EM, Sebti SM, Reuther GW, Ferreira GC, Jiang RH. Adapa SR, et al. Life Sci Alliance. 2024 May 20;7(8):e202402816. doi: 10.26508/lsa.202402816. Print 2024 Aug. Life Sci Alliance. 2024. PMID: 38803226 Free PMC article.

Abstract

All cancer cells reprogram metabolism to support aberrant growth. Here, we report that cancer cells employ and depend on imbalanced and dynamic heme metabolic pathways, to accumulate heme intermediates, that is, porphyrins. We coined this essential metabolic rewiring "porphyrin overdrive" and determined that it is cancer-essential and cancer-specific. Among the major drivers are genes encoding mid-step enzymes governing the production of heme intermediates. CRISPR/Cas9 editing to engineer leukemia cell lines with impaired heme biosynthetic steps confirmed our whole-genome data analyses that porphyrin overdrive is linked to oncogenic states and cellular differentiation. Although porphyrin overdrive is absent in differentiated cells or somatic stem cells, it is present in patient-derived tumor progenitor cells, demonstrated by single-cell RNAseq, and in early embryogenesis. In conclusion, we identified a dependence of cancer cells on non-homeostatic heme metabolism, and we targeted this cancer metabolic vulnerability with a novel "bait-and-kill" strategy to eradicate malignant cells.


Conflict of interest statement

The authors declare that they have no conflict of interest.

Figures
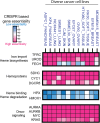
Figure S1.
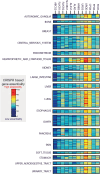
Figure S1.. Dependency on heme metabolism in diverse types of cancer cell lines.
The data for the CRISPR/Cas9 gene targeting of the genome-scale loss-of-function screens in a set of cancer cell lines were retrieved from DepMap. The columns refer to different cancer cell lines, whereas the rows refer to specific genes. Note the differences between the loss-of-function scores for specific proteins associated with heme biosynthesis (UROD and FECH) in this panel of cancer cell lines (abbreviations: AURKA, Aurora kinase A; AURKB, Aurora kinase B; CYC1, cytochrome c-1; DGCR8, DiGeorge syndrome critical region 8; FECH, ferrochelatase; HMOX1, heme oxygenase 1; HPX, hemopexin; SDHC, succinate dehydrogenase complex subunit C; TFRC, transferrin receptor; UROD, uroporphyrinogen III decarboxylase).
Figure 1.
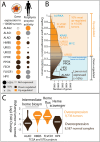
Figure 1.. Defining porphyrin overdrive with CRISPR data and early human embryonic stem cell single-cell RNAseq.
(A) Schematic illustration of heme homeostasis and porphyrin overdrive. Heme homeostasis refers to the heme biosynthetic pathway in normal cells, with the housekeeping enzyme ALAS1 catalyzing the first and rate-limiting step in all cells, except precursor erythroid cells, where the erythroid-specific ALAS isozyme ALAS2 catalyzes the rate-determining step. Porphyrin overdrive refers to the imbalanced (i.e., with aberrantly increased and suppressed enzyme activities) pathway in cancer cells and early human embryonic stem cells, with the ALAS1 isozyme controlling ALA production regardless of the cell type. White circles and white diamonds represent porphyrin intermediates and heme, respectively; erythroid refers to an erythroid precursor cell. Imbalanced enzyme activities in porphyrin overdrive are indicated by different sizes of product pools (dark red circle sizes). ALA, 5-aminolevulinate; ALAS, ALA synthase. (B) Defining porphyrin overdrive with CRISPR KO–derived essentiality data in over 300 cancer cell lines. Analysis of CRISPR essentiality data enables mapping of porphyrin overdrive in 27 major types of cancer. Color mapping indicates average cancer cell growth dependence revealed by CRISPR KO of a given gene. UROD has the highest pan-cancer essentiality. (C) Early human embryonic stem cells show features of porphyrin overdrive. The expression levels for ALAS1 and FECH differ over 100-fold during the first rounds of embryonic stem cell divisions, but they normalize with the early embryonic development progression. AURKA and SOX4 show expected patterns of expression dynamics during embryogenesis (abbreviations: ALA, 5-aminolevulinate; ALAS1, housekeeping ALA synthase; ALAS2, erythroid-specific ALA synthase; ALAD, ALA dehydratase [aka porphobilinogen synthase]; BACH, transcription regulator BACH [BTB and CNC homology]; CPOX, coproporphyrinogen oxidase; COX10, cytochrome C oxidase assembly homolog 10; CYC1, cytochrome C1; CYP, cytochrome P450 family; CYCS, cytochrome c, somatic; FECH, ferrochelatase; FLVCR, feline leukemia virus subgroup C receptor family; FLVCR1a, FLVCR member 1a; FLVCR1b, FLVCR member 1b; FLVCR2, FLVCR member 2; HBB, hemoglobin β-subunit; HMBS, hydroxymethylbilane synthase; PPOX, protoporphyrinogen oxidase; RKPM, reads per kilobase million; TFRC, transferrin receptor; TMEM14C, transmembrane protein 14C; UROD, uroporphyrinogen decarboxylase; UROS, uroporphyrinogen III synthase; UQCRB, ubiquinol–cytochrome c reductase binding protein; UQCRC, ubiquinol–cytochrome c reductase core protein 1; UQCRH, ubiquinol–cytochrome c reductase hinge protein).
Figure S2.
Figure S2.. ALAS1 and ALAS2 have different gene essentiality and pan-cancer gene expression patterns in cell lines.
(A) The isozyme gene pair ALAS1 and ALAS2 have different gene essentiality based on CRISPR/Cas9 loss-of-function results. ALAS2 was found not to be essential in any of the 27 major cancer types in over 300 cell lines, including erythroleukemia cell lines. The y-axis label “CRISPR KO gene dependency” refers to the essentiality of ALAS1 or ALAS2. The essential score was used to evaluate the cell growth fitness. An essentiality score of 0, < 0, and > 0 indicates no fitness change, fitness loss, and fitness gain under the same experimental conditions, respectively. (B) Study of ∼10,000 patient-derived tumors from GTEx and TCGA shows that ALAS1 expression is elevated in tumors compared with normal cells, whereas like in normal cells, ALAS2 expression is absent in most cells, except myeloid leukemia cells. However, the ALAS2 expression levels in normal erythroblasts do not significantly differ from those in cancer erythroblasts and myeloid leukemia cells. The dots indicate outliers of the samples with respect to ALAS expression. TPM, transcript per million. (C) Gene essentiality scores (more negative indicates higher essentiality) for the first-step genes ALAS1/ALAS2 and the mid-step gene UROD in two sets of solid tumor cell lines and two sets of liquid tumor cell lines. Pairwise P-values were calculated using the Mann–Whitney test to assess statistical significance.
Figure S3.
Figure S3.. CRISPR/Cas9 gene targeting and inferred gene essentiality in cancer cells exemplify porphyrin overdrive.
A total of over 300 cancer cell lines from 27 major cancer types are analyzed. The dataset represents 18 human tissue types that give rise to diverse groups of cancer. Whole-genome loss-of-function growth phenotypes show most cancer cells only require a partial heme biosynthetic pathway to survive. Gene essentiality is estimated from gene X dependency inferred from CRISPR/Cas9 gRNA gene X KO. Low cell viability and high cell viability with deletion of gene X indicate that the cancer cells have a high and low dependence on gene X for survival, respectively. Thus, the lowest and highest gene essentiality values are associated with the least and most profound dependence of the cells on the loss of gene X, respectively. The UROD gene for the fifth enzyme of the pathway has the highest essentiality in all types of cancers, whereas genes encoding other enzymes are dispensable in many cancer cell lines. Each of the rows in the 18 human tissue panels represents a distinct cancer cell line for the pertinent tissue (ABCG2, ATP-binding cassette [ABC] transporter subfamily G, member 2; ALAD, ALA dehydratase [aka porphobilinogen synthase]; ALAS1, 5-aminolevulinate synthase 1; CPOX, coproporphyrinogen oxidase; FECH, ferrochelatase; FLVCR, feline leukemia virus subgroup C receptor family; HMBS, hydroxymethylbilane synthase; PPOX, protoporphyrinogen oxidase; SLC48A1, solute carrier family 48, member 1, a.k.a. heme transporter HRG1; UROD, uroporphyrinogen III decarboxylase; UROS, uroporphyrinogen III synthase).
Figure S4.
Figure S4.. In vivo CRISPR/Cas9 loss-of-function studies confirm the essentiality of cancer porphyrin overdrive.
(A) Porphyrin overdrive, resulting from the absence of heme metabolism hemostasis, is indicated by the essentiality of the genes for the intermediate enzymatic steps of heme biosynthesis in both murine pancreatic and lung cancer models. The figure shows the comparison of gene essentialities between in vitro and in vivo cancer models, and their statistically significant differences (column 3 of both panels) are indicated with *. The different shades of magenta indicate the different degrees of gene essentiality. The color scheme reflects the pancreatic essentiality in the study. Both in vitro and in vivo essentiality data were retrieved from Zhu et al (2021). The increased gene essentiality, from in vitro to in vivo, of the intermediate step of heme biosynthesis genes (HBMS, UROS, CPOX, PPOX) is the only shared metabolic essentiality between pancreatic and lung cancers, which are indicated with *. The in vitro gene essentiality data indicate that the functional intermediate enzymatic steps in heme biosynthesis are independent of tumor origin or tissue environment (Zhu et al, 2021). (B) Analysis of ∼2,900 metabolic-related genes (retrieved from ref 9) shows similar gene essentiality in the in vitro and in vivo settings, indicating that the survival of tumor cells depends on the examined encoded metabolic enzymes both in vitro and in murine pancreatic and lung cancer models. No statistically significant/essential differences were observed for the essentialities of ALAS1, ALAS2, and FECH, the genes for the first and terminal enzymes of the heme biosynthetic pathway, in either of the in vivo murine cancer models (adj, adjusted).
Figure S5.
Figure S5.. Analyses of gene expression in tumors of patients with diverse types of cancer support cancer porphyrin overdrive.
(A) Up-regulation of gene expression for some enzymes of the heme biosynthetic pathway in ∼10,000 patient-derived tumors. ALAS2 is only expressed in myeloid leukemias. (B) Genes for HMBS, the fourth enzyme of the heme biosynthetic pathway, and FLVCR1, the heme exporter, are among the most up-regulated in over 80% of all tumors. Oncogenic signaling genes (in blue) AURKA, KRAS, and MYC are up-regulated in over 90%, 60%, and 50% of all tumor types, respectively. Orange shading denotes up-regulation of gene expression; blue shading denotes down-regulation of gene expression as compared to the normal tissue. The scale of the y-axis indicates the degree of over- or underexpression. (C) Expression of ALAD, encoding the second enzyme of the heme biosynthetic pathway, is down-regulated in tumors, whereas the gene for the third enzyme of the pathway, HMBS, is overexpressed in most of the tumors. FLVCR1, encoding a heme exporter, is overexpressed in tumors, whereas HPX, for the heme scavenger hemopexin, is more abundantly expressed in normal tissues. Pairwise P-values were calculated using the Mann–Whitney test to assess statistical significance. Data are from the GTEx project and TCGA program. FC, fold change; scRNAseq, single-cell RNA sequencing.
Figure S6.
Figure S6.. Genes up-regulated across diverse tumor types in TCGA project.
HMBS, the third enzyme of the heme biosynthetic pathway, and FLVCR1, the heme exporter, show significant up-regulation in most of the tumor types. In addition, oncogenic signaling genes AURKA, KRAS, and MYC are up-regulated in diverse tumor types. The x-axis scale represents the degree of gene overexpression in diverse tumor types, whereas the tumor tissue gene expression index indicates the extent of up-regulation across different tumor types. P-values were calculated using the Mann–Whitney test, adjusted with the Benjamin–Hochberg multiple hypothesis corrections.
Figure 2.
Figure 2.. Porphyrin overdrive is unique to cancer cells and absent in normal cells.
(A) Schematic illustrations of the key differences of heme metabolism in cancer versus normal cells. Red, orange, and yellow shadings represent cancer gene essentiality as in Fig 1B. Blue colors refer to the normal heme biosynthesis process. (B) PPIX autofluorescence (red) is detected in HC-04 liver cancer cells but not in primary human hepatocytes after ALA addition, indicating PPIX accumulation in cancer cells but not in normal cells. MitoTracker Green staining indicates viable cells. The scale bar size is 25 μM. Over 1,000 cells were assessed for each sample (representative cells shown). PPIX red was not observed in any normal cells. (C) Distinct heme metabolic gene essentiality in stem cell and cancer cells. (Gene essentiality is represented as lethality after loss/deletion of a specific gene.) Right: the human primary bone marrow stem cell gene knockdown essentiality data used in this study were sourced from Egan et al (2015). These RNAi knockdown data demonstrate that normal stem cells rely on the first- and last-step genes for survival, revealing a distinct pattern compared with cancer cells. Left: cancer CRISPR KO data are from pan-cancer essentiality analysis (DepMap). (D) Validation of the K562-FECH KO cell line generated by CRISPR/Cas9 gene editing. Immunoblots of wild-type K562 and K562-FECH KO whole-cell lysates show a complete loss of FECH protein in K562-FECH KO cells, with vinculin used as a loading control (top). A 107-bp out-of-frame CRISPR-induced deletion was identified in the ALAS2 gene (not shown), and because of the inability to identify a specific ALAS2 antibody for immunoblotting, the presence of this deletion was confirmed in RT–PCR analysis of K562-ALAS2 KO cells (bottom). (E) Total viable K562 and K562-FECH KO cells (top) and K562 and K562-ALAS2 KO cells (bottom) were determined over time using trypan blue exclusion, and no growth differences were detected. (F) ALAS2 KO K562 cells are arrested in a non-differentiable state. K562 cells readily differentiated upon ROS induction (tert-butyl hydroperoxide) and are committed into erythroid lineage within 48 h, as measured by activation of heme production and benzidine stain as a marker of differentiation. In contrast, ALAS2 KO cells do not respond to the ROS inducer (the first step of differentiation) nor commit to erythroid differentiation (parent versus ALAS2 KO, Mann–Whitney test, P < 0.001).
Figure S7.
Figure S7.. Assessment of gene essentiality in heme biosynthesis during ex vivo erythropoiesis in human primary hematopoietic stem cells.
The x-axis represents gene essentiality, as determined by RNAi knockdown in a pooled screen, with data sourced from Egan et al (2015). The statistical significance was determined using a paired Kolmogorov–Smirnov (KS) test, and the resulting P-values were corrected for multiple testing using the Benjamini–Hochberg (BH) method. Red dots on the right indicate genes required for human stem cell development, as evidenced by a decrease in cell count. Blue dots on the left represent genes considered dispensable for hematopoietic stem cell development, showing no depletion of mutant cell numbers. Notably, genes ALAS2 and FECH are essential in normal stem cell development, whereas they are dispensable in CRISPR KO studies in cancer cell lines such as K562 in our study.
Figure S8.
Figure S8.. Erythroid differentiation in in vitro erythropoiesis assays.
The parent K562 cell line readily undergoes differentiation at 48 h post-induction in vitro. In contrast, neither the ALAS2 KO nor the FECH KO mutants show signs of differentiation (parent line versus mutants, P < 0.0001). Cell differentiation under 40 μM concentrations of hemin was measured by staining cells with benzidine and o-dianisidine. Cells stained in benzidine (upper panel), and o-dianisidine–positive cells (lower panel) indicate hemoglobin accumulation. Only parent K562 showed staining in both staining methods.
Figure 3.
Figure 3.. Single-cell RNA sequencing of human AML bone marrow samples supports porphyrin overdrive as a hallmark of cancer cells.
Single-cell transcriptomes were obtained from bone marrow biopsies of AML donors with over 60% blasts. (A) Single-cell population composition shows only a minor fraction of the cells are cancer progenitors, which are defined by transcriptome embedding and clustering analysis. (B) Identification of distinct single-cell populations in the AML patient bone marrow samples by t-SNE (t-distributed stochastic neighbor embedding) analysis. A total of 1,349 high-quality transcriptomes from patient biopsies were used. (C) Representative genes for proteins associated with heme metabolism, normal early erythroid development, cell proliferation, and erythroid commitment process are plotted. (D) UROD, the gene encoding the fifth enzyme of the heme biosynthetic pathway, is highly expressed in cancer early progenitors. HMS and UROS, which encode other intermediate step-catalyzing enzymes, are also overexpressed in cancer progenitors. (E) Marker genes delineate cell populations from the patient samples. Note the complementary expression patterns of ALAS1 versus ALAS2. (F) Solid tumor single-cell RNAseq shows the overexpression of the genes for the enzymes responsible for the intermediate heme biosynthetic pathway steps in breast cancer and melanoma (Tirosh et al, 2016; Wu et al, 2020).
Figure S9.
Figure S9.. Cancer progenitor cells highly express cell niche interaction genes and show features of highly dynamic metabolic substrate trafficking hubs.
(A) AML progenitor cells specifically express genes for interacting proteins (“interactors”) within the erythroblastic island, the specialized bone marrow niche where erythroid precursors proliferate, differentiate, and enucleate. The y-axis indicates the log2 fold change of gene expression levels in early AML progenitor cells relative to other progenitor cells. Positive log2 fold change values indicate increased expression levels over those of the control, whereas negative values indicated decreased expression relatives relative to those of the control. Names of selected genes are indicated on the x-axis. FC, fold change. (B) AML progenitor cells show hallmarks of metabolic substrate trafficking and abundant salvaging pathways. Genes associated with endocytosis, lipid transport, NAD salvage, and nucleotide salvage are up-regulated, whereas genes related to cell morphology and barrier formation are down-regulated. (C) Cancer cell niche is inferred to present elevated gene expression for proteins involved in intracellular surface molecular interactions (e.g., VCAM1-ITGA4 and ITGAX/ITGB2-ICAM4). The schematic represents a reconstruction of a cancer partner cell–cancer progenitor cell interaction based on previously established molecular interactions.
Figure S10.
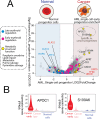
Figure S10.. AML patient cancer progenitor cells show enhanced metabolic flux.
(A)Cancer early progenitor cells represent only 2% of the AML patient sample cell population (see Fig 3). Light blue shading represents down-regulated genes, and light pink shading indicates up-regulated genes. The −log10 (P-values) in the volcano plot represent the level of significance of each gene, whereas the log2 fold change values represent the difference between the levels of expression for each gene between the AML progenitor cells and other populations of cells. The genes related to metabolic flux are highlighted in yellow and include genes associated with the postulated porphyrin overdrive, lipid import, and macromolecule salvage. The canonical erythropoiesis master transcription regulators are colored as early (blue dots) and late (pink dots) stages based on their gene expression sequence during erythropoiesis. (B) Cancer progenitor–specific gene expressions of APOC1 and S100A6 are shown in different cell populations. FPKM, fragments per kilobase million.
Figure 4.
Figure 4.. Targeting porphyrin overdrive in cancer cells with a bait-and-kill strategy.
(A) Concentration of PPIX accumulated in K562 cells depends on the ALA concentration supplemented with the culture medium. K562 cells were cultured in the absence or presence of 100 mM glycine or ALA (0.1, 0.25, 0.5, and 1.0 mM) at 37°C for 24 h, and PPIX fluorescence was measured by flow cytometry (a.u., arbitrary units) (0.1 mM versus 1 mM ALA, P < 0.001). (B) ALA-induced PPIX accumulation in HEL cells. PPIX accumulated in 100% of the HEL cells (n > 10,000 cells) as detected by PPIX fluorescence 4 h after treatment with 1.0 mM ALA (control versus 1 mM ALA, P < 0.001). The red sectors of the pie chart above the graph bars indicate the percentage of PPIX-accumulating HEL cells, whereas those in blue indicate the percentage of cells with no accumulated PPIX. The normalized PPIX values (%) indicated on the pie charts were obtained by dividing the PPIX fluorescence by the PPIX fluorescence intensity value for HEL cells incubated in 1.0 mM ALA-containing medium for 4 h, which was arbitrarily assigned 100%. (C) Cell viability is unaffected using ALA (“bait”) as an inducer of PPIX accumulation. HEL cells were cultured in the absence or presence of ALA (1 mM), or ALA (1 mM) and DMSO (0.1%) at 37°C for 24 h, and their viability was calculated from the generated luminescence upon reaction with CellTiter-Glo. The assays were conducted in triplicate (RLU, relative luminescence units). (D, E, F) Dose-dependent response of cell viability for cells treated with increasing concentrations of drugs in three cancer cell lines. DHA, dihydroartemisinin. (G) Dose-dependent response of cell viability treated with ganetespib. (H, I) Normal human primary lung cells have no synergistic killing effect. Cell viability was determined after incubation with a wide concentration range of compounds either in the absence or presence of ALA (1.0 mM) for 4 or 24 h. (Note that the concentration of either RSL3 or ganetespib spans a range from pM to 150 mM.)

References

    1. Aguirre AJ, Meyers RM, Weir BA, Vazquez F, Zhang C-Z, Ben-David U, Cook A, Ha G, Harrington WF, Doshi MB, et al. (2016) Genomic copy number dictates a gene-independent cell response to CRISPR/Cas9 targeting. Cancer Discov 6: 914–929. 10.1158/2159-8290.CD-16-0154 - DOI - PMC - PubMed
    1. Alexandrova EM, Yallowitz AR, Li D, Xu S, Schulz R, Proia DA, Lozano G, Dobbelstein M, Moll UM (2015) Improving survival by exploiting tumour dependence on stabilized mutant p53 for treatment. Nature 523: 352–356. 10.1038/nature14430 - DOI - PMC - PubMed
    1. Algorri JF, Ochoa M, Roldán-Varona P, Rodríguez-Cobo L, López-Higuera JM (2021) Photodynamic therapy: A compendium of latest reviews. Cancers (Basel) 13: 4447. 10.3390/cancers13174447 - DOI - PMC - PubMed
    1. Bellini MH, Coutinho EL, Courrol LC, Rodrigues de Oliveira Silva F, Vieira Júnior ND, Schor N (2008) Correlation between autofluorescence intensity and tumor area in mice bearing renal cell carcinoma. J Fluoresc 18: 1163–1168. 10.1007/s10895-008-0368-4 - DOI - PubMed
    1. Bunevicius A, Pikis S, Padilla F, Prada F, Sheehan J (2022) Sonodynamic therapy for gliomas. J Neurooncol 156: 1–10. 10.1007/s11060-021-03807-6 - DOI - PubMed

Publication types