. 2024 Apr 22;15(1):3389.
doi: 10.1038/s41467-024-47691-w.

PD-L1- and IL-4-expressing basophils promote pathogenic accumulation of T follicular helper cells in lupus

Affiliations

PD-L1- and IL-4-expressing basophils promote pathogenic accumulation of T follicular helper cells in lupus

John Tchen et al. Nat Commun. .

Abstract

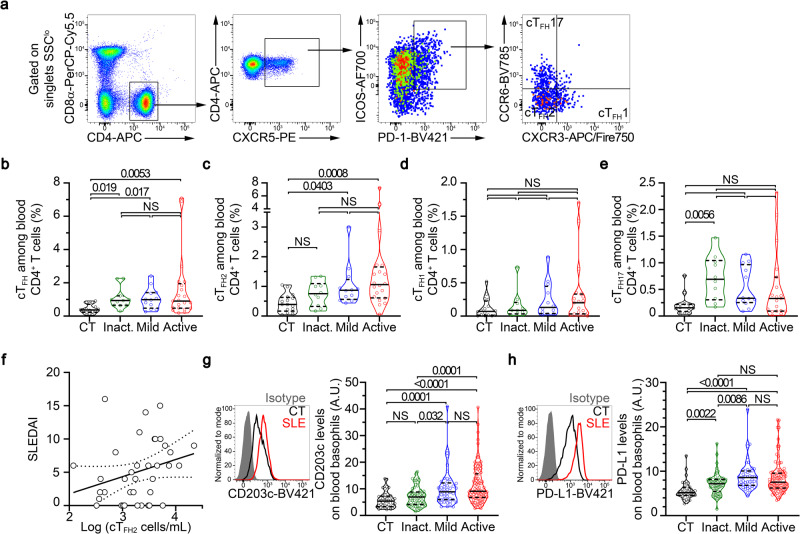
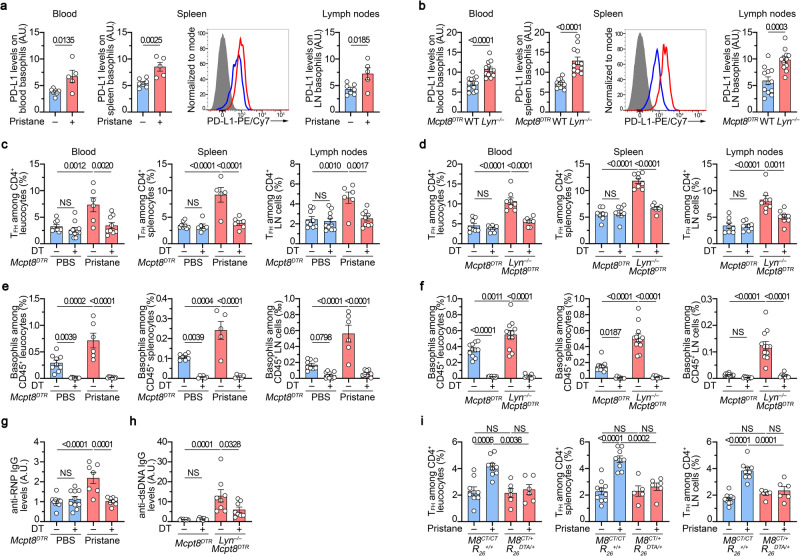
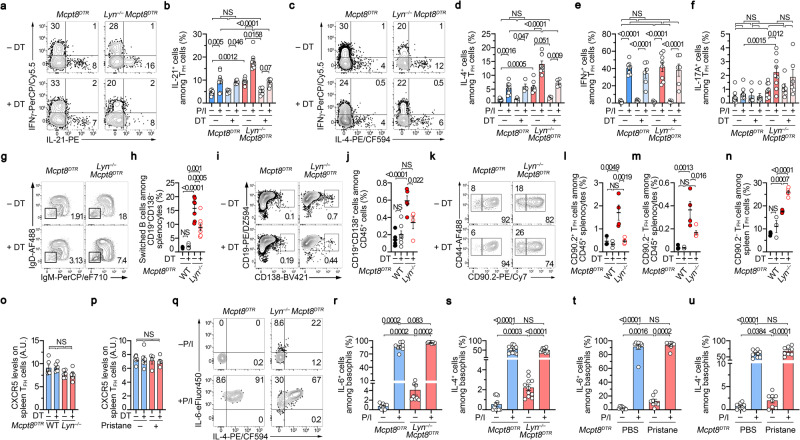
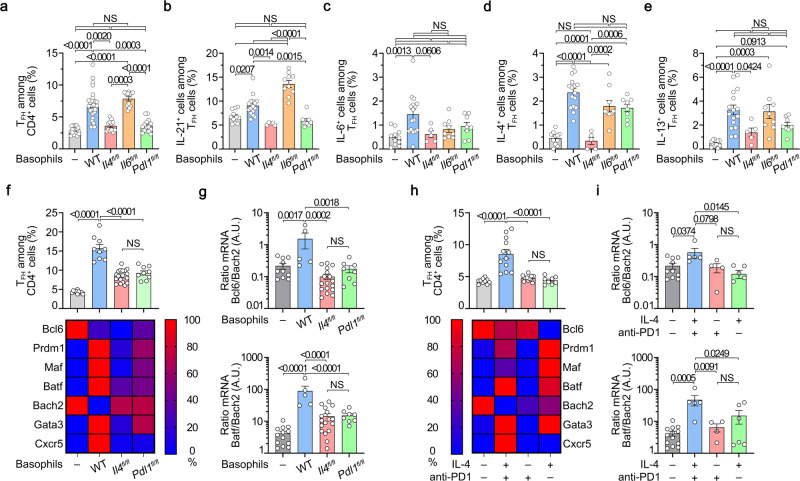
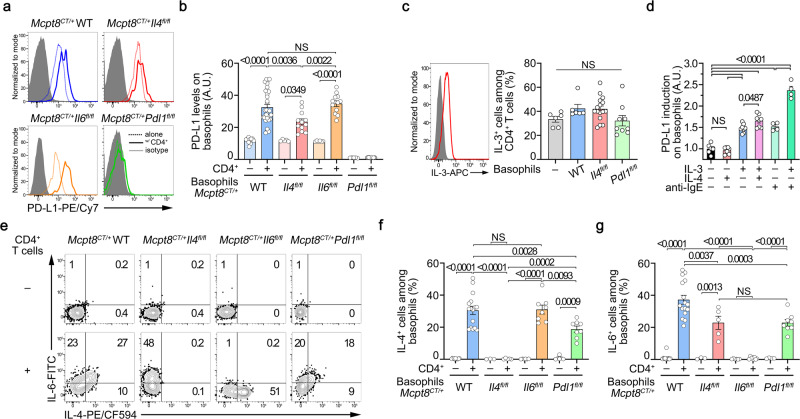
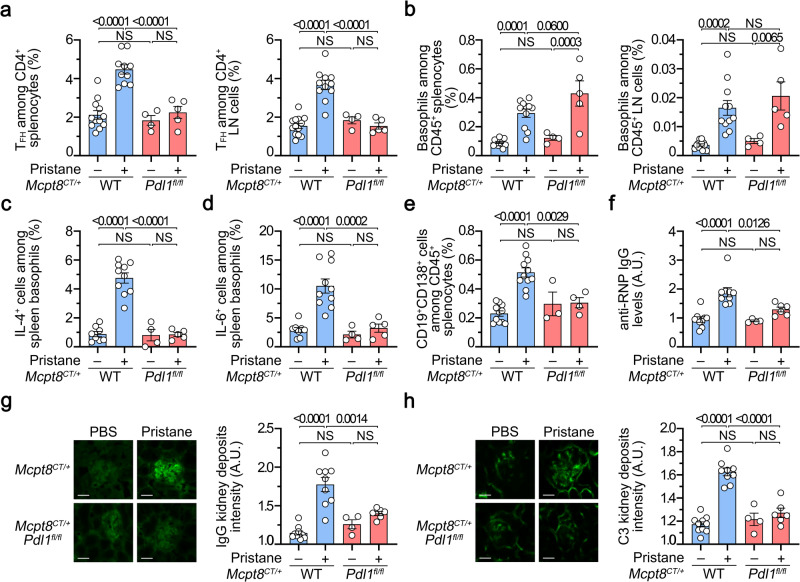
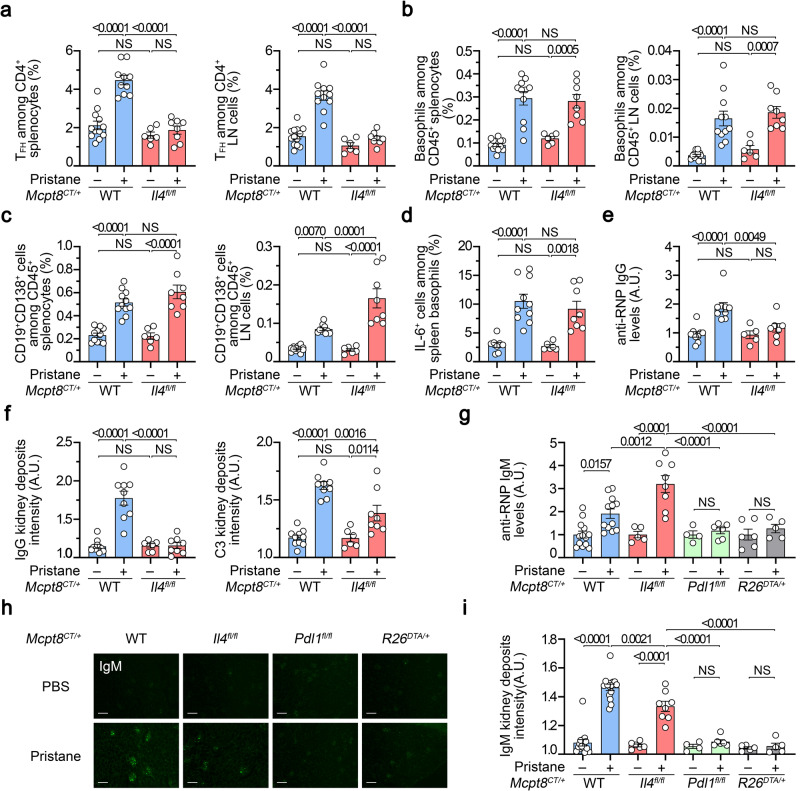
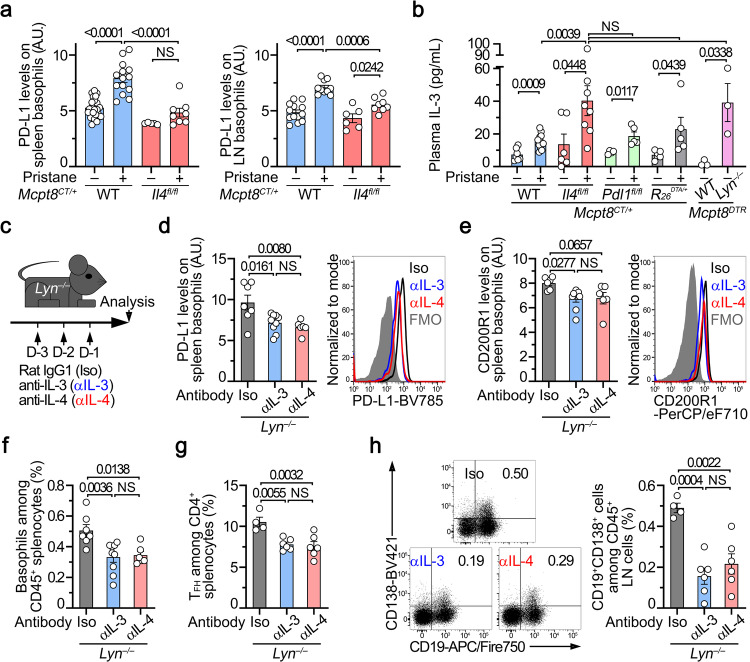
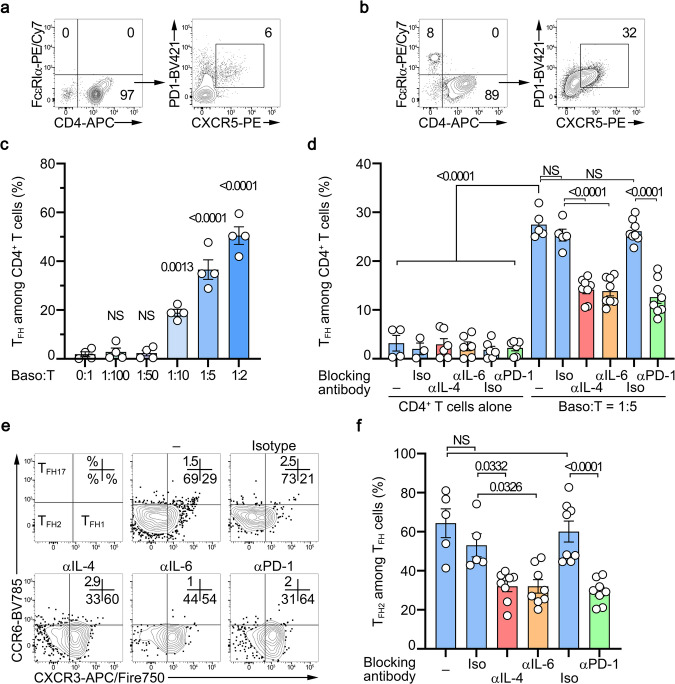
Systemic lupus erythematosus (SLE) is an autoimmune disease characterized by anti-nuclear autoantibodies whose production is promoted by autoreactive T follicular helper (TFH) cells. During SLE pathogenesis, basophils accumulate in secondary lymphoid organs (SLO), amplify autoantibody production and disease progression through mechanisms that remain to be defined. Here, we provide evidence for a direct functional relationship between TFH cells and basophils during lupus pathogenesis, both in humans and mice. PD-L1 upregulation on basophils and IL-4 production are associated with TFH and TFH2 cell expansions and with disease activity. Pathogenic TFH cell accumulation, maintenance, and function in SLO were dependent on PD-L1 and IL-4 in basophils, which induced a transcriptional program allowing TFH2 cell differentiation and function. Our study establishes a direct mechanistic link between basophils and TFH cells in SLE that promotes autoantibody production and lupus nephritis.


Conflict of interest statement

N.C. holds a patent related to compositions and methods for treating or preventing lupus (W020120710042). C.P. and N.C. are coinventors of the patent WO2016128565A1 related to the use of PTGDR-1 and PTGDR-2 antagonists for the prevention or treatment of systemic lupus erythematosus. No other disclosures relevant to this article are reported. The remaining authors declare no competing interests relevant to this article.

Figures

Fig. 1
Fig. 1. Human blood basophils from SLE patients overexpress PD-L1.
a Flow cytometry gating strategy used to identify human circulating T follicular helper T cells (cTFH) defined as CD3+ CD8α CD4+ CXCR5+ ICOS+ PD-1+. Among cTFH cells, cTFH1 cells were defined as CXCR3+CCR6, cTFH2 as CXCR3 CCR6, and cTFH17 as CXCR3 CCR6+. b Proportions (%) among CD4+ T cells of cTFH as defined in (a) in blood from healthy controls (CT) and inactive (inact.), mild, or active SLE patients (n = 16/11/12/21) as determined by flow cytometry. Proportions (%) among CD4+ T cells of cTFH2 (c), cTFH1 (d) and cTFH17 (e) as defined in (a) in blood from healthy controls and inactive, mild, or active SLE patients (n = 16/10/12/20) as determined by flow cytometry. f Correlation (and linear regression with 95% confidence intervals) between Log (cTFH2 cell numbers per mL of blood) and SLEDAI (Spearman r = 0.3682, p = 0.02, n = 37). g Left, Histogram plot representing the CD203c expression levels on blood basophils from a healthy control (CT, black), a patient with active SLE (red), and isotype control staining (gray filled). Right, CD203c expression levels on blood basophils from CT and inact, mild or active SLE patients (n = 43/61/46/98) as determined by flow cytometry. h Left, Representative histogram plot of PD-L1 expression levels on blood basophils as in (g). Right, PD-L1 expression levels on blood basophils from CT and inact, mild or active SLE patients (n = 39/60/45/96) as determined by flow cytometry. (be, g, h) Data are presented as violin plots with median (solid line) and quartiles (dotted lines). Statistical analyses were Kruskal–Wallis tests followed by Dunn’s multiple comparisons tests and p values are shown above each bracket. NS not significant. A.U. arbitrary units. Source data are provided in the Source Data file.
Fig. 2
Fig. 2. Basophil-TFH functional relationship during lupus-like disease.
a PD-L1 expression levels on basophils from PBS- (blue, n = 7) or pristane-injected Mcpt8DTR mice (red, n = 5) in the indicated compartments (LN: lymph nodes) (as described in Supplementary Fig. 2a–c). Histograms of PD-L1 expression on spleen basophils from one mouse per group and isotype control (gray filled) are shown. b PD-L1 expression levels on basophils from aged Mcpt8DTR (blue, n = 12) or Lyn–/–Mcpt8DTR mice (red, n = 12) as in (a). c Proportions (%) of TFH among CD4+ T cells in the indicated compartments from PBS-injected (blue) and basophil sufficient (DT–) or basophil-depleted (DT + ) mice and from pristane-injected Mcpt8DTR mice (red) DT treated or not (gating strategy described in Supplementary Fig. 2d–f). Blood (n = 9/10/6/9), Spleen (n = 8/6/5/6), LN (n = 9/10/6/9). d Proportions of TFH among CD4+ T cells from aged Mcpt8DTR (blue) and basophil sufficient (DT–) or basophil-depleted (DT + ) mice and from aged Lyn–/–Mcpt8DTR mice (red) DT-treated or not, determined as in (c) (n = 8/8/8/8). e, f Proportions of basophils among CD45+ cells in the indicated compartments in mice described in (c) and (d), respectively. e Blood (n = 9/10/6/8), Spleen (n = 7/6/5/6), LN (n = 9/10/6/8). f Blood (n = 11/8/12/8), Spleen and LN (n = 12/8/12/8). g Anti-RNP IgG plasma titers in mice as in (c) were quantified by ELISA. O.D. values at 450 nm were normalized to the mean of PBS-injected DT – Mcpt8DTR values (n = 10/10/7/8). h Anti-dsDNA IgG plasma titers in mice as in (d) were quantified by ELISA and normalized to the mean of DT – Mcpt8DTR values (n = 8/8/8/8). i Proportions of TFH among CD4+ T cells in the indicated compartments from basophil-sufficient (Mcpt8CT/CTR26+/+) (blue) or basophil-deficient (Mcpt8CT/+R26DTA/+) (red) mice treated with PBS (–) or pristane (+). Blood (n = 9/9/6/6), Spleen (n = 10/9/5/6), LN (n = 10/9/6/6). ai Results are from at least three independent experiments and presented as individual values in bars representing the mean values ± s.e.m. Statistical analyses were done by two-sided unpaired t test (a, b) or by two-way ANOVA followed by Tukey’s multiple comparisons test (ci) between the indicated groups, and p values are shown above each bracket. NS: not significant. A.U.: arbitrary units. Source data are provided in the Source Data file.
Fig. 3
Fig. 3. Basophils control TFH abilities to produce IL-21 and IL-4 in the lupus-like context.
a, c Contour plots showing PMA and Ionomycin (P/I)-induced IFNγ, IL-21, and IL-4 productions by TFH cells (as defined in supplementary Fig. 2d-f) in splenocytes from aged Mcpt8DTR or Lyn–/–Mcpt8DTR mice basophil-depleted (DT + ) or not (DT–). Proportions (%) of IL-21+ (b) (n = 9/6/9/6), IL-4+ (d) (n = 9/4/9/4), IFNγ + (e) (n = 8/6/8/6) and IL-17A+ (n = 9/6/9/6) (f) TFH cells in splenocytes as in (a). g Contour plots of switched B cells (IgMIgD) among spleen CD45+TCRβCD19+CD138 cells in mice as in (a). h Proportions (%) of switched B cells among CD19+CD138 splenocytes as in (g) (n = 6/6/7/8). i Contour plots of CD19+CD138+ cells among CD45+ cells from co-culture of sorted TFH cells from mice as in (g) and WT B cells. j Proportions (%) of CD19+CD138+ cells among CD45+ cells as in (i) (n = 6/7/5/4). k Contour plots of CD90.2+ and CD90.2 TFH cells among spleen TFH cells from mice as in (a). Proportions (%) of CD90.2+ (l) and CD90.2 (m) TFH cells among CD45+ splenocytes from mice as in (a) (n = 3/3/4/5). n Proportions (%) of CD90.2 TFH cells among spleen TFH cells as in (k) from mice as in (g) (n = 3/3/4/5). CXCR5 expression on spleen TFH cells from mice as in (an) (o) and as in (t, u) (p). q Contour plots showing non-stimulated (–) and P/I-induced (+) IL-6 and IL-4 productions by spleen basophils from aged Mcpt8DTR or Lyn–/–Mcpt8DTR mice. Proportions (%) of IL-6+ (r) (n = 8/8/8/8) and IL-4+ (s) (n = 11/11/11/11) basophils in splenocytes as in (a). Proportions (%) of IL-6 (t) (n = 9/9/8/8) and IL-4 (u) (n = 9/9/8/8) producing cells among basophils in splenocytes stimulated with P/I (+) or not (–) from PBS-injected Mcpt8DTR (blue) or pristane-injected Mcpt8DTR (red) mice. b, df, h, j, lp, ru Results are from at least three independent experiments and presented as individual values in bars representing the mean values ± s.e.m. Statistical analyses were by two-way ANOVA followed by Tukey’s multiple comparisons test (b, df, h, j, lp) or by Kruskal–Wallis tests followed by two-sided Mann–Whitney U test between the indicated groups (ru). P values are shown above each bracket. NS not significant. Source data are provided in the Source Data file.
Fig. 4
Fig. 4. PD-L1- and IL-4-expressing basophils promotes ex vivo CD4+ T cell differentiation into TFH cells.
ag CD3/CD28-stimulated wild-type (WT) naïve CD4+ T cells cultured for three days without (–, gray) or with basophils from Mcpt8CT/+ (WT) (blue), Mcpt8CT/+Il4fl/fl (red), Mcpt8CT/+Il6fl/fl (orange), or Mcpt8CT/+Pdl1fl/fl (green) mice. a Proportions (%) of TFH cells among CD4+ T cells (n = 17/31/12/12/15). Proportions (%) of IL-21- (b), IL-6- (c), IL-4- (d), and IL-13- (e) producing cells among TFH cells non-restimulated (n = 11/16/5/10/8). f (Top) Proportions (%) of TFH cells among CD4+ T cells (n = 10/9/20/9). Bottom RT-qPCR done for the indicated targets on resorted CD4+ T cells. Relative results are presented with the color scale indicated from 0% (blue, the least abundant) to 100% (red, the most abundant). g Ratio of Bcl6 on Bach2 mRNA (Top) (n = 10/5/17/8) and of Batf on Bach2 mRNA (Bottom) (n = 13/5/17/8) as described in (f). h Top Proportions (%) of TFH cells among CD4+ T cells cultured without basophils for three days either alone (–, gray) or with coated anti-PD-1 antibody (red) or soluble IL-4 (green) or both (blue) (n = 10/12/12/8). Bottom. Relative mRNA expression of the indicated targets as in (f). i Ratio of Bcl6 on Bach2 mRNA (Top) (n = 10/5/4/6) and of Batf on Bach2 mRNA (Bottom) (n = 13/5/4/6) on samples described in (h). be Results for PMA/Ionomycin restimulated cells are shown in Supplementary Fig. 7e–h. ai Results are from at least three independent experiments and presented as individual values in bars representing the mean ± s.e.m. Statistical analyses were done by Kruskal–Wallis test followed by Dunn’s multiple comparisons tests (a) or by one way ANOVA followed by Tukey’s multiple comparisons tests (bi) between the indicated groups. P values are shown above each bracket. NS not significant. A.U. arbitrary units. Source data are provided in the Source Data file.
Fig. 5
Fig. 5. CD4+ T cells promotes ex vivo PD-L1 and IL-4 expressions by basophils.
a Histograms of PD-L1 expression on basophils cultured without (dotted) or with (solid) activated naïve CD4+ T cells as in Fig. 4 (gray filled: isotype control staining). b PD-L1 expression levels on basophils cultured without (–, lighter colors) or with (+, darker colors) activated naïve CD4+ T cells (n = 14/31/5/12/6/12/5/12). c Left. Intracellular IL-3 staining in WT CD3/CD28-activated naïve CD4+ T cells after 3 days of culture (red line) (gray filled: isotype control staining). Right. Proportions (%) of IL-3+ cells among CD4+ T cells non-restimulated in the same samples as in Fig. 4f (n = 6/9/16/9). d PD-L1 expression induction on WT basophils after stimulation of splenocytes with 1 ng/mL of IL-4 (red), of IL-3 (blue), both (purple), 100 ng/mL of anti-IgE without (light green) or with (green) IL-3 for 20 h (n = 8/8/8/8/4/4) (normalized to unstimulated conditions mean value). e Contour plots of IL-6 and IL-4 spontaneous production by basophils of the indicated genotype after co-culture without (–) or with activated CD4+ T cells. Proportions (%) of spontaneous IL-4+ (f) and IL-6+ (g) basophils of the indicated genotypes co-cultured (+) or not (–) with WT CD3/CD28-activated naïve CD4 + T cells (n = 11/16/3/5/6/8/4/8). f, g Results for IL-13 and PMA/Ionomycin restimulated cells are shown in Supplementary Fig. 7k–n. ag Results are from at least three independent experiments and presented as individual values in bars representing the mean ± s.e.m. bd, f, g Statistical analyses were by one way ANOVA followed by Tukey’s multiple comparisons tests between the indicated groups. P values are shown above each bracket. NS not significant. A.U. arbitrary units. Source data are provided in the Source Data file.
Fig. 6
Fig. 6. PD-L1 controls the basophil-TFH functional relationship during lupus-like disease.
a Proportions (%) of TFH cells among CD4+ T cells in spleen (left) (n = 12/10/4/5) and lymph nodes (LN) (right) (n = 13/11/4/5) from Mcpt8CT/+ (WT) (blue) or Mcpt8CT/+ Pdl1fl/fl (Pdl1fl/fl) (red) mice injected with PBS (–) or with pristane (+). b Proportions (%) of basophils among CD45+ cells in the spleen (left) (n = 12/10/4/5) and lymph nodes (right) (n = 13/11/4/5) from the mice described in (a). Proportions (%) of spontaneous IL-4+ (c) (n = 8/10/4/5) or IL-6+ cells (d) (n = 8/10/4/5) among basophils in the spleen from mice as in (a). e Proportions (%) of CD19+CD138+ cells among CD45+ cells in spleen from the mice described in (a) (n = 11/11/3/4). f Anti-RNP IgG autoantibody plasma titers from the same mice as in (a) were quantified by ELISA and data were normalized to the mean of PBS-injected Mcpt8CT/+ values (n = 9/9/4/6). Left, Representative pictures of one glomerulus from mice with the indicated genotypes treated without (PBS, –) or with pristane (+) showing the intensity of anti-IgG (g) or anti-C3 (h) staining by immunofluorescence. Scale bar = 50 µm. Uncropped images are shown in Supplementary Fig. 9a (IgG) and 9b (C3). Right, quantification of IgG (g) and C3 (h) glomerular deposits in kidneys from the mice described in (a) (n = 10/9/4/6). ah Results are from at least three independent experiments and presented as individual values in bars representing the mean values ± s.e.m. Statistical analyses were done by two way ANOVA followed by Tukey’s multiple comparisons test between the indicated groups. P values are shown above each bracket. NS not significant. Source data are provided in the Source Data file.
Fig. 7
Fig. 7. Basophil-derived IL-4 controls T-dependent autoreactive antibody isotype switch in lupus-like disease.
a Proportions (%) of TFH cells among CD4+ T cells in spleen (left) (n = 12/10/6/8) and lymph nodes (LN) (right) (n = 13/11/6/8) from Mcpt8CT/+ (WT) (blue) or Mcpt8CT/+Il4fl/fl (Il4fl/fl) (red) mice injected with PBS (–) or pristane (+). b Proportions (%) of basophils among CD45+ cells in the spleen (left) (n = 12/11/6/8) and lymph nodes (right) (n = 13/11/6/8) from mice as in (a). c Proportions (%) of CD19+CD138+ cells CD45+ cells in the spleen (left) (n = 11/11/6/8) and lymph nodes (right) (n = 12/10/6/8) from the mice described in (a). d Proportions (%) of spontaneous IL-6+ cells among basophils in the spleen from the mice described in (a) (n = 8/10/6/8). e Anti-RNP IgG plasma levels from the same mice as in (a) were quantified by ELISA and normalized to the mean of PBS-injected Mcpt8CT/+ values (n = 9/9/5/7). (f) Quantification of C3 (left) and IgG (right) glomerular deposits in kidneys from the mice described in (a) (n = 10/9/6/8). A representative picture for each genotype in each condition is shown in Supplementary Fig. 9c, d. af The data shown that concerns Mcpt8CT/+ (WT) mice are the same as the data shown in Fig. 6. g Anti-RNP IgM plasma levels were determined by ELISA and data were normalized to the mean of the PBS-injected control values for each genotype. The mice analyzed were Mcpt8CT/+ (WT), Mcpt8CT/+Il4fl/fl (Il4fl/fl), Mcpt8CT/+Pdl1fl/fl (Pdl1fl/fl) (green) and basophil-deficient (Mcpt8CT/+R26DTA/+) (R26DTA/+, gray) mice treated with PBS or pristane (– or +, respectively) (n = 13/12/5/8/4/6/6/5). h Representative pictures of kidneys from mice with the indicated genotypes injected with PBS or pristane showing the intensity of anti-IgM staining by immunofluorescence. Scale bar = 200 µm. i Quantification of IgM glomerular deposits in kidneys from the mice described in (g) (n = 15/15/6/8/4/6/5/5). ai Results are from at least three independent experiments and presented as individual values in bars representing the mean values ± s.e.m. ag, i Statistical analyses were done by two way ANOVA followed by Tukey’s multiple comparisons test between the indicated groups. P values are shown above each bracket. NS not significant. Source data are provided in the Source Data file.
Fig. 8
Fig. 8. IL-4 and IL-3 control PD-L1 expression, activation and localization of basophils in lupus-like models.
a PD-L1 expression levels on basophils from spleen (left) (n = 22/14/5/8) and lymph nodes (LN) (right) (n = 13/10/6/8) from Mcpt8CT/+ (WT) (blue) or Mcpt8CT/+Il4fl/fl (Il4fl/fl) (red) mice injected with PBS (–) or with pristane (+). b IL-3 titers (in pg/mL) in the plasma from Mcpt8CT/+ (WT) (blue), Mcpt8CT/+Il4fl/fl (Il4fl/fl) (red), Mcpt8CT/+Pdl1fl/fl (Pdl1fl/fl) (green), basophil-deficient (Mcpt8CT/+R26DTA/+) (gray) mice injected with PBS (–) or with pristane (+) and in aged (min. 30 weeks old) Mcpt8DTR (WT) and Lyn–/–Mcpt8DTR mice (pink) (n = 7/12/6/8/4/5/6/5/3/3). c Aged Lyn–/– mice were injected with isotype control (rat IgG1,κ; Iso; black), rat anti-mouse IL-3 (αIL-3; blue) or rat anti-mouse IL-4 (αIL-4; red) as indicated. PD-L1 (d) (n = 7/9/6) and CD200R1 (e) (n = 6/9/6) expression levels on basophils from spleen of mice described in (c) (Left) as measured by flow cytometry (Right). f Proportions (%)of basophils among CD45+ splenocytes of mice as in (c) (n = 7/9/6). g Proportions (%) of TFH cells among CD4+ T cells from spleen of mice as in (c) (n = 4/6/6). h Proportions of CD19+CD138+ cells among CD45+ cells from lymph nodes (LN) (%) of mice as in (c) (n = 4/6/6) (Right) as measured by flow cytometry (Left). a, b, dh Results are from at least two independent experiments and presented as individual values in bars representing the mean values ± s.e.m. a, b, dh Statistical analyses were done by two-way ANOVA test followed by Tukey’s multiple comparisons tests (a), by one-way ANOVA test followed by two-sided unpaired t tests (b) between the indicated groups, or by one-way ANOVA test followed by Tukey’s multiple comparisons tests (dh) between the indicated groups. P values are shown above each bracket. NS not significant. Source data are provided in the Source Data file.
Fig. 9
Fig. 9. Human basophils drive TFH cell and TFH2 cell differentiation through IL-4, IL-6 and PD-1 dependent mechanisms ex vivo.
Contour plots showing CD3/CD28-activated human CD4+ T cells cultured for three days without (a) or with (b) purified human basophils at a 5:1 ratio (left) and the condition-induced TFH differentiation of the CD4 + T cells (right). Basophils were defined as FcεRIα+ CRTH2+ CCR3+ cells and TFH cells were defined as CD4+ PD-1+ CXCR5+ ICOS+ cells. c Proportions (%) of TFH cells among CD3/CD28-activated CD4+ T cells cultured without (0:1) or with the indicated ratio of purified human basophils (n = 4 per group). d Proportions (%) of TFH cells among CD3/CD28-activated CD4+ T cells cultured without or with purified human basophils at a ratio of 1:5 in the absence (–) (blue) or presence of antibodies blocking IL-4 (αIL-4) (red), IL-6 (αIL-6) (orange) or PD-1 (αPD-1) (green) or the corresponding isotype controls (Iso) (blue) (n = 4/3/6/6/6/6/5/5/8/8/8/8). e Contour plots showing subsets of TFH cells as defined in Fig. 1 on cells as in (a, b). f Proportions (%) of TFH2 cells among TFH cells after culture as described in (d) (n = 5/5/8/8/8/8). TFH2 cells were defined as CD4+ PD-1+ CXCR5+ ICOS+ CCR6 CXCR3 cells. c, d, f Data are presented as individual values in bars representing the mean values ± s.e.m. c One representative experiment out of two with cells from 4 different donors is shown. d, f Results are from three independent experiments. c, d, f Statistical analyses were done by one-way ANOVA test followed by Tukey’s multiple comparisons tests between the indicated groups. P values are shown above each bracket. NS not significant. Source data are provided in the Source Data file.

References

    1. Anders HJ, et al. Lupus nephritis. Nat. Rev. Dis. Prim. 2020;6:7. doi: 10.1038/s41572-019-0141-9. - DOI - PubMed
    1. Tsokos GC. Autoimmunity and organ damage in systemic lupus erythematosus. Nat. Immunol. 2020;21:605–614. doi: 10.1038/s41590-020-0677-6. - DOI - PMC - PubMed
    1. Murphy G, Isenberg DA. Biologic therapies for systemic lupus erythematosus: where are we now? Curr. Opin. Rheumatol. 2020;32:597–608. doi: 10.1097/BOR.0000000000000736. - DOI - PubMed
    1. Gensous N, Schmitt N, Richez C, Ueno H, Blanco P. T follicular helper cells, interleukin-21 and systemic lupus erythematosus. Rheumatology. 2017;56:516–523. - PubMed
    1. Kim SJ, Lee K, Diamond B. Follicular helper T Cells In Systemic Lupus Erythematosus. Front. Immunol. 2018;9:1793. doi: 10.3389/fimmu.2018.01793. - DOI - PMC - PubMed

Publication types

MeSH terms