. 2024 Apr 22;15(1):3396.
doi: 10.1038/s41467-024-47523-x.

Consistent signatures in the human gut microbiome of old- and young-onset colorectal cancer

Affiliations

Consistent signatures in the human gut microbiome of old- and young-onset colorectal cancer

Youwen Qin et al. Nat Commun. .

Abstract

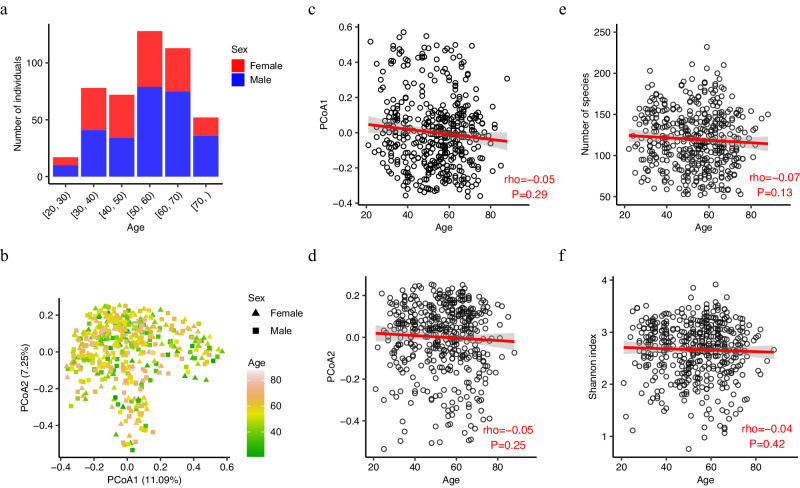
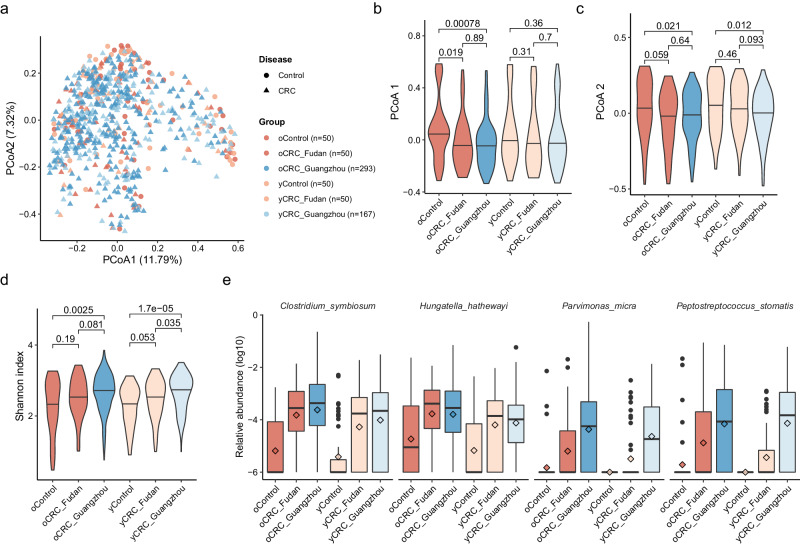
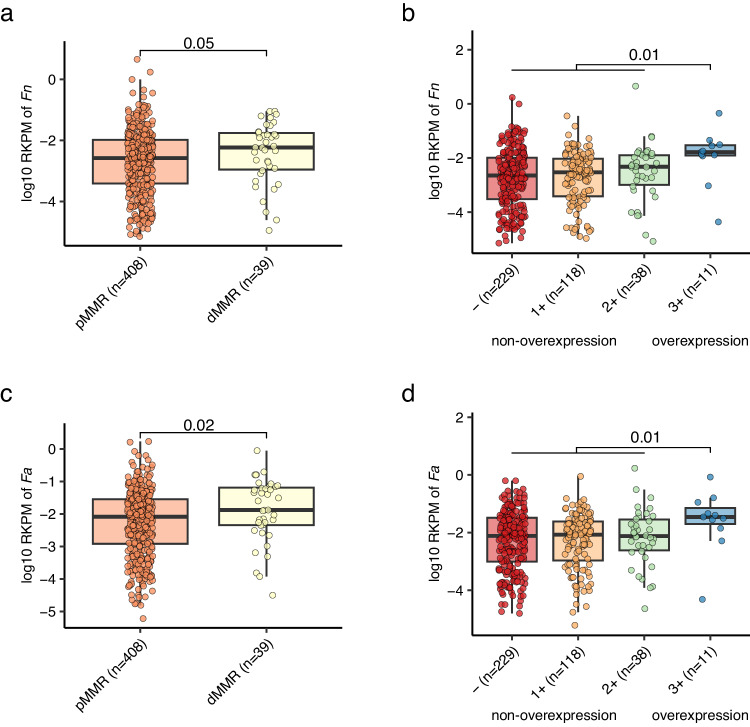
The incidence of young-onset colorectal cancer (yCRC) has been increasing in recent decades, but little is known about the gut microbiome of these patients. Most studies have focused on old-onset CRC (oCRC), and it remains unclear whether CRC signatures derived from old patients are valid in young patients. To address this, we assembled the largest yCRC gut metagenomes to date from two independent cohorts and found that the CRC microbiome had limited association with age across adulthood. Differential analysis revealed that well-known CRC-associated taxa, such as Clostridium symbiosum, Peptostreptococcus stomatis, Parvimonas micra and Hungatella hathewayi were significantly enriched (false discovery rate <0.05) in both old- and young-onset patients. Similar strain-level patterns of Fusobacterium nucleatum, Bacteroides fragilis and Escherichia coli were observed for oCRC and yCRC. Almost all oCRC-associated metagenomic pathways had directionally concordant changes in young patients. Importantly, CRC-associated virulence factors (fadA, bft) were enriched in both oCRC and yCRC compared to their respective controls. Moreover, the microbiome-based classification model had similar predication accuracy for CRC status in old- and young-onset patients, underscoring the consistency of microbial signatures across different age groups.


Conflict of interest statement

All authors declare no competing interests.

Figures

Fig. 1
Fig. 1. Limited association between the gut microbiome and age in CRC patients.
a The number of patients in the Guangzhou cohort stratified by age and sex. b Two-dimension scatter plot shows the overall pattern of samples. Principle coordinate analysis (PCoA) was performed based on the Bray–Curtis distance calculated from the abundance profile at species level. Each point represents one sample, and color scale indicates age. Samples from female and male patients are in triangles and squares, respectively. Scatterplots of relationship between age and PCoA axis 1 (c), PCoA axis 2 (d), number of species (e), and Shannon index (f). The correlation coefficient was calculated using the Spearman method. The solid red line was fitted by smooth function in R, and the gray area is the 95% confidence interval. The Shannon index was calculated based on the abundance profile at the species level.
Fig. 2
Fig. 2. Consistent changes of CRC-associated microbes in old- and young-onset patients in two independent cohorts.
a Two-dimension scatter plot shows the overall distribution of Fudan and Guangzhou samples. Principle coordinate analysis (PCoA) was performed based on the Bray–Curtis distance calculated from the abundance profile at species level. Each point represents one sample. Samples from Fudan and Guangzhou cohorts are in red and blue, respectively. Circles are control samples, while triangles are CRC samples. Violin plots show values of PCoA axis 1 (b) PCoA axis 2 (c), and Shannon index (d) across different groups. The thick horizon line indicates the 50% percentile. P values on the top were calculated by two-side Wilcoxon rank-sum test. e Four well-known CRC-enriched species significantly enriched in both oCRC and yCRC patients at false discovery rate (FDR) adjusted P < 0.05. The sample size of each group is the same as a. The relative abundance is in log10 scale and zeros were replaced by a small value. The box plots show the median (thick line), interquartile range (box limits), 1.5× the interquartile range span (whiskers), and outliers (dots). Diamond shape indicates the mean abundance.
Fig. 3
Fig. 3. Higher prevalence and abundance of F. animalis than F. nucleatum in CRC patients.
Heatmap shows the abundance, genome-wide breadth, and coverage of F. nucleatum (Fn) and F. animalis (Fa). Only 110 samples which had genome breadth >0.1 and coverage >0.1 for Fn (RefSeq GCF_008633215.1) or Fa (RefSeq GCF_000158275.2) reference genomes were included. Samples were sorted in decreasing order by the relative abundance of Fn, calculated by MetaPhlAn 3.
Fig. 4
Fig. 4. Enrichment of CRC-associated virulence factors and toxins in old- and young-onset patients in two independent cohorts.
a Normalized log abundance of CRC-associated virulence factors in different groups. RPM means reads per million mapped reads, see Methods for gene quantification. fadA encodes F. nucleatum adhesion protein A; bft encodes B. fragilis enterotoxin; the pks genomic island encodes enzymes to produce genotoxic colibactin (in E. coli); the bai operon encodes bile acid-converting enzymes (present in some Clostridiales species). Sample sizes for the compared groups: oControl (n = 50), oCRC_Fudan (n = 50), oCRC_Guangzhou (n = 293), yControl (n = 50), yCRC_Fudan (n = 50), yCRC_Guangzhou (n = 167). b Normalized log abundances of fadA stratified by the presence of F. nucleatum (Fn) and F. animilis (Fa). Presence was defined as genome breadth >0.1 and coverage >0.1. c Normalized log abundance and prevalence of bft stratified by B. fragilis strain clusters. Cluster assignment was conducted based on marker genes and genome-wide sequence analysis (Methods). P values on the top were calculated by two-side Wilcoxon rank-sum test. d Correlation between normalized log abundances of pks and E. coli. The correlation coefficient was calculated using the Spearman method. The solid (blue and red) lines were fitted by smooth function in R, and the gray area is the 95% confidence interval. The boxplot conventions are consistent with the description in Fig. 2.
Fig. 5
Fig. 5. Enrichment of Fn and Fa in dMMR and HER2 overexpression patients.
The abundances of Fn (a) and Fa (c) were higher in dMMR patients compared to pMMR patients. The abundances of Fn (b) and Fa (d) were higher in HER2 overexpression patients compared to non-overexpression patients. Fn and Fa abundances were determined by genome-wide reads mapping to their reference genome (Methods). MMR and HER2 status were determined by immunohistochemistry test. RKPM: reads per kilobase per million reads. P values on the top were calculated by two-side Wilcoxon rank-sum test. The boxplot conventions are consistent with the description in Fig. 2.
Fig. 6
Fig. 6. Prediction accuracy of CRC status in old- and young-onset patients.
Prediction performance on oCRC and yCRC in the Fudan cohort and Guangzhou cohort using models trained on species-level abundances from different datasets. Models were trained on two different methods: random forest and LASSO logistic regression. The numerical values are the area under receiver operator curve (AUROC) for a and c, and the recall rate for b and d. Asterisks denote the values averaged over 100 times of 10-fold cross-validation. oFD means the 100 metagenomes of Fudan oCRC and oControl; yFD means the 100 metagenomes of Fudan yCRC and yControl; Public means 1262 public metagenomes; Public_GZ means 1262 public metagenomes plus 460 Guangzhou metagenomes; Public_FD means 1262 public metagenomes plus 200 Fudan metagenomes.

References

    1. Sung H, et al. Global Cancer Statistics 2020: GLOBOCAN estimates of incidence and mortality worldwide for 36 cancers in 185 countries. CA Cancer J. Clin. 2021;71:209–249. doi: 10.3322/caac.21660. - DOI - PubMed
    1. Keum N, Giovannucci E. Global burden of colorectal cancer: emerging trends, risk factors and prevention strategies. Nat. Rev. Gastroenterol. Hepatol. 2019;16:713–732. doi: 10.1038/s41575-019-0189-8. - DOI - PubMed
    1. Patel SG, Karlitz JJ, Yen T, Lieu CH, Boland CR. The rising tide of early-onset colorectal cancer: a comprehensive review of epidemiology, clinical features, biology, risk factors, prevention, and early detection. Lancet. Gastroenterol. Hepatol. 2022;7:262–274. doi: 10.1016/S2468-1253(21)00426-X. - DOI - PubMed
    1. Wong SH, Yu J. Gut microbiota in colorectal cancer: mechanisms of action and clinical applications. Nat. Rev. Gastroenterol. Hepatol. 2019;16:690–704. doi: 10.1038/s41575-019-0209-8. - DOI - PubMed
    1. Ternes D, et al. Microbiome in colorectal cancer: how to get from meta-omics to mechanism? Trends Microbiol. 2020;28:401–423. doi: 10.1016/j.tim.2020.01.001. - DOI - PubMed

Publication types

LinkOut - more resources