. 2024 Apr 22;14(1):9177.
doi: 10.1038/s41598-024-59834-6.

An increase in ER stress and unfolded protein response in iPSCs-derived neuronal cells from neuronopathic Gaucher disease patients

Affiliations

An increase in ER stress and unfolded protein response in iPSCs-derived neuronal cells from neuronopathic Gaucher disease patients

Tanapat Pornsukjantra et al. Sci Rep. .

Abstract

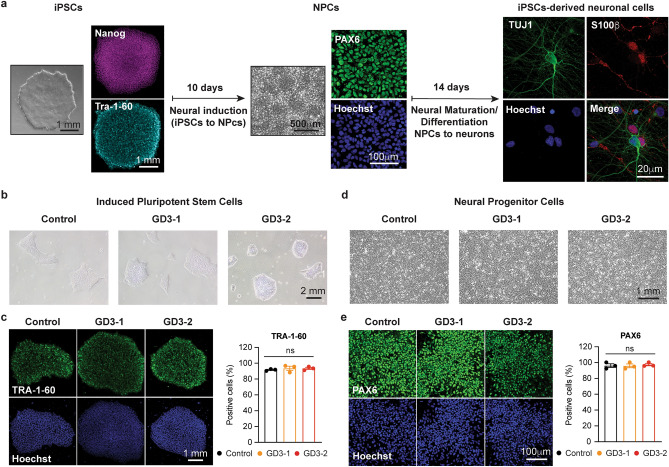
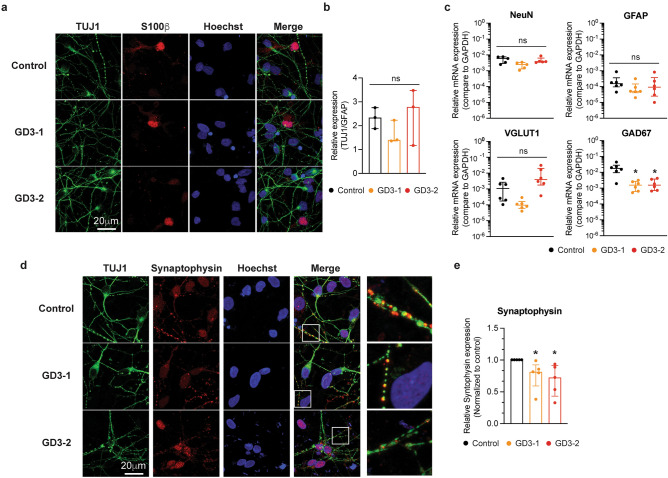
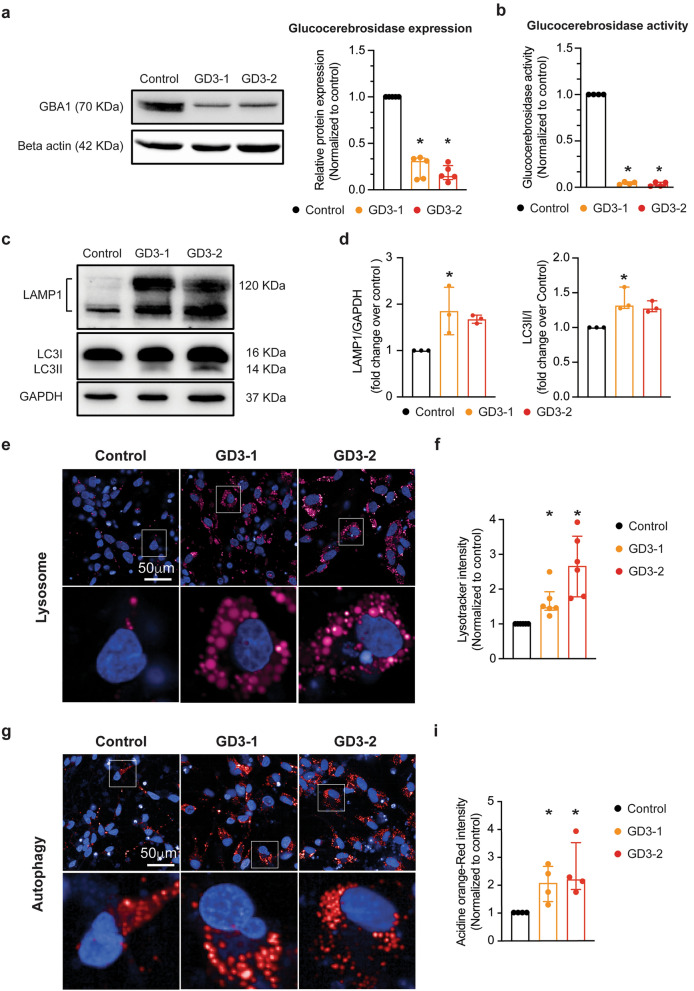
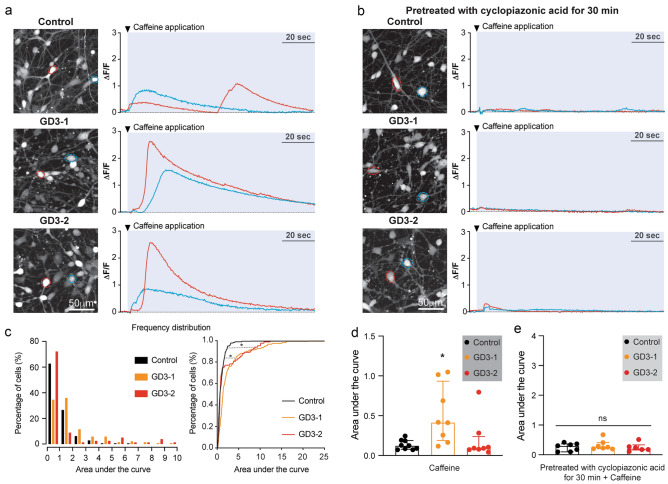
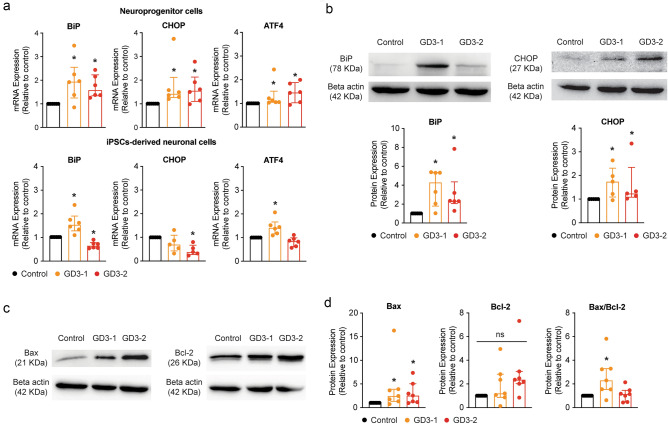
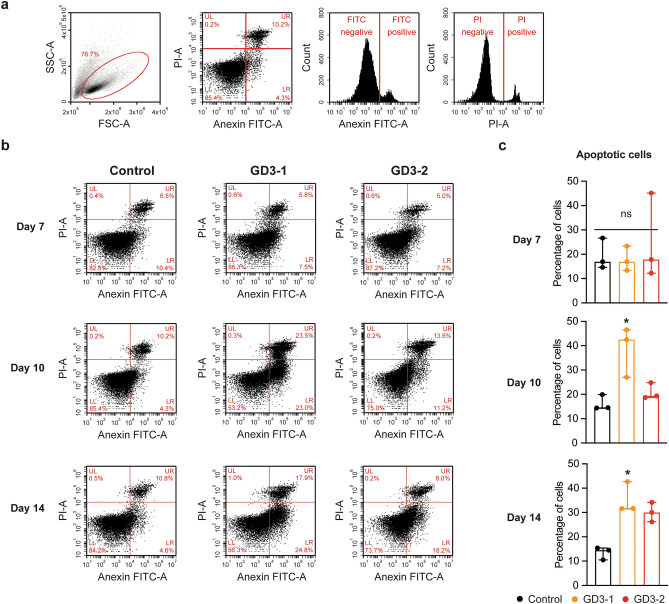
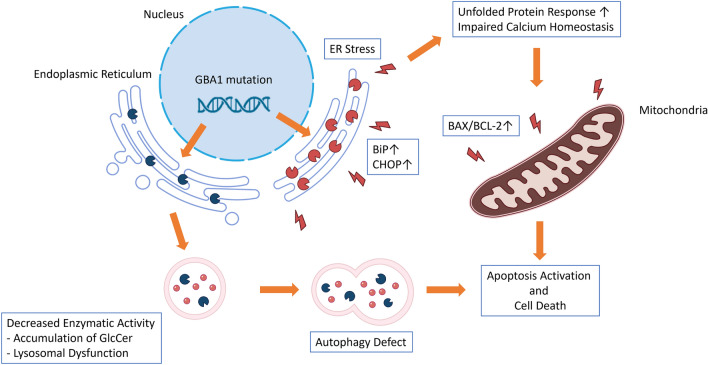
Gaucher disease (GD) is a lysosomal storage disorder caused by a mutation in the GBA1 gene, responsible for encoding the enzyme Glucocerebrosidase (GCase). Although neuronal death and neuroinflammation have been observed in the brains of individuals with neuronopathic Gaucher disease (nGD), the exact mechanism underlying neurodegeneration in nGD remains unclear. In this study, we used two induced pluripotent stem cells (iPSCs)-derived neuronal cell lines acquired from two type-3 GD patients (GD3-1 and GD3-2) to investigate the mechanisms underlying nGD by biochemical analyses. These iPSCs-derived neuronal cells from GD3-1 and GD3-2 exhibit an impairment in endoplasmic reticulum (ER) calcium homeostasis and an increase in unfolded protein response markers (BiP and CHOP), indicating the presence of ER stress in nGD. A significant increase in the BAX/BCL-2 ratio and an increase in Annexin V-positive cells demonstrate a notable increase in apoptotic cell death in GD iPSCs-derived neurons, suggesting downstream signaling after an increase in the unfolded protein response. Our study involves the establishment of iPSCs-derived neuronal models for GD and proposes a possible mechanism underlying nGD. This mechanism involves the activation of ER stress and the unfolded protein response, ultimately leading to apoptotic cell death in neurons.

Keywords: ER stress; Gaucher disease; LSDs; UPR; iPSCs-derived neurons.


Conflict of interest statement

The authors declare no competing interests.

Figures

Figure 1
Figure 1
Normal iPSCs and NPCs properties in cells generated by 2 Gaucher disease patients. (a) Schematic representation of a three-steps neuronal differentiation protocol starting from iPSCs (left), NPCs (middle) and iPSCs-derived neuronal cells (Right) with corresponding protein marker expression. (b) Bright field images of iPSCs colonies in Control (left), GD3-1 (middle) and GD3-2 (right) samples. (c) (Left) TRA-1–60 and Hoechst fluorescence in control, GD3-1 and GD3-2 iPSCs groups. (Right) Summary of TRA-1–60 positive cells detected by flow cytometry in control, GD3-1 and GD3-2 iPSCs groups (Kruskal–Wallis test: H(2) = 1.07, p = 0.66, n = 3 technical replicates). (d) Bright field images of NPCs in Control (left), GD3-1 (middle) and GD3-2 (right) samples. (e) (Left) PAX6 and Hoechst fluorescence in control, GD3-1 and GD3-2 iPSCs groups. (Right) Summary of PAX6 positive cells detected by flow cytometry in control, GD3-1 and GD3-2 iPSCs groups (Kruskal–Wallis test: H(2) = 0.84, p = 0.70, n = 3 technical replicates).
Figure 2
Figure 2
Characterization of neuronal subtype differentiation and synaptic marker in iPSCs-derived neuronal cells from GD patients. (a) Representative images of TUJ1, S100b, Hoechst and merge fluorescence in iPSCs-derived neuronal cells from control (top), GD3-1 (middle) and GD3-2 (bottom) samples. (b) Summary of the relative expression of TUJ1 over GFAP immunofluorescence per cell in GD3-1 and GD3-2 compared to control group (Kruskal–Wallis test: H(2) = 1.69, p = 0.51, n = 3 technical replicates). (c) Bar graphs representing the relative mRNA expression levels of NeuN (top left, Kruskal–Wallis test: H(2) = 6.02, p = 0.08 for Control vs. GD3-1, p > 0.99 for Control vs. GD3-2, n = 5 technical replicates), VGLUT1 (Kruskal–Wallis test: H(2) = 11.24, p = 0.09 for Control vs. GD3-1, p = 0.09 for Control vs. GD3-2, n = 6 technical replicates), GAD67 (bottom left, Kruskal–Wallis test: H(2) = 8.57, p = 0.01 for Control vs. GD3-1, p = 0.04 for Control vs. GD3-2, n = 6 technical replicates) and GFAP (bottom right, Kruskal–Wallis test: H(2) = 2.21, p = 0.35, n = 6 technical replicates) in iPSCs-derived neuronal cells from control, GD3-1 and GD3-2 samples. (d) Representative images of TUJ1, Synaptophysin, Hoechst and merge fluorescence in iPSCs-derived neuronal cells from control (top), GD3-1 (middle) and GD3-2 (bottom). e. Summary of the relative average synaptophysin immunofluorescence per cell in GD3-1 and GD3-2 compared to control group (Kruskal–Wallis test: H(2) = 9.85, p = 0.02 for Control vs. GD3-1, p < 0.01 for Control vs. GD3-2, n = 5 technical replicates).
Figure 3
Figure 3
Investigation of GD phenotypes in iPSCs-derived neuronal cells acquired from neuronopathic GD. (a) (Left) Representative western blot images of GBA1 and beta actin from iPSCs-derived neuronal cells from control, GD3-1 and GD3-2 samples. (Right) Bar graph summarizing of the relative normalized GBA1 protein expression in GD3-1 and GD3-2 compared to control group (Kruskal–Wallis test: H(2) = 10.14, p = 0.04 for Control vs. GD3-1, p < 0.01 for Control vs. GD3-2, n = 5 technical replicates). (b) Bar graphs representing the relative glucocerebrosidase activity in iPSCs-derived neuronal cells (right, Kruskal–Wallis test: H(2) = 8.01, p = 0.04 for Control vs. GD3-1, p < 0.01 for Control vs. GD3-2, n = 4 technical replicates) in GD3-1 and GD3-2 compared to control group. (c) Representative cropped western blot images of LAMP1, LC3I/II and GAPDH from iPSCs-derived neuronal cells from control, GD3-1 and GD3-2 samples (all replicate images are included in the supplementary information file). (d) Bar graph summarizing of the relative normalized LAMP1(left, Kruskal–Wallis test: H(2) = 5.79, p = 0.02 for Control vs. GD3-1, p = 0.07 for Control vs. GD3-2, n = 3 technical replicates) and LC3I/II (right, Kruskal–Wallis test: H(2) = 6.16, p = 0.02 for Control vs. GD3-1, p = 0.10 for Control vs. GD3-2, n = 3 technical replicates) protein expression in GD3-1 and GD3-2 compared to control group. (e) (Top) Representative images of SiR lysosome staining in iPSCs-derived neuronal cells from control, GD3-1 and GD3-2 samples. (Bottom left) Expanded micrograph of boxed region demarcated in the corresponding images. (f) Summary of the relative average SiR lysosome staining per cell in GD3-1 and GD3-2 compared to control group (Kruskal–Wallis test: H(2) = 14.9, p = 0.04 for Control vs. GD3-1, p < 0.01 for Control vs. GD3-2, n = 6 technical replicates). (g) (Top) Representative images of acridine orange staining in iPSCs-derived neuronal cells from control, GD3-1 and GD3-2 samples. (Bottom) Expanded micrograph of boxed region demarcated in corresponding images. (h) Summary of the relative average acridine orange staining per cell in GD3-1 and GD3-2 compared to control group (Kruskal–Wallis test: H(2) = 7.69, p = 0.04 for Control vs. GD3-1, p = 0.03 for Control vs. GD3-2, n = 4 technical replicates).
Figure 4
Figure 4
Increase in Caffeine-induced Ca2+ release in iPSCs derived neuronal cells from GD. (a) (Left) Maximum intensity projection (MIP) images of Fluor-8 fluorescence of iPSCs-derived neuronal cells from control, GD3-1 and GD3-2 samples. (Right) Two representative traces recorded from cells marked with a respective color in the MIP images corresponding to the left panel during caffeine application (indicated by tick mark). (b) (Left) Maximum intensity projection (MIP) image of Fluor-8 fluorescence of iPSCs-derived neuronal cells from control, GD3-1 and GD3-2 samples pretreated with cyclopiazonic acid for 30 min. (Right) Two representative traces recorded from cells marked with a respective color in the MIP images corresponding left panel during caffeine application (indicated by tick mark). (c) (Left) Histograms representing the distribution of area under the curve of Ca2+ transients during caffeine application (blue area in A) in iPSCs-derived neuronal cells from control (black), GD3-1 (orange) and GD3-2 (red) samples. (Right) Cumulative distribution of area under the curve of Ca2+ transients during caffeine application (blue area in A) in iPSCs-derived neuronal cells from control (black), GD3-1 (orange) and GD3-2 (red) samples (Two-sample Kolmogorov–Smirnov test: D = 0.33, p < 0.01 for Control vs. GD3-1; D = 0.19, p = 0.02 for Control vs. GD3-1, n = 177, 150 and 83 cells for control, GD3-1 and GD3-2, respectively). (d) Summary of the average area under the curve of Ca2+ transients during caffeine application per experimental in control, GD3-1 and GD3-2 groups (Kruskal–Wallis test: H(2) = 8.83, p = 0.02 for Control vs. GD3-1, p > 0.99 for Control vs. GD3-2, n = 9,8 and 8 technical replicates for Control, GD3-1 and GD3-2, respectively). e. Summary of the average area under the curve of Ca2+ transients during caffeine application with pretreatment with cyclopiazonic acid per experimental in control, GD3-1 and GD3-2 groups (Kruskal–Wallis test: H(2) = 0.89, p = 0.66, n = 7,7 and 6 technical replicates for Control, GD3-1 and GD3-2, respectively).
Figure 5
Figure 5
Observation of ER stress and UPR activation in iPSCs-derived neuronal cells from GD. (a) (Top) Bar graphs representing the relative mRNA expression levels of BiP (left, Kruskal–Wallis test: H(2) = 8.20, p = 0.02 for Control vs. GD3-1, p = 0.03 for Control vs. GD3-2, n = 6 technical replicates), CHOP (middle, Kruskal–Wallis test: H(2) = 8.24, p < 0.01 for Control vs. GD3-1, p = 0.02 for Control vs. GD3-2, n = 6 technical replicates) and ATF4 (right, Kruskal–Wallis test: H(2) = 8.20, p = 0.02 for Control vs. GD3-1, p = 0.01 for Control vs. GD3-2, n = 6 technical replicates) in NPCs from control, GD3-1 and GD3-2 samples. (Bottom) Bar graphs representing the relative mRNA expression levels of BiP (left, Kruskal–Wallis test: H(2) = 15.73, p = 0.04 for Control vs. GD3-1, p = 0.04 for Control vs. GD3-2, n = 6 technical replicates), CHOP (middle, Kruskal–Wallis test: H(2) = 7.55, p = 0.11 for Control vs. GD3-1, p < 0.01 for Control vs. GD3-2, n = 5 technical replicates) and ATF4 (right, Kruskal–Wallis test: H(2) = 12.75, p = 0.02 for Control vs. GD3-1, p = 0.21 for Control vs. GD3-2, n = 6 technical replicates) in iPSCs-derived neuronal cells from control, GD3-1 and GD3-2 samples. (b) (Top) Representative cropped western blot images of GBA1 and CHOP from iPSCs-derived neuronal cells from control, GD3-1 and GD3-2 samples. (Bottom) Bar graphs summarizing of the relative normalized BiP (Kruskal–Wallis test: H(2) = 11.9, p < 0.01 for Control vs. GD3-1, p < 0.01 for Control vs. GD3-2, n = 6 technical replicates) and CHOP (Kruskal–Wallis test: H(2) = 6.24, p = 0.04 for Control vs. GD3-1, p = 0.03 for Control vs. GD3-2, n = 5 technical replicates) protein expression in GD3-1 and GD3-2 compared to control group. (c) Representative cropped western blot images of Bax (left) and Bcl-2 (right) from iPSCs-derived neuronal cells from control, GD3-1 and GD3-2 samples. (d) Bar graphs summarizing of the relative normalized Bax (Kruskal–Wallis test: H(2) = 7.09, p = 0.02 for Control vs. GD3-1, p = 0.03 for Control vs. GD3-2, n = 7 technical replicates) , Bcl-2 (Kruskal–Wallis test: H(2) = 5.46, p = 0.06, n = 7 technical replicates) and the ratio of Bax/Bcl-2 (Kruskal–Wallis test: H(2) = 7.93, p < 0.01 for Control vs. GD3-1, p = 0.36 for Control vs. GD3-2, n = 7 technical replicates) protein expression in GD3-1 and GD3-2 compared to control group. All replicate western blot images are included in the supplementary information file.
Figure 6
Figure 6
Different in neuronal apoptosis in iPSCs-derived neuronal cell from GD patients. (a) Scatter plots represent a complete gating strategy in the flow cytometry analysis. (b) Scatter plots represent the intensities of PI and AnnexinV-FITC fluorescent at day 7, 10 and 14 of neuronal differentiation in control, GD3-1 and GD3-2 groups. (c) Bar graphs represent the percentage of apoptotic cells at day 7 (Kruskal–Wallis test: H(2) = 0.16, p = 0.95, n = 3 technical replicates), day 10 (Kruskal–Wallis test: H(2) = 5.97, p = 0.02 for Control vs. GD3-1, p = 0.46 for Control vs. GD3-2, n = 3 technical replicates) and day 14 (Kruskal–Wallis test: H(2) = 5.96, p = 0.02 for Control vs. GD3-1, p = 0.10 for Control vs. GD3-2, n = 3 technical replicates) of neuronal differentiation.
Figure 7
Figure 7
Mechanism of ER stress and unfolded protein response induced cellular injury in iPSCs-derived neuronal cell from GD patient. A schematic showing GBA1 mutation causing ER stress and triggering unfolded protein response leading to cellular death in iPSCs-derived neuronal cells from GD patients.

Similar articles

Cited by

References

    1. Grabowski GA. Phenotype, diagnosis, and treatment of Gaucher’s disease. Lancet. 2008;372(9645):1263–1271. doi: 10.1016/S0140-6736(08)61522-6. - DOI - PubMed
    1. Stirnemann J, Belmatoug N, Camou F, Serratrice C, Froissart R, Caillaud C, et al. A review of Gaucher disease pathophysiology, clinical presentation and treatments. Int. J. Mol. Sci. 2017;18(2):441. doi: 10.3390/ijms18020441. - DOI - PMC - PubMed
    1. Mignot C, Gelot A, Bessieres B, Daffos F, Voyer M, Menez F, et al. Perinatal-lethal Gaucher disease. Am. J. Med. Genet. A. 2003;120A(3):338–344. doi: 10.1002/ajmg.a.20117. - DOI - PubMed
    1. Biegstraaten M, van Schaik IN, Aerts JM, Langeveld M, Mannens MM, Bour LJ, et al. A monozygotic twin pair with highly discordant Gaucher phenotypes. Blood Cells Mol. Dis. 2011;46(1):39–41. doi: 10.1016/j.bcmd.2010.10.007. - DOI - PMC - PubMed
    1. Sidransky E. Gaucher disease: complexity in a “simple” disorder. Mol. Genet. Metab. 2004;83(1–2):6–15. doi: 10.1016/j.ymgme.2004.08.015. - DOI - PubMed

Publication types