. 2024 Jul;9(7):1738-1751.
doi: 10.1038/s41564-024-01679-w. Epub 2024 Apr 22.

The nematode-trapping fungus Arthrobotrys oligospora detects prey pheromones via G protein-coupled receptors

Affiliations

The nematode-trapping fungus Arthrobotrys oligospora detects prey pheromones via G protein-coupled receptors

Chih-Yen Kuo et al. Nat Microbiol. 2024 Jul.

Abstract

The ability to sense prey-derived cues is essential for predatory lifestyles. Under low-nutrient conditions, Arthrobotrys oligospora and other nematode-trapping fungi develop dedicated structures for nematode capture when exposed to nematode-derived cues, including a conserved family of pheromones, the ascarosides. A. oligospora senses ascarosides via conserved MAPK and cAMP-PKA pathways; however, the upstream receptors remain unknown. Here, using genomic, transcriptomic and functional analyses, we identified two families of G protein-coupled receptors (GPCRs) involved in sensing distinct nematode-derived cues. GPCRs homologous to yeast glucose receptors are required for ascaroside sensing, whereas Pth11-like GPCRs contribute to ascaroside-independent nematode sensing. Both GPCR classes activate conserved cAMP-PKA signalling to trigger trap development. This work demonstrates that predatory fungi use multiple GPCRs to sense several distinct nematode-derived cues for prey recognition and to enable a switch to a predatory lifestyle. Identification of these receptors reveals the molecular mechanisms of cross-kingdom communication via conserved pheromones also sensed by plants and animals.


Conflict of interest statement

Competing interests

The authors declare no competing interests.

Figures

Extended Data Fig. 1 |
Extended Data Fig. 1 |. Phylogenetic tree of GPCRs from carbon receptor family.
A maximum-likelihood phylogenetic tree of GPCR protein sequences belonging to carbon receptor family from A. oligospora and orthologs from model fungi. Ani: Aspergillus nidulans. Ao: A. oligospora. Cal: Candida albicans. Cne: Cryptococcus neoformans. Fgr: F. graminearum. Mor: M. oryzae. Ncr: Neurospora crassa. Sce: S. cerevisiae. Uma: Ustilago maydis.
Extended Data Fig. 2 |
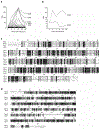
Extended Data Fig. 2 |. Expression of GINs and GPRs is up-regulated after exposure to C. elegans.
a, Transcripts per kilobase million (TPM) values of the differentially expressed Pth11-like GPCRs, with arrows indicating the five highly upregulated Pth11-like GPCRs. (The values represent the average of three independent biological replicates.). b, TPM values of the differentially expressed GPR2 and GPR3. (The values represent the average of three independent biological replicates.). c, d, Protein sequence alignment of Gins (c) and Gprs (d). Three levels of shading and three different symbols are used to indicate degrees of sequence similarity: black background with asterisk (*) indicates identical amino acids, intermediate grey background with colon (:) indicates conserved amino acids, and light grey with single dots (.) indicates semi-conserved amino acids.
Extended Data Fig. 3 |
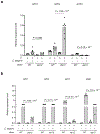
Extended Data Fig. 3 |. Expression of GPR3 and GINs is regulated by Ste12.
a, b, The expression level of GPR (a) and GIN (b) genes in the WT and ste12 mutant was evaluated using qPCR under with or without exposure to C. elegans. GPD1 was used as normalization control. (Data represent mean ± SEM; n shown along the x axis; two-tailed unpaired Student’s t-test; P values are unadjusted.).
Extended Data Fig. 4 |
Extended Data Fig. 4 |. The Gins and Gprs are not required for fungal growth.
a, Colonies of the WT, gin, and gpr mutants grown on PDA plates (5.5-cm diameter) for 3 days (Scale bar, 1 cm; the images are representative of three independent biological repeats.). b, Quantification of colony diameter for the A. oligospora WT and gpcr mutants. (Data represent mean ± SEM; n shown along the x axis; two-tailed unpaired Student’s t-test; P values are noted.).
Extended Data Fig. 5 |
Extended Data Fig. 5 |. Protein structural alignment of Gpr2, Gpr3, and SRBC-66.
a, b, TM-align was utilized to compare the protein structure of Gpr3 (depicted In green) with Gpr2 (depicted in blue) (a) and SRBC-66 (depicted in red) (b). (0.5 < TM-score < 1.00, in about the same fold). An overall map of the protein structural alignment between Gpr2 (blue), Gpr3 (green), and SRBC-66 (red) was based on the structural predictions from AlphaFold.
Extended Data Fig. 6 |
Extended Data Fig. 6 |. The prediction of ascaroside binding pocket in Gpr3.
Using SwissDock to predict the ascaroside binding pocket in Gpr3. An overall map of the docking interactions between Gpr3 (green) and and ascr#3 (a) and ascr#7 (b), based on the structural predictions from AlphaFold. The structural display of the amino acid region from 212 to 264 has been omitted due to its prediction as a random coil. Additionally, an enlarged schematic diagram highlights the potential ascaroside docking region in Gpr3.
Extended Data Fig. 7 |
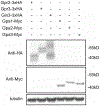
Extended Data Fig. 7 |. Western blot analysis with S. cerevisiae transformants expressing each GPCR-3×HA and Gpa-Myc.
Total proteins were extracted from S. cerevisiae expressing each GPCR-3×HA or each Gpa-Myc construct. The expected 48-kD GPCR-3×HA and 42-kD Gpa-Myc bands were detected in each transformants. Detection with the anti-tubulin antibody was used as the loading control. The blots are representative of two independent biological repeats.
Extended Data Fig. 8 |
Extended Data Fig. 8 |. The Gins are not required for ascaroside sensing.
a, Quantification of the trap numbers induced by ascarosides for the A. oligospora WT and gin mutants. (Data represent mean ± SEM; n shown along the x axis; two-tailed unpaired Student’s t-test; P values are noted.). b, Representative brightfield images of the traps induced by C. elegans in the A. oligospora WT and gin mutants. (Scale bar, 200 μm. Black arrow indicates trap; the images are representative of three independent biological repeats.). c, Quantification of the trap numbers induced by C. elegans for the A. oligospora WT and gin mutants. (Data represent ± SEM; n shown along the x axis; two-tailed unpaired Student’s t-test; P values are noted.). d, Images of traps formed by the A. oligospora WT and gin mutants after 24 hours of continuous induction with 400 C. elegans Vegetative hyphae and traps of A. oligospora were stained with SR2200, which specifically bound to fungal cell walls. (Scale bar, 20 μm; the images are representative of three independent biological repeats.). e, The localization of Gin1-GFP was displayed at 0, 2, and 10 hours after C. elegans induction. Merged image shows the GFP channel, FM4-64, and CMAC. (Scale bar, 10 μm; the images are representative of three independent biological repeats.) f, The expression level of GIN genes in the WT and gin3 mutant was evaluated using qPCR under with or without exposure to C. elegans. GPD1 was used as normalization control. (Data represent ± SEM; n shown along the x axis; two-tailed unpaired Student’s t-test; P values are noted.).
Extended Data Fig. 9 |
Extended Data Fig. 9 |. Distribution of GPCRs across the nine A. oligospora chromosomes.
GPCR-encoding genes from Pth11-like family (pink), carbon receptor (blue), and other classes (green) distribute across the nine A. oligospora chromosomes.
Extended Data Fig. 10 |
Extended Data Fig. 10 |. Hypothetical model of GPCRs-governed prey sensing and trap development in A. oligospora.
When Gpr2 and Gpr3 recognize ascr#3 and ascr#7, Gpa2 dissociates from the GPCRs and subsequently activates the downstream cAMP-PKA pathway. Additionally, Gin3 is activated by other unknown nematode-derived signals and also operates upstream of the cAMP-PKA pathway. PKA then phosphorylates the downstream substrates required for trap morphogenesis. Additionally, Gpr2, Gpr3, and Gin3 may be involved in the modulation of phosphorylation of Hog1. Gin3 may also partially activate the pheromone response MAPK pathway to induce the expression of GINs and GPR3, which may indicate their potential role as nematode-responsive genes and as receptors for unidentified nematode signals in A. oligospora.
Fig. 1 |
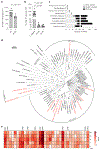
Fig. 1 |. Genomic and transcriptomic analyses of GPCRs in A. oligospora during nematode predation.
a, Quantification of the trap numbers induced by C. elegans WT and daf-22 lines in the A. oligospora WT (data represent mean ± s.e.m. from two-tailed unpaired Student’s t-tests, P values are noted). b, Quantification of the trap numbers induced by C. elegans and ascarosides for the A. oligospora WT (mean ± s.e.m. from two-tailed unpaired Student’s t-tests, P values are noted). c, Ascomycete fungi have differing numbers of GPCRs. Fungal genomes from Pezizomycotina (highlighted in bold), a subphylum of Ascomycota, have an increased number of putative GPCRs. Only Magnaporthe oryzae and Fusarium graminearum are phytopathogens. d, A phylogenetic tree of 83 putative GPCR proteins constructed by the maximum-likelihood method using fasttree_2.1. e, Differential expression profile of GPCRs transcripts from Pth11-like and carbon receptor families upon exposure to C. elegans at different timepoints from the previously published RNA sequencing data (hpe, hours post exposure; the beta value is approximately equivalent to log2 fold change).
Fig. 2 |
Fig. 2 |. The endocytosis of Gpr2 and Gpr3 is triggered by ascr#3 and ascr#7.
a, Representative brightfield images of the traps induced by C. elegans and ascarosides in the WT and gpr mutants (scale bar, 200 μm. Black arrows indicate traps. Images are representative of at least three independent biological repeats). b,c, Quantification of the trap numbers induced by ascarosides (b) and C. elegans (c) for the WT and gpr mutants (data represent mean ± s.e.m. from two-tailed unpaired Student’s t-tests, P values are noted). d, The localization of Gpr2–GFP and Gpr3–GFP was displayed at 0, 2 and 10 h of ascr#7 exposure. The merged image shows the GFP channel, FM4-64 and CMAC (hpe, hours post exposure; scale bar, 10 μm; the images are representative of three independent biological repeats).
Fig. 3 |
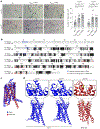
Fig. 3 |. Overexpression of Gpr2 or Gpr3 enhanced trap development in response to ascarosides.
a, Representative brightfield images of the traps induced by ascarosides in the WT and GPR overexpression lines. Quantification of the trap numbers induced by ascarosides for the WT and GPR overexpression lines (data represent mean ± s.e.m. from two-tailed unpaired Student’s t-tests, P values are noted). b, The protein sequence alignment of ascr#3 receptors from A. oligospora (Ao) and C. elegans (Ce). Three levels of shading and three different symbols are used to indicate degrees of sequence similarity: black background with asterisk (*) indicates identical amino acids, intermediate grey background with colon (:) indicates conserved amino acids and light grey with single dots (.) indicates semi-conserved amino acids. The colour shading for indicating the potential ascaroside binding pocket regions in SRBC-66 and Gpr2 is red and blue, respectively. c, Using TM-align to compare the protein structure between Gpr2 (blue) and SRBC-66 (red) (0.5 < TM score < 1.00, in about the same fold). The structural display of the amino acid region from 217 to 316 in Gpr2, as predicted from AlphaFold, has been omitted due to its prediction as a random coil. d, Using SwissDock to predict the ascaroside binding pocket in Gpr2 and SRBC-66. An overall map of the docking interactions between Gpr2 (blue) and SRBC-66 (red) with ascarosides, based on the structural predictions from AlphaFold. Additionally, an enlarged schematic diagram highlights the potential ascaroside docking region in both Gpr2 and SRBC-66.
Fig. 4 |
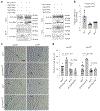
Fig. 4 |. Gpr2 and Gpr3 physically interact with Gpa2 in vivo.
GPCR–3×HA or Gpa–Myc constructs were heterologously expressed in S. cerevisiae. a, The co-IP assay displays the interaction between Gpa2 with Gpr2 as well as Gpr3. Total proteins were extracted from S. cerevisiae co-expressing each GPCR–3×HA with each Gpa–Myc or Gpr2–3×HA with Gpr3–Myc constructs. Immune complexes were pulled down using anti-HA magnetic beads, and the co-precipitation of each G protein α-subunit or Gpr3–Myc was examined by western blotting using anti-Myc antibody. HA-IP, immunoprecipitation of HA-tagged proteins. The blots are representative of three independent biological repeats. b, Intracellular cAMP levels in the WT, gpr2 and gpr3 lines were determined under with or without exposure to C. elegans. The results are expressed as fold changes in cAMP levels compared with the control for each condition (data represent mean ± s.e.m. from two-tailed unpaired Student’s t-tests, P values are noted). c, Representative brightfield images of the traps induced by ascarosides in gpr2, gpr3, gpr2/GPA2Q208L and gpr3/GPA2Q208L lines (scale bar, 200 μm). The distinct genetic interaction was observed between Gpr2 and Gpa2, while no interaction was discernible between Gpr3 and Gpa2. d, Quantification of the trap numbers induced by ascr#3 and ascr#7 for gpr2, gpr3, gpr2/GPA2Q208L and gpr3/GPA2Q208L lines (data represent mean ± s.e.m. from two-tailed unpaired Student’s t-tests, P values are noted.).
Fig. 5 |
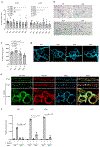
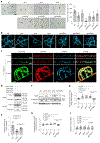
Fig. 5 |. Gin1, Gin3 and Gin4 sense nematode-derived cues and regulate trap development.
a, Left: representative brightfield images of the traps induced by C. elegans in the WT and gin mutants (scale bar, 200 μm; the black arrows indicate traps). Right: quantification of the trap numbers induced by C. elegans for the WT and gin mutant lines (data represent ± s.e.m., different letters indicate significant differences based on one-way analysis of variance followed by uncorrected Fisher’s least significant difference multiple test, with a threshold of P < 0.05, while those lacking significant differences were designated with the same letter.). b, Images of traps formed by the WT and gin strains after 24 h of continuous induction with 400 C. elegans. Vegetative hyphae and traps of A. oligospora were stained with SR2200, which specifically bound to fungal cell walls (scale bar, 20 μm; the images are representative of three independent biological repeats). c, The localization of Gin3–GFP displayed at 0, 2 and 10 h after C. elegans induction. The merged image shows the GFP channel, FM4-64 and CMAC (scale bar, 10 μm; the images are representative of three independent biological repeats). d, A co-IP assay displaying the interaction between Gpa2 with Gin3. Total proteins were extracted from S. cerevisiae co-expressing Gin3–3×HA with each Gpa–Myc construct. Immune complexes were pulled down using anti-HA magnetic beads, and the co-precipitation of each G protein α-subunit was examined by western blotting using anti-Myc antibody. The blots are representative of three independent biological repeats. e, Intracellular cAMP levels in the WT, gin3 and gin3GIN3 lines were determined with or without exposure to C. elegans. The results are expressed as fold changes in cAMP levels compared with the control for each condition (data are ±s.e.m. from two-tailed unpaired Student’s t-tests, P values are noted). f, Representative western blots displaying proteins extracted from hyphae of the WT, gpr2, gpr3, gin3 and gin3GIN3 with or without exposure to C. elegans were assayed for the activation of Fus3 (42 kDa) and Slt2 (44 kDa) or Hog1 (38 kDa) with the anti-TpEY and anti-TpGY antibodies, respectively. P-p38, phospho-p38; P-p44/42, phospho-p44/42. The blots are representative of three independent biological repeats. g,h, The densities of the Hog1 (g) and Slt2 (h) bands were analysed using Fiji software to estimate log2 fold changes in phosphorylation levels in hyphae of the WT, gpr2, gpr3, gin3 and gin3GIN3 with or without exposure to C. elegans (data represent ±s.e.m. from two-tailed unpaired Student’s t-tests, P values are noted). i, Band densities were analysed using Fiji software to estimate changes in Fus3 phosphorylation levels in hyphae of the WT, gpr2, gpr3, gin3 andgin3GIN3 after exposure to C. elegans (data represent ±s.e.m. from two-tailed unpaired Student’s t-tests, P values are noted). In g, h and i, samples were obtained from the same experiment, and the blots were processed in parallel.

References

    1. Brown NA, Schrevens S, Van Dijck P & Goldman GH Fungal G-protein-coupled receptors: mediators of pathogenesis and targets for disease control. Nat. Microbiol 3, 402–414 (2018). - PubMed
    1. van Dijck P et al. Nutrient sensing at the plasma membrane of fungal cells. Microbiol. Spectr 5, 2 (2017). - PMC - PubMed
    1. Martín J, Van Den Berg M, van Themaat EVL & Liras P Sensing and transduction of nutritional and chemical signals in filamentous fungi: impact on cell development and secondary metabolites biosynthesis. Biotechnol. Adv 37, 1–15 (2019). - PubMed
    1. Jiang C et al. An expanded subfamily of G-protein-coupled receptor genes in Fusarium graminearum required for wheat infection. Nat. Microbiol 4, 1582–1591 (2019). - PubMed
    1. Johns LE, Goldman GH, Ries LN & Brown NA Nutrient sensing and acquisition in fungi: mechanisms promoting pathogenesis in plant and human hosts. Fungal Biol. Rev 36, 1–14 (2021).

MeSH terms

Supplementary concepts

LinkOut - more resources