. 2024 May;9(5):1382-1392.
doi: 10.1038/s41564-024-01655-4. Epub 2024 Apr 22.

Targeted accurate RNA consensus sequencing (tARC-seq) reveals mechanisms of replication error affecting SARS-CoV-2 divergence

Affiliations

Targeted accurate RNA consensus sequencing (tARC-seq) reveals mechanisms of replication error affecting SARS-CoV-2 divergence

Catherine C Bradley et al. Nat Microbiol. 2024 May.

Abstract

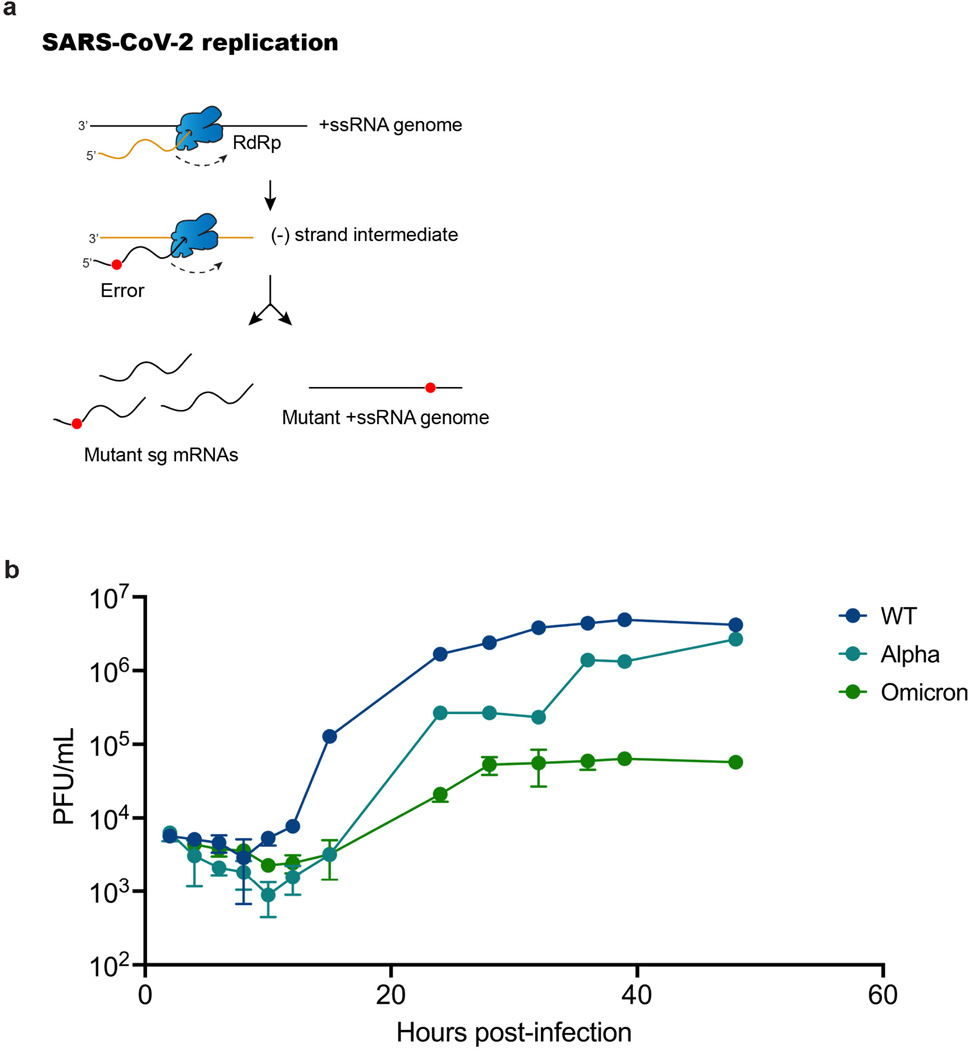
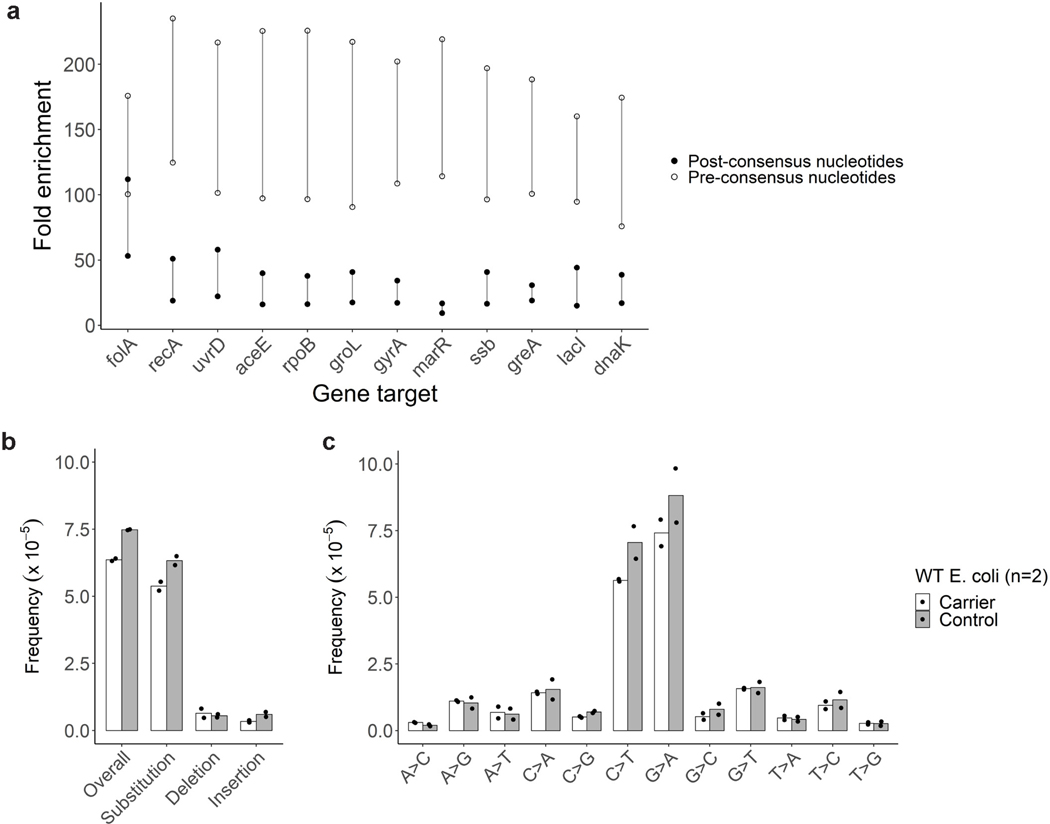
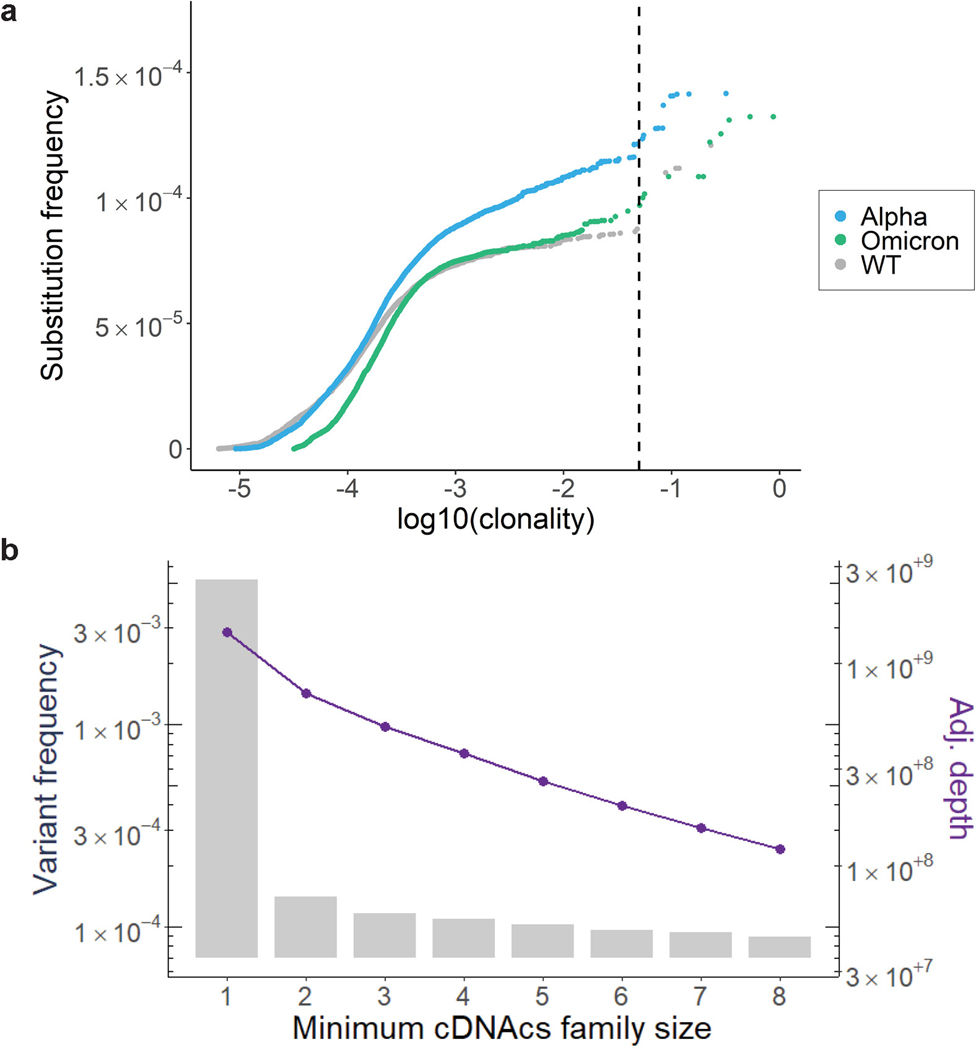
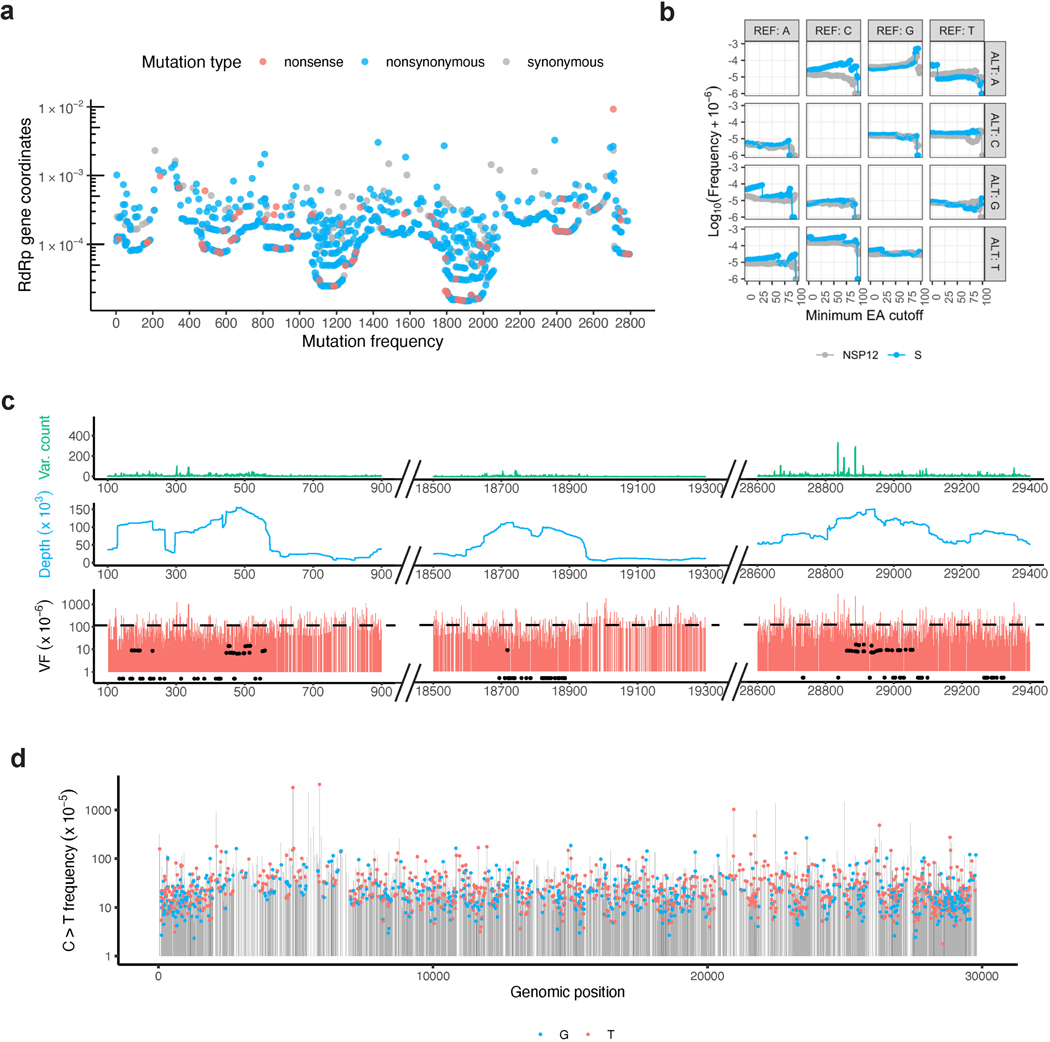
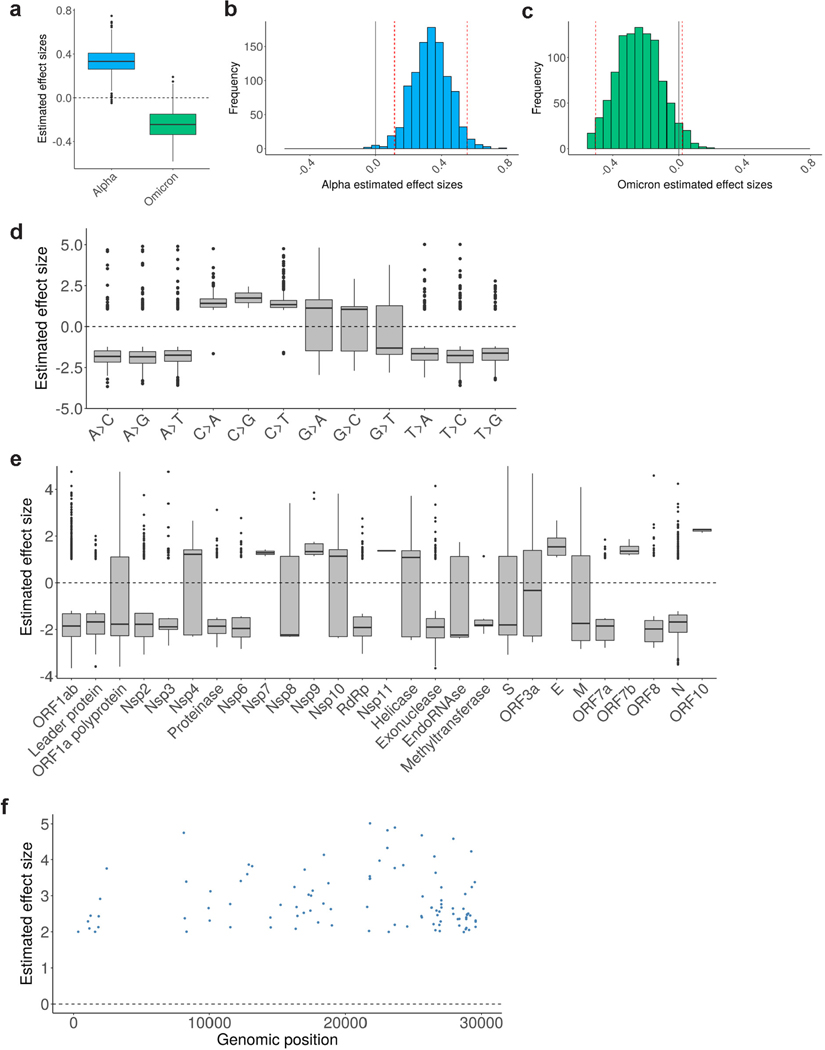
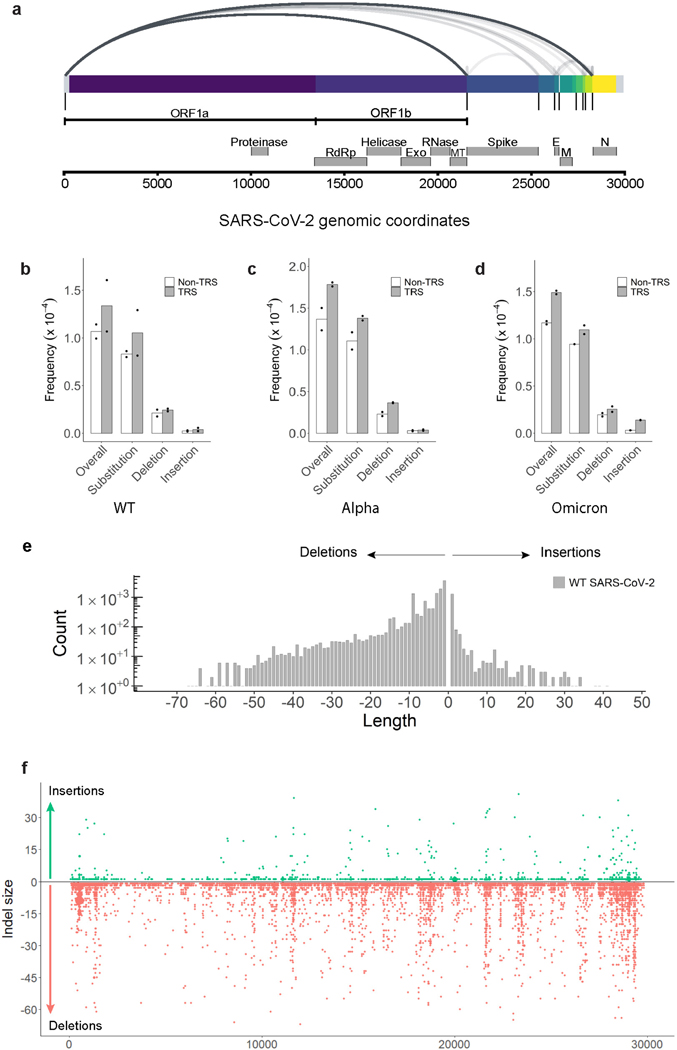
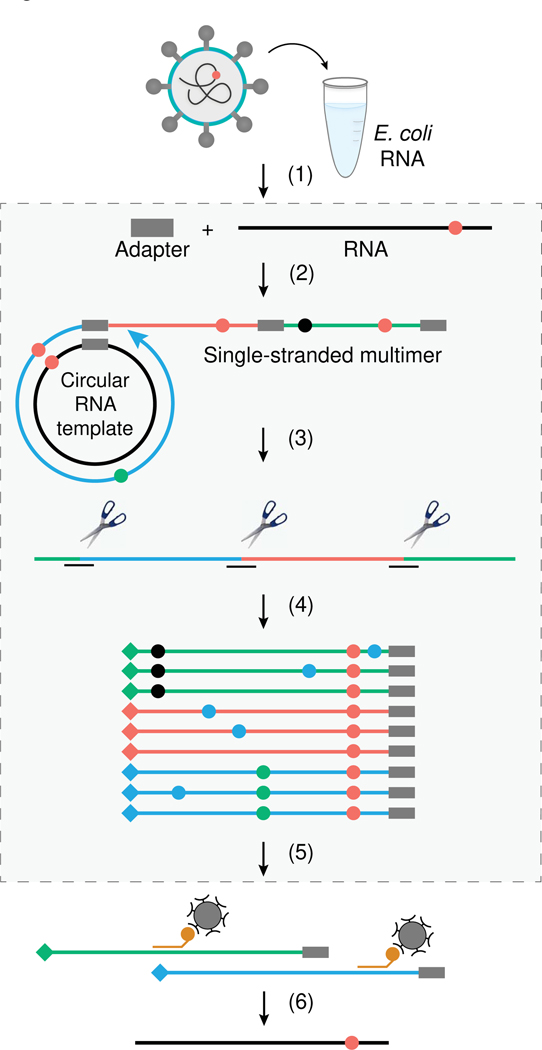
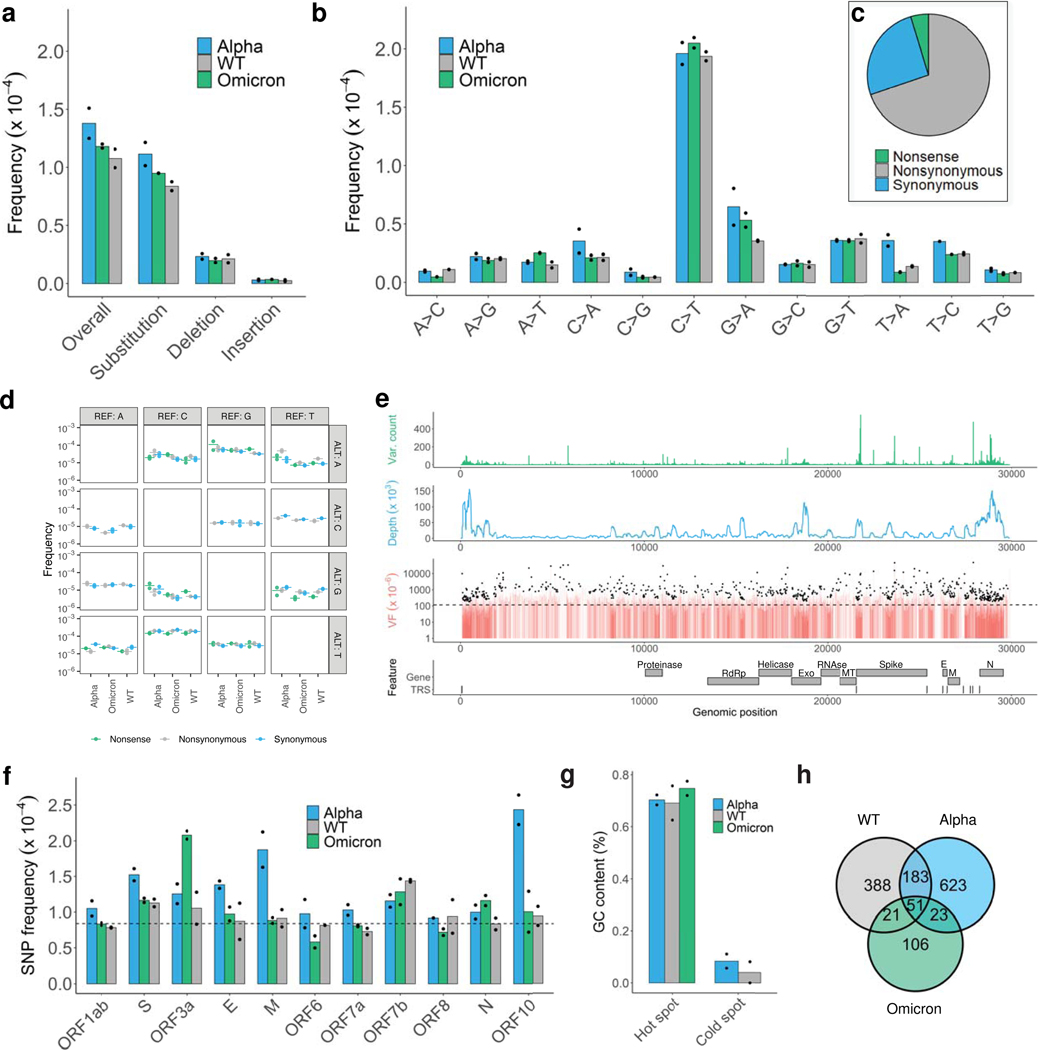
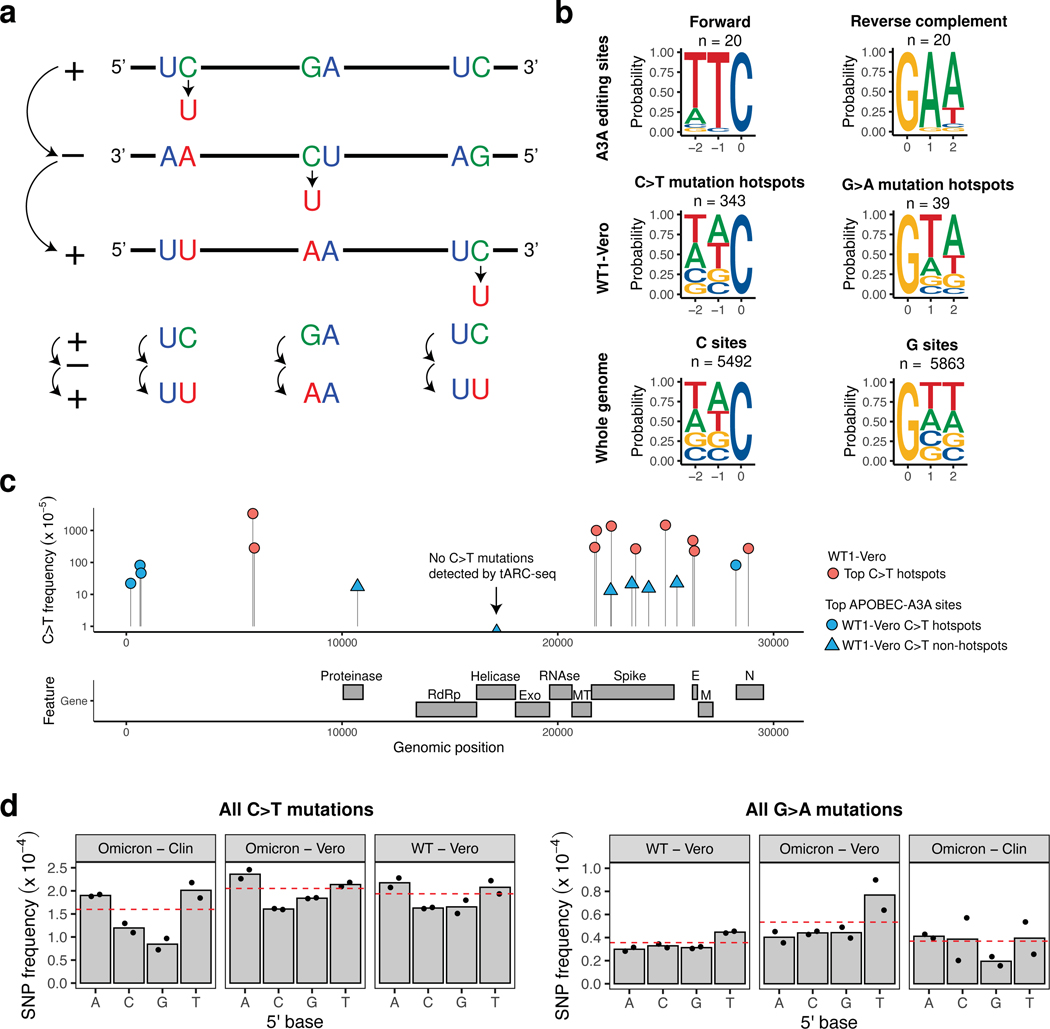
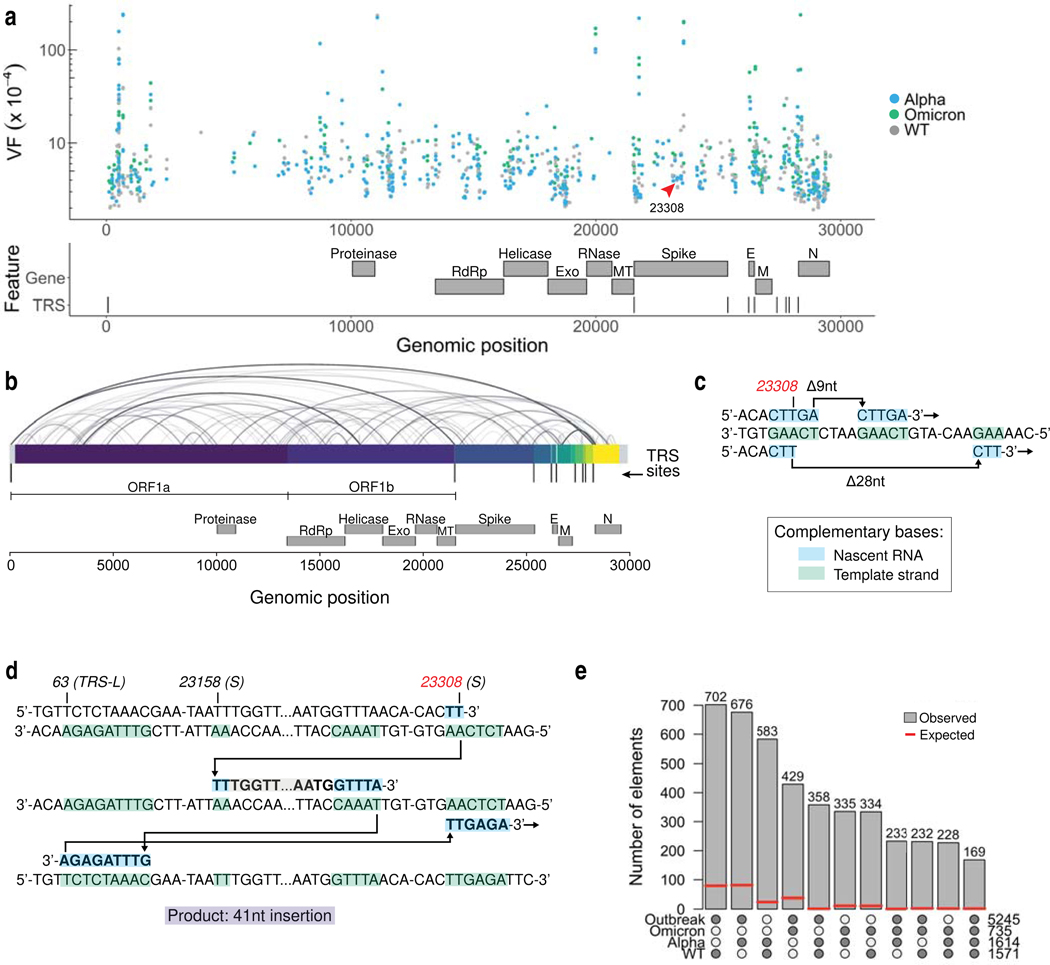
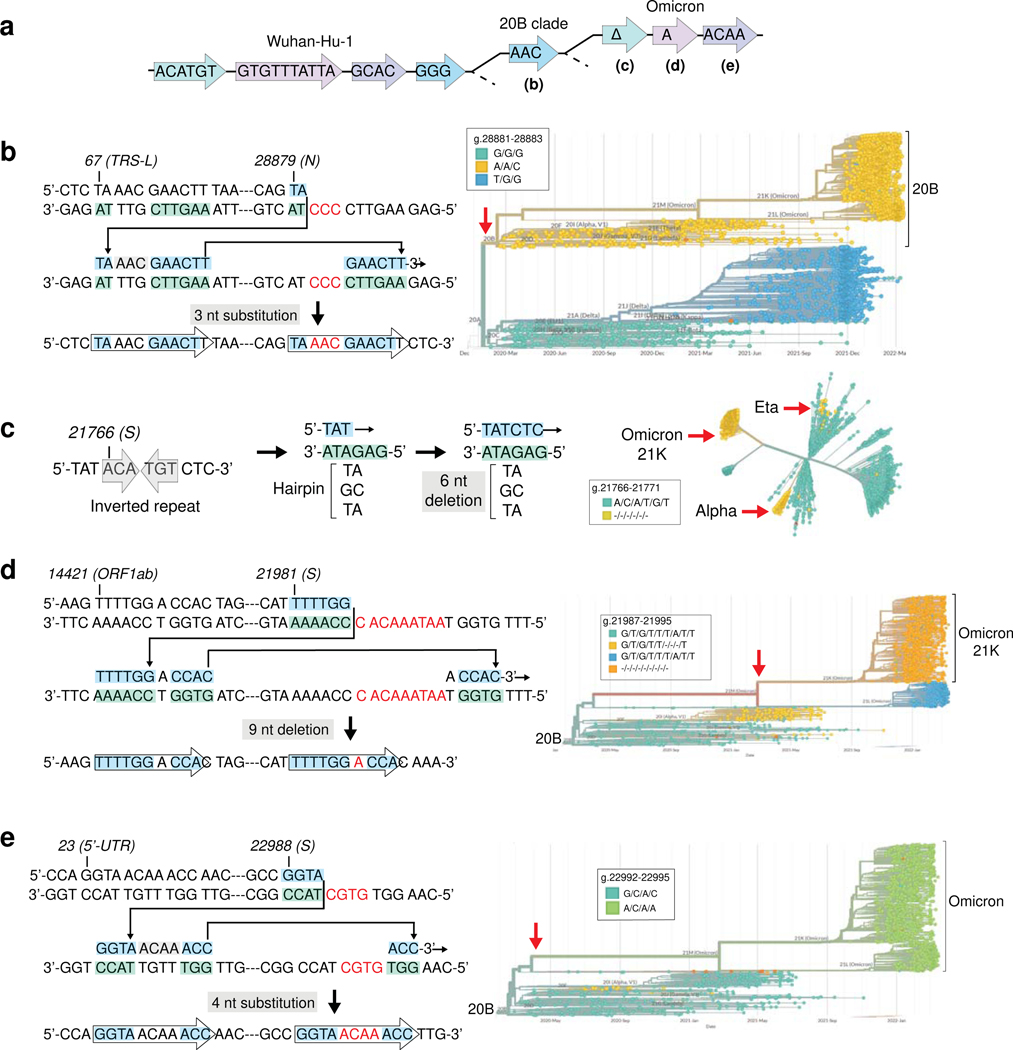
RNA viruses, like SARS-CoV-2, depend on their RNA-dependent RNA polymerases (RdRp) for replication, which is error prone. Monitoring replication errors is crucial for understanding the virus's evolution. Current methods lack the precision to detect rare de novo RNA mutations, particularly in low-input samples such as those from patients. Here we introduce a targeted accurate RNA consensus sequencing method (tARC-seq) to accurately determine the mutation frequency and types in SARS-CoV-2, both in cell culture and clinical samples. Our findings show an average of 2.68 × 10⁻⁵ de novo errors per cycle with a C > T bias that cannot be solely attributed to APOBEC editing. We identified hotspots and cold spots throughout the genome, correlating with high or low GC content, and pinpointed transcription regulatory sites as regions more susceptible to errors. tARC-seq captured template switching events including insertions, deletions and complex mutations. These insights shed light on the genetic diversity generation and evolutionary dynamics of SARS-CoV-2.


Conflict of interest statement

Competing interests The authors declare no competing interests.

Figures

Extended Data Fig. 1 |
Extended Data Fig. 1 |. Replication cycle of SARS-CoV-2 virus.
a, As a positive-strand RNA virus, SARS-CoV-2 encodes an RNAP (blue) that is responsible for both replication and gene expression. After entering the cell, the virus releases its (+) strand RNA into the host cell’s cytoplasm. Using its own polymerase (RdRp), the viral RNA replicates into a (−) strand then back to a (+) strand, producing more viral RNA genomes for new virus particles. RNAP errors (red) generate genetic diversity in SARS-CoV-2 at any step of replication and fuel the evolution of novel strains. b, Definition of the terms used in this study. c, Plaque forming units over time 9 of WT, Alpha, and Omicron SARS-CoV-2 grown in Vero cells (n=3), consistent with previous data52.
Extended Data Fig. 2 |
Extended Data Fig. 2 |. Hybrid capture of specific E. coli mRNAs for tARC-seq validation.
a, Hybrid capture in tARC-seq produces a >30-fold enrichment in post-consensus nucleotides across a panel of twelve E. coli genes (n = 2). PCR duplicates account for most of the pre-consensus nucleotides sequenced, and fold-enrichment drops during consensus calling as duplicates of the same parent RNA fragment are collapsed into a single read. The drop in enrichment between pre- and post-consensus reads is more pronounced for low-expression genes like marR. Fold enrichment was calculated from the cumulative, normalized sequencing depth across each gene in tARC-seq samples versus matched bulk ARC-seq controls. b,c, Each biological replicate represents one WT E. coli sample sequenced two ways to generate paired data. Purified mRNA was either fragmented individually and prepared for ARC-seq (control), or it was used as a carrier for SARS-CoV-2 fragmentation and tARC-seq (carrier). Libraries were sequenced separately and aligned to the E. coli reference for variant calling. Mutation frequencies were comparable between carrier (6.4 × 10⁻⁵) and control (7.5 × 10⁻⁵) samples (b) and reproduced the known variant frequency for WT E. coli (8.2 × 10⁻⁵). The mutation distribution across all base substitution types was also comparable between carrier and control (c). d,e, Comparison of the variant frequencies observed between ARC-seq and tARC-seq over the twelve genes in biological replicate 1 (d) and 2 (e). (n = 2; mean ± SD).
Extended Data Fig. 3 |
Extended Data Fig. 3 |. Empirical validation of tARC-seq data analysis parameters.
In contrast to de novo variants, clonal and subclonal variants are not independent events and should be filtered out during analysis. a, To determine an appropriate cutoff, all variants were graphed by the cumulative base substitution frequency as a function of each variant’s clonality. A cutoff of 0.05 – or ≤5% allele fraction – counted most variants on the curve while excluding clonal outliers. b, The overall variant frequency (left y-axis, grey bars) in WT SARS-CoV-2 is graphed by consensus read depth (right y-axis, purple line) over a series of minimum cDNAcs family sizes (minmem2). Minmem2 is an expression of the minimum number of PCR copies required to form a cDNA consensus sequence during consensus calling. A family size of 1 is equivalent to traditional RNA-seq without error correction, while a family size of 3 reduces the frequency of technical artifacts to <10−9[13].
Extended Data Fig. 4 |
Extended Data Fig. 4 |. De novo mutation frequencies in SARS-CoV-2 vary by feature independent of variant effect.
a, Synonymous (gray), nonsynonymous (blue) and nonsense mutation frequencies (red) from a single biological replicate of WT SARS-CoV-2 are mapped across nsp12, which encodes the viral RdRp. b, Substitution frequency is analyzed by Evolutionary Action (EA) for the S gene and nsp12 (see also: http://cov.lichtargelab.org/). Higher EA scores correspond to residues with greater impact on evolutionary divergences and variants at these positions are predicted to be more deleterious. The lack of relationship between variant frequency and EA score (m ≈ 0) further suggests a limited role for selection in tARC-seq data. c, The variant frequency (VF) is computed by position (VF = count / depth) and graphed along the genome. Positions were filtered for depth ≥5,000X. Fisher’s exact test with Benjamini–Hochberg correction was performed position-wise across the genome to determine cold spots for RNA variants. Cold stop positions with significantly decreased VFs relative to the genome-wide average are indicated with black dots (P < 0.05). One representative sample of WT virus is shown. The broken black line represents the genome-wide average VF. d, RNA variant frequencies by ORF in WT, Alpha and Omicron SARS-CoV-2. e, C>T mutations observed across the WT1-Vero genome were graphed by 5’ base: T (red dot) or G (blue dot). Gray lines indicate every C>T mutation observed.
Extended Data Fig. 5 |
Extended Data Fig. 5 |. Effect of lineage on variant frequency using a Negative binomial regression model.
To handle the high dimensionality of the genome wide data a resampling regression approach was employed to estimate strain and site effects. Negative binomial regression analyses modeling the effects of explanatory variables on variant count were iteratively performed on random subsets of sites. Estimated effect sizes across all regression models in the resampling regression approach are calculated by taking the mean of the predicted effect sizes across all models that include the site. a-c, Strain effects are predicted for the 1000 most significant sites. The distributions of estimated strain effects show that Alpha (P = 0.003) has significantly higher variant frequency compared to WT (b), and Omicron (P = 0.07) has fewer variants than WT (c). Red dashed lines indicate 95% confidence intervals; for Alpha this confidence interval excludes zero indicating significance; for Omicron zero is within the interval but close to the boundary. d,e, Site effects estimated using all genomic positions in the resampling regression analysis demonstrate systematic patterns when grouped by features of the variant. In panel (d) differences are shown in the estimated site effects by mutation type broken down by reference base and alternative allele combinations. In panel (e) differences are shown in site effects across genomic features. f, Estimated site effects with P < 0.05 after adjusting for multiple testing are plotted along the genome.
Extended Data Fig. 6 |
Extended Data Fig. 6 |. Frequency and spectrum of RNA variants in two clinical samples.
Omicron data is graphed by sample source and clade. For both clinical samples, patients were female, age 25–30 years, fully vaccinated and without comorbidities. In both cases, symptoms were reported as “mild/moderate”. (BA.5.6 → 22B clade) (BA.2.12.1 → 22C) (B.1.1.529 → 8 21K) (n = 1, mean ± Wilson score 95% confidence interval). a,b, Genome-wide mutation 9 frequencies (a) and analyzed by base substitution type (b) in the two clinical samples.
Extended Data Fig. 7 |
Extended Data Fig. 7 |. TRS activity fuels RNA variants.
Recombination at transcription regulatory sequences (TRS) drives sgRNA synthesis and is central to SARS-CoV-2 gene expression. a, Canonical junctions associated with sgRNA synthesis are shown (black lines). Chimeric reads are detected by mapping with a spliced aligner (STAR). Each arc represents a chimeric alignment where the left and right x-intercepts correspond to the junction coordinates and line shading reflects frequency. Data is from one biological replicate of WT SARS-CoV-2. b-d, RNA errors are increased at TRS sites and flanking regions compared to genome-wide rates in WT (b), Alpha (c), and Omicron (d) SARS-CoV-2 (n = 2, mean ± SD). Each TRS region (n = 10) is small (<115 nt) and composed of one canonical TRS site plus 100 flanking nucleotides. WT TRS site error bars appear large because of high-frequency outliers. e, Indels are mapped by size (y-axis) and count (dot size) across the SARS-CoV-2 genome for one representative replicate of WT virus. Promiscuous RdRp activity fuels a diverse repertoire of indels detectable by tARC-seq at a single locus, visible as a vertical smear.
Extended Data Fig. 8 |
Extended Data Fig. 8 |. Template switching is a driving mechanism for deletions.
a, To test if template switching is a contributing factor for deletions, we determined the expected number of SIDs by chance. For each deletion event with size ≥ 2bps in the WT1 sample, we assigned it with a random genomic position in SARS-CoV-2 while preserving the deletion size. The occurrence of SIDs and the maximum nucleotides of complementarity was then determined. This process was repeated 1000 times to obtain a null distribution for each complementarity size. The observed SIDs occurrences were indicated as red lines. b, Z-scores, normal distribution P values and empirical P values were determined using the SIDs occurrence in the WT1 sample comparing to the null distribution. A significant P value suggests more than expected SIDs are observed in the viral sample, and slippage is a significant contributing mechanism for deletion events. c, SIDs observed in more than two lineages have significantly lower GC content than ones only shown in no more than one lineage (Two-sided t-test). d, SIDs observed in more than two lineages have significantly longer complementarity size than ones only shown in no more than one lineage (Two-sided t-test).
Extended Data Fig. 9 |
Extended Data Fig. 9 |. RdRp template switching contributes to genomic change during the COVID-19 pandemic.
VOC-specific multiple nucleotide alterations can be modeled as singular RdRp template switching events based on 3’ micro-complementarity that facilitates RdRp misalignments/realignments. a, Phylogenetic tree based on sequence alterations observed in VOC arising from the 20B clade; not drawn to any scale. The different colors indicate VOC-specific nucleotide alterations. b-d, Top panels, proposed template switching events that explain multiple nucleotide alterations in the Lambda (b), Alpha (c), and Gamma (d) lineages. Bottom panels, phylogenetic trees that establish the singular origin (red arrows) of the coordinated multiple nucleotide alterations in each lineage. Phylogenetic trees were constructed in Nextstrain v2.35.0 from genomes sequenced between Dec. 2019 and March 2022.
Fig. 1 |
Fig. 1 |. SARS-CoV-2 library preparation for tARC-seq.
(1) SARS-CoV-2 RNA is added to a carrier and the sample is fragmented. (2) Fragments are ligated to barcoded adapters, circularized and primed for rolling-circle reverse-transcription. (3) The resulting cDNA multimers are restriction digested into monomer copies. (4) Sequencing adapters and additional barcodes [] are added through subsequent PCR steps. (5) SARS-CoV-2 reads are enriched through hybrid capture, followed by post-capture PCR. (6) Final library is sequenced, reads are organized into families by barcode, and collapsed into consensus sequences. This process of error correction removes technical artifacts [] and identifies true RNA variants [] that occur at the same position across duplicates. The non-targeted sister protocol to tARC-seq is outlined in grey (steps 2–4, 6).
Fig. 2 |
Fig. 2 |. RNA variant frequencies and mutational spectra in SARS-CoV-2.
a, RNA variant frequencies were measured in ancestral SARS-CoV-2 (WT), the B.1.1.7 lineage (Alpha) and the B.1.1.529 lineage (Omicron) using tARC-seq (n = 2 biologically independent samples). b, Spectrum of mutation of RNA variants, C>T and G>A transitions are the major events (n = 2 biologically independent samples). c, Most variants create nonsynonymous amino acid substitutions. d, The mutation frequencies are compared for each base substitution type observed in the coding regions (REF, original base; ALT, altered base substitution) (n = 2 biologically independent samples). e, The variant frequency (VF) is computed by position (VF = count / depth) and graphed along the genome. Two-sided Fisher’s exact test with Benjamini–Hochberg correction was performed position-wise across the genome to determine hotspots for RNA variants. Hotspot positions with depth ≥5,000X and significantly increased VFs relative to the genome-wide average are indicated with black dots (P < 0.05). One representative sample of WT virus is shown. The broken black line represents the genome-wide average VF. f, RNA VF vary by ORF. The horizontal dashed line marks the genome-wide average across all replicates (n = 2 biologically independent samples). g, All significant hotspots (e) and cold spots, from Extended Data Fig. 4c, were then analyzed by GC content. Compared to cold spots, hotspots are GC-enriched (n = 2 biologically independent samples). h, Venn diagram showing recurrent hotspots across lineages. Significant sites were combined between replicates before searching for overlaps between lineages.
Fig. 3 |
Fig. 3 |. APOBEC editing does not account for the majority of C>T mutations observed by tARC-seq.
Comparison of tARC-seq C>T, G>A transition hotspots to the APOBEC3A (A3A) editing signature. a, Schematic of A3A editing of + and - strand sequences based on the known preference of A3A for C sites with a 5’U,. The final base edits that are detectable by tARC-seq are shown on the bottom row. Green: edited bases before A3A deamination. Red: edited bases after A3A deamination. Blue: unedited bases. b, Sequence context for SNP hotspots in the WT1-Vero dataset for which C>T or G>A transitions comprise over 50% of the mutations observed versus genome-wide C and G sites. The sequence context known to be recognized by A3A at C sites of SARS-CoV2 and its reverse complement are shown for comparison. c, The top ten highest frequency C>T mutation hotspots versus the top ten known A3A editing sites of WT SARS-CoV2 virus graphed by the frequency observed in the WT1-Vero dataset. d, Breakdown of the frequency of all C>T mutations by 5’ base and all G>A mutations by 3’ base in WT-Vero, Omicron-Vero, and Omicron-Clinical datasets. Bars represent lineage average of two biological samples which are indicated as dots. Dashed red lines indicate the average overall C>T or G>A mutation frequency in each lineage (n = 2 biologically independent samples).
Fig. 4 |
Fig. 4 |. RdRp template switching at sites of sequence complementarity models rare events in SARS-CoV-2.
a, Indel hotspots, corresponding to transcription skip sites, are mapped across the genome for one representative replicate each of WT, Alpha, and Omicron. These loci have significantly elevated frequencies of insertions and deletions as calculated by Fisher exact test (P < 0.05 with Benjamini-Hochberg correction). b, Template switching at TRS (denoted as vertical lines) drives sgRNA synthesis. However, many chimeric junctions observed by tARC-seq lay outside canonical regions indicating non-programmed template switching. Chimeric reads are detected by mapping with a spliced aligner (STAR). Each arc represents a chimeric alignment where the left and right x-intercepts correspond to the junction coordinates and line shading reflects frequency. One representative replicate of WT SARS-CoV-2 is shown. c,d, three events from tARC-seq data are modeled involving g.23308 (Panel a, red arrow): two deletions (c) and one insertion (d). The 41 nt insertions is: TGGTTAAAAACAAATGTGTCAATTTCAACTTCAATGGTTTA. e, The overlap of slippage-induced deletions (SID) between tARC-seq and outbreak data with complementarity size ≥2bp. The expected overlap if SID events are independent is shown in red.
Fig. 5 |
Fig. 5 |. RdRp template switching contributes to genomic change during the COVID-19 pandemic.
Pandemic data shows that many complex mutations in SARS-CoV-2 appeared suddenly (red arrows). They likely did not accumulate gradually but were driven by a single event: RdRp template switching. In the events modeled here, 3’ complementarity facilitates the misalignment and realignment of RdRp, creating complex mutations that have fueled viral evolution. a, Phylogenetic tree based on sequence alterations that define the 20B and Omicron clades; not drawn to any scale. Discrete, coordinated nucleotide alterations are coded by color, and each template switching event is mapped out below (b-e). b, The GGG>AAC mutation in the N gene occurred once early in the pandemic and defines the 20B clade. It creates a tandem amino acid substitution that increases the infectivity, fitness, and virulence of SARS-CoV-2. c, RdRp replication across a small hairpin in S has spawned the same 6-nt deletion on more than three separate occasions in different VOC, while other singular events are specific to Omicron (d-e). Phylogenetic trees were constructed in Nextstrain v2.35.0 from genomes sequenced between Dec. 2019 and March 2022.

Update of

Similar articles

Cited by

References

    1. Snijder EJ, Decroly E. & Ziebuhr J. Chapter Three - The Nonstructural Proteins Directing Coronavirus RNA Synthesis and Processing. in Advances in Virus Research (ed. Ziebuhr J) vol. 96 59–126 (Academic Press, 2016). - PMC - PubMed
    1. Bradley CC, Gordon AJE, Halliday JA & Herman C. Transcription fidelity: New paradigms in epigenetic inheritance, genome instability and disease. DNA Repair (Amst) 81, 102652 (2019). - PMC - PubMed
    1. Drake JW Rates of spontaneous mutation among RNA viruses. Proc Natl Acad Sci U S A 90, 4171–4175 (1993). - PMC - PubMed
    1. Sanjuán R, Nebot MR, Chirico N, Mansky LM & Belshaw R. Viral Mutation Rates. Journal of Virology 84, 9733–9748 (2010). - PMC - PubMed
    1. Acevedo A, Brodsky L. & Andino R. Mutational and fitness landscapes of an RNA virus revealed through population sequencing. Nature 505, 686–690 (2014). - PMC - PubMed

Publication types

Supplementary concepts