. 2024 May;9(5):1256-1270.
doi: 10.1038/s41564-024-01659-0. Epub 2024 Apr 22.

Interferon-induced transmembrane protein-1 competitively blocks Ephrin receptor A2-mediated Epstein-Barr virus entry into epithelial cells

Affiliations

Interferon-induced transmembrane protein-1 competitively blocks Ephrin receptor A2-mediated Epstein-Barr virus entry into epithelial cells

Yinggui Yang et al. Nat Microbiol. 2024 May.

Abstract

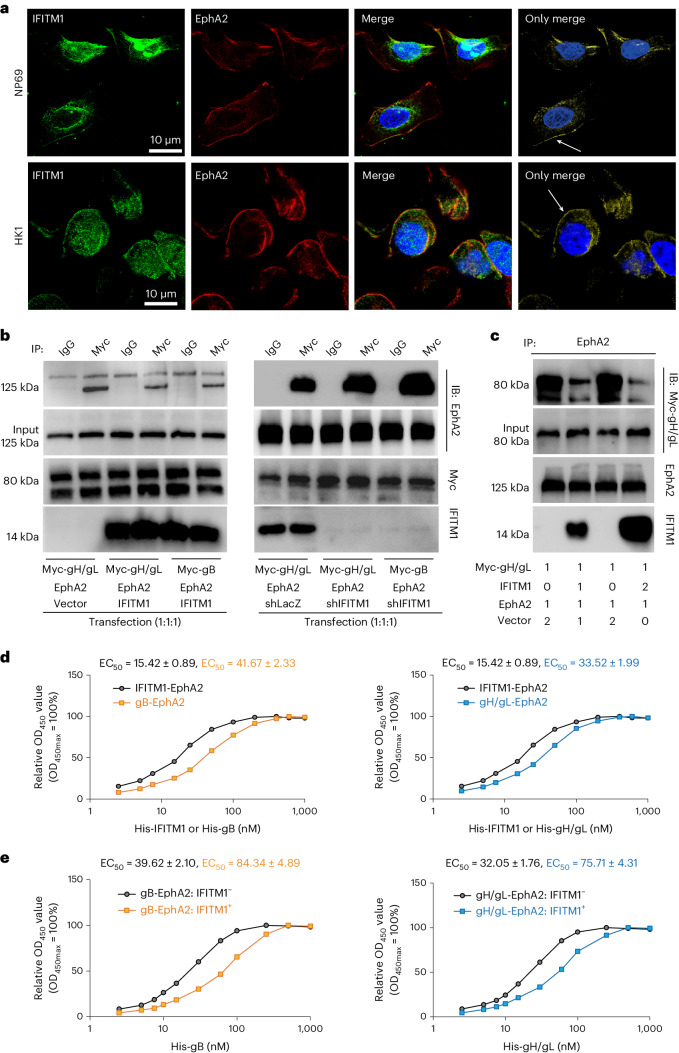
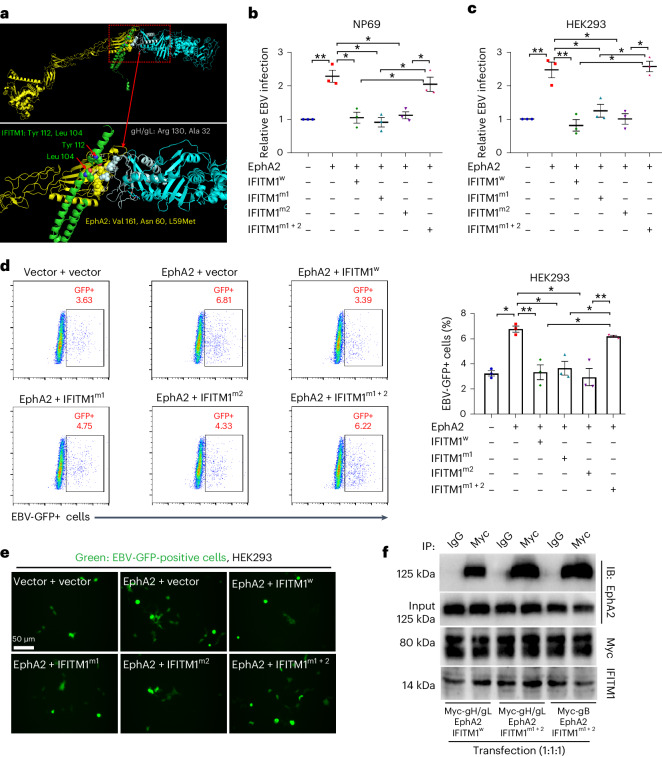
Epstein-Barr virus (EBV) can infect both B cells and epithelial cells (ECs), causing diseases such as mononucleosis and cancer. It enters ECs via Ephrin receptor A2 (EphA2). The function of interferon-induced transmembrane protein-1 (IFITM1) in EBV infection of ECs remains elusive. Here we report that IFITM1 inhibits EphA2-mediated EBV entry into ECs. RNA-sequencing and clinical sample analysis show reduced IFITM1 in EBV-positive ECs and a negative correlation between IFITM1 level and EBV copy number. IFITM1 depletion increases EBV infection and vice versa. Exogenous soluble IFITM1 effectively prevents EBV infection in vitro and in vivo. Furthermore, three-dimensional structure prediction and site-directed mutagenesis demonstrate that IFITM1 interacts with EphA2 via its two specific residues, competitively blocking EphA2 binding to EBV glycoproteins. Finally, YTHDF3, an m6A reader, suppresses IFITM1 via degradation-related DEAD-box protein 5 (DDX5). Thus, this study underscores IFITM1's crucial role in blocking EphA2-mediated EBV entry into ECs, indicating its potential in preventing EBV infection.


Conflict of interest statement

The authors declare no competing interests.

Figures

Fig. 1
Fig. 1. IFITM1 inhibits EBV infection in vitro and in vivo.
a, NP69 cell lines (from Extended Data Fig. 2b,c) were incubated with cell-free EBV-GFP for 3 h, after which EBV copy numbers were measured by TaqMan−qPCR. b,c, Flow cytometric analyses (b) were conducted after 72 h to determine the percentage (c) of EBV-GFP-positive cells. The numbers 1 and 2 represent two different sequences of shIFITM1, which can be referred to as 1-shIFITM1 and 2-shIFITM1, respectively. d, HK1 cell lines (from Extended Data Fig. 3a,b) were incubated with cell-free EBV-GFP for 3 h, followed by EBV copy number detection using TaqMan−qPCR. e,f, After 72 h, flow cytometric analyses (e) were performed to assess the percentage (f) of EBV-GFP-positive cells. The results are presented as mean ± s.e.m. of at least 3 biological replicates. *P < 0.05 (n ≥ 3, a,c,d,f), two-tailed t-test. gj, Analysis of the effects of sIFITM1 in vitro was performed as follows: g, A flow chart showing exposure of HEK293 cells to EBV-GFP for 3 h, with sIFITM1 being added 2 h in advance at different concentrations (0, 1 and 5 ng µl−1). h, EBV copy numbers were measured by TaqMan−qPCR. i,j, At 72 h after EBV exposure, flow cytometric analyses (i) were performed to show the percentage (j) of EBV-GFP-positive cells. Data are presented as mean ± s.e.m., n = 3 independent experiments, *P < 0.05, **P < 0.01, two-tailed t-test (h,j). k, Nude mice were xenografted with HEK293 to form epithelial-cell clusters, followed by injection of sIFITM1 and EBV-GFP at set intervals. A control group was included in which double-distilled H2O was injected at the corresponding intervals. I.H., hypodermic injection. l, Equal amounts of total DNA were obtained from the tumour-like cell clusters to detect the EBV copy numbers by TaqMan−qPCR for the four groups. For each group, n = 8 and ‘−’ indicates no treatment. Results are expressed as mean ± s.e.m. *P < 0.05, two-tailed t-test. Source data
Fig. 2
Fig. 2. IFITM1 competes with EBV gH/gL and gB for binding of EphA2.
a, IF assays showed the co-localization of IFITM1 with EphA2 in NP69 and HK1 cells. IFITM1 was stained by Alexa fluor 488 (green) and EphA2 by Alexa fluor 647 (red). The co-localization of IFITM1 and EphA2 was visualized as a yellow signal (white arrows). b, Co-IP assays showed that IFITM1 influenced the binding of EphA2 to gH/gL or gB. Three combinations of plasmids were designed and three different plasmids were transfected into each group at a ratio of 1:1:1. The reference group was transfected with Myc-gH/gL, EphA2 and an empty vector, while the comparison groups were transfected with gH/gL, EphA2 and IFITM1, or gB, EphA2 and IFITM1 (on the left). Simultaneously, the reference group was also transfected with Myc-gH/gL, EphA2 and shLacZ, while the comparison groups were transfected with gH/gL, EphA2 and shIFITM1, or gB, EphA2 and shIFITM1 (on the right). Cell lysates were immunoprecipitated with anti-Myc antibody, followed by immunoblotting (IB) analysis with anti-EphA2, Myc and IFITM1 antibody. c, Co-IP assays showed that the effect of IFITM1 on binding of EphA2 to gH/gL was dose dependent. After 48 h transfection, cell lysates were collected and then immunoprecipitated with an anti-EphA2 antibody, followed by immunoblotting analysis with anti-Myc, EphA2 and IFITM1 antibodies. The numbers below each band indicate the transfection dosage. d, ELISA showed the affinity constant of the interaction between EphA2 and IFITM1, gH/gL or gB. e, ELISA showed the affinity constant of the interaction between EphA2 and gH/gL or gB with/without IFITM1. All results were obtained from at least 3 biological replicates. Source data
Fig. 3
Fig. 3. IFITM1 impairs EphA2-mediated EBV infection.
a, Three cell lines (from Extended Data Fig. 6) were exposed to EBV-GFP for 3 h, and the remaining extracellular viruses were removed by washing with 1×PBS. The copy numbers of EBV were then measured using TaqMan−qPCR. b,c, After 72 h, flow cytometric analyses were performed to determine the percentage of EBV-GFP positive NP69 cells (b) and HEK293 cells (c). The left image is representative flow cytometric scatterplots, and the right image is the corresponding quantitative analysis of EBV-GFP-positive cells. After 72 h, flow cytometric analyses (left) were performed to determine the percentage (right) of EBV-GFP-positive cells. d, Representative images of cells infected with EBV-GFP were recorded for HEK293 cells. All results are expressed as mean ± s.e.m. from at least 3 biological replicates (n ≥ 3, ac). *P < 0.05, **P < 0.01, NS, not significant; two-tailed t-test. Source data
Fig. 4
Fig. 4. Tyr 112 and Leu 104 on IFITM1 are responsible for the inhibition of EphA2-mediated EBV infection.
a, Three-dimensional structural model of the interactions between IFITM1 (green), EphA2 (yellow), gH (light blue) and gL (grey). A distance between atoms of the distinct protein backbones of less than 6.0 Å was considered to indicate interfacial amino acids, as indicated by the red arrows and as listed in the figure (IFITM1: Tyr 112, Leu 104; EphA2: Val 161, Asn 60, Met L59; gH/gL: Arg 130, Ala 32). be, Effect on the EBV infection efficiency when the predicted interfacial amino acids on IFITM1 (Tyr 112, Leu 104) were mutated. All assays were performed on cells containing the empty lentivirus or EphA2-overexpressed cells (NP69 and HEK293) with a single-site mutation (IFITM1m1 or IFITM1m2) or dual mutations (IFITM1m1+2) of IFITM1, and control cells (IFITM1w). EBV copy numbers were measured by TaqMan−qPCR when cells were incubated with cell-free EBV-GFP for 3 h (b, NP69; c, HEK293). d,e, Quantitative and qualitative analysis of EBV-GFP-positive cells after 72 h of EBV exposure in transformed HEK293 cells. d, Representative flow cytometric scatterplots and the corresponding quantitative analysis of EBV-GFP-positive cells. e, Representative images of cells infected with EBV-GFP. f, Co-IP assays showed that IFITM1 influences the binding of EphA2 to gH/gL or gB. A total of 3 combinations of plasmids were designed and 3 different plasmids were transfected into each group at a ratio of 1:1:1. Briefly, the plasmids were transfected into HEK293 cells for 8 h and the cells were collected at 48 h after transfection. Cell lysates were immunoprecipitated with anti-Myc antibody, followed by immunoblotting analysis with anti-EphA2, Myc and IFITM1 antibodies. All results are expressed as mean ± s.e.m. of 3 biological replicates (n = 3, bd). *P < 0.05, **P < 0.01, two-tailed t-test. Source data
Fig. 5
Fig. 5. The expression and function of IFITM1 were negatively regulated by YTHDF3.
a,b, IFITM1 expression levels were tested by RT−qPCR in cells from Extended Data Fig. 8b (a) and Extended Data Fig. 8c (b). Data are presented as mean ± s.e.m., n = 3 independent experiments, *P < 0.05, two-tailed t-test. c, Western blot showing the relative protein levels of YTHDF3 and IFITM1 in NP69, HK1 and HEK293 cells. The Actin protein was used as a control to indicate equivalent amounts of lysates. Representative of 2 independent experiments. d, Correlation analysis of the relative YTHDF3 and IFITM1 mRNA expression levels in 9 NPC and 9 NP samples. Data are presented as mean ± s.e.m., n = 18, r = −0.79, P = 0.00011, two-tailed t-test (d). e, TaqMan−qPCR showing the effects of YTHDF3 and IFITM1 on EBV infection. Lentiviruses encoding shYTHDF3 or shIFITM1 and their corresponding negative control lentiviruses (shLacZ + shLacZ) were transfected into NP69, HK1 and HEK293 cells. Cells were exposed to EBV-GFP for 3 h, EBV copy numbers were measured by TaqMan−qPCR and results from control groups were taken as 100%. Data are presented as mean ± s.e.m., n = 4 independent experiments, *P < 0.05, two-tailed t-test. Source data
Fig. 6
Fig. 6. YTHDF3 recognizes m6A modification sites and interacts with degradation-related proteins participating in the regulation of IFITM1.
a, Left: YTHDF3 knockdown was performed in NP460, NP460-EBV, HK1 and HK1-EBV cells; representative of 2 independent experiments. Middle: DEGs were identified through RNA-seq. Right: Venn diagram showing the overlap between DEGs and m6A modification sites of 7,104 human genes reported in ref. . Seven DEGs including IFITM1 were screened out. b, Fold enrichment of IFITM1 as determined by RIP−qPCR. c, Left: MeRIP-sequencing, grey region shows m6A enrichment based on the input RNA. m6A motif sequences corresponding to the immunoprecipitated enriched region are indicated by different colours in different cells (NP69, green; HK1, red; HK1-shYTHDF3, magenta; input, grey). The RNA sequence at the bottom is the predicted m6A site binding with YTHDF3. Right: MeRIP−qPCR, fold enrichment of IFITM1 as determined by MeRIP−qPCR. d, Left: silver stain of the eluted protein from tandem affinity purification and mass spectrometry. Lines 1, 2 and 3 show the purified proteins from HK1-TAP, HK1-TAP-YTHDF3WT and HK1-TAP-YTHDF3DM, respectively. Right: Venn diagram of the exogenous YTHDF3-binding proteins (HK1-YTHDF3-Exo-TAP: from purified proteins in HK1-TAP-YTHDF3WT) and endogenous YTHDF3-binding proteins (HK1-YTHDF3-Endo-TAP: from endogenous YTHDF3-IP). The red rectangle serves to differentiate the two bands on the gel more clearly. e, Co-IP assays validated that endogenous YTHDF3 co-immunoprecipitated with DDX5, DDX6 and DDX17. HK1 cell lysates were immunoprecipitated (IP) with YTHDF3 antibody, followed by an immunoblotting (IB) assay with the corresponding DDX antibodies. IgG-IP samples were included as a control. f, Lentiviruses encoding YTHDF3 overexpression or DDX5 knockdown and their corresponding negative control lentiviruses (vector + shLacZ) were transfected into HK1 cells, and immunoblotting assays were performed using anti-YTHDF3, DDX5 and IFITM1. Representative of 3 independent experiments (df). g, IFITM1 remaining, detected by RT−qPCR after treating with transcriptional inhibitor ActD. h, Cells from f were exposed to EBV-GFP for 3 h, EBV copy numbers were measured by TaqMan−qPCR and results from control groups were taken as 100%. Mean ± s.e.m., n = 3 independent experiments, *P < 0.05, **P < 0.01, two-tailed t-test (b,c,g,h). Source data
Extended Data Fig. 1
Extended Data Fig. 1. IFITM1 negatively correlates with EBV infection in ECs.
(a) Heatmap of the mRNA expression levels (FPKM) of IFITMs and the reported epithelial cell receptors in B cells, EBV-negative (EBV.N) cells and EBV-positive (EBV.P) cells, analyzed by RNA sequencing. Data were plotted as the log10 of transformed cells for ease of comparison and visualization. (b) Volcano plot of the differentially expressed genes in the EBV-negative (EBVN) and EBV-positive (EBVP) groups, with upregulated genes shown in red, downregulated genes in green, and no differentially expressed genes in blue. The horizontal-axis represents −log2 (fold-change), and vertical-axis represents −log10 (p-value). n = 2 independent experiments; *p < 0.05, two-tailed t-test. (c) The Western blot analysis of tissue lysates from three NPC and three nasopharynx (NP) samples for IFITM1 protein expression using actin as a loading control, n = 3 pairs. (d) The mRNA level of IFITM1 in nine NPC and nine NP samples was assayed by RT-qPCR, and B2M was used as a reference gene, n = 9 pairs. (e) The EBV copy numbers in nine NPC and nine NP samples were also assayed by TaqMan-qPCR using an EBV detection kit, n = 9 pairs. Data are presented as mean values ± s.e.m., n = 9 pairs, *p < 0.05, **p < 0.01, ***p < 0.001 (d, e), two-tailed t-test. (f) A correlation analysis was performed between the relative IFITM1 mRNA expression and EBV copy numbers in nine NPC samples (horizontal axis: relative IFITM1 mRNA levels; vertical axis: relative EBV copy numbers). The black dot denotes scattered samples. Data are presented as mean values ± s.e.m., n = 9, r = −0.87, p = 0.0021 (f), two-tailed t-test. Source data
Extended Data Fig. 2
Extended Data Fig. 2. Knockdown IFITM1 facilitates EBV infection in ECs.
(a) NP69, HK1, and HEK293 cell lines were collected, and immunoblotting assayed expression of IFITM1 at the protein level. (b-c) Knockdown of IFITM1 in NP69, HK1, and HEK293 cells by infection with lentiviruses encoding shIFITM1 (1-shIFITM1 and 2-shIFITM1). shLacZ-transfected cells were included as a control. (b) Knockdown efficiency of IFITM1 at the mRNA level. Bars show the relative IFITM1 mRNA level detected by RT-qPCR and data are presented relative to B2M (2˗ΔCt). (c) Knockdown efficiency of IFITM1 at the protein level. (d) HEK293 and HK-1 cell lines were incubated with cell-free EBV-GFP for 3 hours, and EBV copy numbers were then measured by TaqMan-qPCR. (e-h) After 72 hours, flow cytometric analyses were performed to show the percentage of EBV-GFP-positive cells. Representative images of cells infected with EBV-GFP were recorded for HEK293 cells (i). Data are presented as mean values ± s.e.m., n ≥ 3 independent experiments, *p < 0.05, **p < 0.01, two-tailed t-test (b, d-h). Source data
Extended Data Fig. 3
Extended Data Fig. 3. Overexpression IFITM1 inhibits EBV infection in ECs.
(a) The efficiency of overexpression of IFITM1 at the mRNA level. Bars show the relative IFITM1 mRNA level detected by RT-qPCR and data are presented relative to B2M (2˗ΔCt) and are expressed as the mean ± s.e.m. (n = 3 independent experiments, ***p < 0.001), two-tailed t-test. (b) Efficiency of overexpression of IFITM1 at the protein level. GAPDH was used as a control to indicate equivalent amounts of lysates. (c) NP69 and HEK293 cell lines were incubated with cell-free EBV-GFP for 3 hours, and the remaining extracellular viruses were removed by washing with 1×PBS. EBV copy numbers were then measured by TaqMan-qPCR. (d-g) After 72 hours, flow cytometric analyses were performed to show the percentage of EBV-GFP-positive cells. Representative images of cells infected with EBV-GFP were recorded for HEK293 cells (h). The results are expressed as the mean ± s.e.m. from at least three biological replicates. *p < 0.05, **p < 0.01 (n ≥ 3, a, b, d, e), two-tailed t-test. OE, overexpression. Source data
Extended Data Fig. 4
Extended Data Fig. 4. sIFITM1 couldn’t inhibit EBV infection in B cells.
(a) SDS–PAGE gel shows the purified 6×His-IFITM1 protein (indicated by the red arrow). (b) Diagram of FCM analysis process. In this study, all FCM analyses were carried out according to Extended Data Fig. 4b. (c) Nude mice were xenografted with HEK293 to form tumor-like cell clusters followed by injection of sIFITM1 and EBV-GFP at set intervals. A control was included in which ddH2O was injected at the same interval. After treatment, equal amounts of blood were obtained from Nude mice to detect IFNβ and IFNγ by ELISA. Five mice were investigated for each group (n = 5, ns: no significant difference). Data are presented as mean values ± s.e.m., *p < 0.05, **p < 0.01 (d: n = 8, e: n = 5). Source data
Extended Data Fig. 5
Extended Data Fig. 5. STRING interactome analysis of IFITM1 and proteins involved in EBV infection.
(a) EphA2, NRP1, MYH9, and ITGAV are EBV infection receptors in epithelial cells (dark blue). EGF and EGFR are also involved in EBV infection in epithelial cells (light blue). CR2, CD81, CD9, TLR2, and CIITA are B cell-related receptors (pink). IFITM1(green) and EphA2 are indicated by the red arrow. (b) Co-IP assays showed that endogenous IFITM1 co-immunoprecipitated with EphA2. NP69 and HK1 cell lysates were immunoprecipitated (IP) with IFITM1 antibody, followed by an immunoblotting (IB) assay with EphA2 antibody. IgG-IP samples were included as a control. (c) Recombinant His-IFITM1 protein expression detected by Coomassie Brilliant Blue staining. Lane 2: without IPTG induction, lane 3: IPTG induction, lane 1 purified fusion protein. (d) Recombinant GST-EphA2 protein expression detected by Coomassie Brilliant Blue staining. Lane 4: without IPTG induction, lane 3: IPTG induction, lane 2 purified fusion protein. (e) Recombinant His-gB, and His-gH/gL protein expression detected by Coomassie Brilliant Blue staining. Lane 1 and 7: without IPTG induction, lane 2 and 6: IPTG induction, lane 3 and 5 purified fusion protein. Representative of two independent experiments (b-e). Source data
Extended Data Fig. 6
Extended Data Fig. 6. Overexpression of IFITM1 or/and EphA2 in NP69, HK1, and HEK293 cells.
(a–c) Lentiviruses encoding IFITM1 or EphA2 (referred to by ‘+’) and their corresponding unloaded lentiviruses (referred to by ‘−’) were transfected into NP69, HK1, and HEK293 cells. (a,b) Total RNA was obtained and RT-qPCR was performed to detect the relative mRNA levels of IFITM1 (a) and EphA2 (b). Data are presented relative to B2M (2˗ΔCt). All results are expressed as the mean ± s.e.m. from at least three biological replicates (n ≥ 3, a, b), two-tailed t-test. *p < 0.05, **p < 0.01, ***p < 0.001. (c) The corresponding IFITM1 protein levels in cells from (a) and (b). GAPDH was used as a control to indicate equivalent amounts of lysates. The results are from at least three biological replicates. Source data
Extended Data Fig. 7
Extended Data Fig. 7. Site-directed mutation of 112Tyr and 104Leu on IFITM1.
(a) Schematic representation of the domain structure of EBV gH/gL; CT: C-terminal cytoplasmic tail domain, SP: signal peptide. (b) Cartoon representation of the structure of the EBV gH/gL-ligand-binding domain (LBD). EBV gH is indicated in green, gL is indicated in yellow, and the LBD of EphA2 is indicated in orange. (c) EphA2-overexpressing cells (NP69; HEK293) were transfected with plasmids corresponding to wild-type IFITM1 (IFITM1w), 112Tyr single-site mutation (IFITM1m1), 104Leu single-site mutation (IFITM1m2), or dual mutations (IFITM1m1+2). Experiments were implemented 72 hours after transfection. The cell lysates were harvested to test the IFITM1 level. GAPDH was used as a control to indicate equivalent amounts of lysates. The results are from at least three biological replicates. Source data
Extended Data Fig. 8
Extended Data Fig. 8. IFITM1 expression is negatively regulated by YTHDF3.
(a) RT-qPCR shows the relative IFITM1 mRNA levels in siYTHDF1, siYTHDF2, and siYTHDF3 HEK293 cells. (b) Relative YTHDF3 mRNA levels in NP69, HK1, and HEK293 cells was checked by RT-qPCR after infecting with lentiviruses encoding shYTHDF3 or shLacZ. (c) Relative YTHDF3 mRNA levels in NP69, HK1, and HEK293 cells was checked by RT-qPCR after infecting with the control (Vector) or YTHDF3-overexpressing (YTHDF3 OE) lentiviruses. Data are presented relative to B2M (2˗ΔCt). Mean ± s.e.m., n ≥ 3 independent experiments, *p < 0.05, **p < 0.01, ***p < 0.001, two-tailed t-test (a-c). (d) RT-qPCR of YTHDF3 mRNA expression in nine nasopharyngeal carcinoma (NPC) and nine nasopharyngeal (NP) samples. Total RNA from each tissue was assayed by RT-qPCR and B2M was used as a reference gene. Data are presented as mean values ± s.e.m., n = 18, two-tailed t-test. (e) Correlation analysis of the relative YTHDF3 mRNA expression level and the EBV copy number (horizontal axis: YTHDF3 relative mRNA level; vertical axis: relative EBV copy number). Data are presented as mean values ± s.e.m., n = 8, r = –0.78, p = 0.021 (e). Source data
Extended Data Fig. 9
Extended Data Fig. 9. IFITM1 expression is negatively regulated by YTHDF3 via RNA degradation.
(a) Fold enrichment of IFITM1 was analyzed by RIP-seq in shLacZ or shYTHDF3-HK1 cells. (b) Fold enrichment of IFITM1 was determined by MeRIP-qPCR in shLacZ or shYTHDF3-HEK293 cells and data was presented relative to B2M (2˗ΔCt). (c) KEGG pathway analysis of the 598 proteins from Fig. 6d. Proteins in the DDX family related to RNA degradation were detected. (d) Lentiviruses encoding shYTHDF3 or shDDX5 and their corresponding negative control lentiviruses (shLacZ + shLacZ) were transfected into HK1 cells, and immunoblotting assay were performed with anti-YTHDF3, DDX5, and IFITM1. (e) Cells from Extended Data Fig. 9d were treated with transcriptional inhibitor ActD, followed by IFITM1 detection using RT-qPCR. (f) Cells from Extended Data Fig. 9d were exposed to EBV-GFP for 3 hours and the remaining extracellular viruses were removed by washing with 1×PBS. EBV copy numbers were then measured by TaqMan-qPCR and results from control groups were taken as 100%. Data are presented as mean values ± s.e.m., n = 3 independent experiments, *p < 0.05, **p < 0.01, two-tailed t-test (a, b, e, f). Source data
Extended Data Fig. 10
Extended Data Fig. 10. IFITM1 does not affect Epstein-Barr virus infection in B cells.
(a) Knockdown of IFITM1 in B cells by infection with lentiviruses encoding shIFITM1 (1-shIFITM1 and 2-shIFITM1), then cells were incubated with cell-free EBV-GFP for 3 hours and remaining extracellular viruses were removed by washing with 1×PBS. EBV copy numbers were then measured by TaqMan-qPCR. (b) B cells were infection with lentiviruses encoding wild-type IFITM1 (IFITM1w), or dual mutations (IFITM1m1+2), then cells were incubated with cell-free EBV-GFP for 3 hours and remaining extracellular viruses were removed by washing with 1×PBS. EBV copy numbers were then measured by TaqMan-qPCR. (c) Analysis of the anti-EBV effects of sIFITM1 on B cells, exposure of B cells to EBV-GFP for 3 hours, with sIFITM1 being added 2 hours in advance at different concentrations (0, 1, and 5 ng/µL), EBV copy numbers were then measured by TaqMan-qPCR. Data are presented as mean values ± s.e.m., n = 4 independent experiments, *p < 0.05, **p < 0.01 (a-c). (d) According to the method in Fig. 1k and l, anti-EBV effects of sIFITM1 was tested on B cells in vivo. (e) A schematic diagram showing two models of EBV infection: an insusceptibility model (left), in which IFITM1 inhibits EBV entry by competing with EBV gH/gL and gB for binding to EphA2; and a susceptibility model (right), in which YTHDF3 recognizes m6A modification sites on IFITM1 and interacts with RNA degradation-related proteins DDX5, then leads to the degradation of IFITM1. The loss of IFITM1 would result in exposure of EphA2, which may aid EBV entry. Source data

References

    1. Djaoud Z, et al. Two alternate strategies for innate immunity to Epstein-Barr virus: one using NK cells and the other NK cells and γδ T cells. J. Exp. Med. 2017;214:1827–1841. doi: 10.1084/jem.20161017. - DOI - PMC - PubMed
    1. Young LS, Yap LF, Murray PG. Epstein–Barr virus: more than 50 years old and still providing surprises. Nat. Rev. Cancer. 2016;16:789–802. doi: 10.1038/nrc.2016.92. - DOI - PubMed
    1. Dawson CW, Port RJ, Young LS. The role of the EBV-encoded latent membrane proteins LMP1 and LMP2 in the pathogenesis of nasopharyngeal carcinoma (NPC) Semin. Cancer Biol. 2012;22:144–153. doi: 10.1016/j.semcancer.2012.01.004. - DOI - PubMed
    1. Cancer Genome Atlas Research Network. Comprehensive molecular characterization of gastric adenocarcinoma. Nature513, 202–209 (2014). - PMC - PubMed
    1. Murray PG, Young LS. An etiological role for the Epstein-Barr virus in the pathogenesis of classical Hodgkin lymphoma. Blood. 2019;134:591–596. doi: 10.1182/blood.2019000568. - DOI - PubMed

Publication types

MeSH terms