. 2024 Apr 22;14(1):9231.
doi: 10.1038/s41598-024-60012-x.

Mitochondrial enzyme FAHD1 reduces ROS in osteosarcoma

Affiliations

Mitochondrial enzyme FAHD1 reduces ROS in osteosarcoma

Anne Heberle et al. Sci Rep. .

Abstract

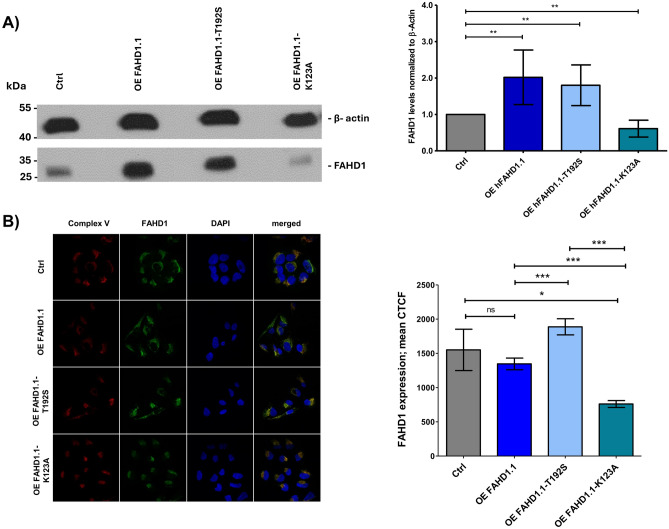
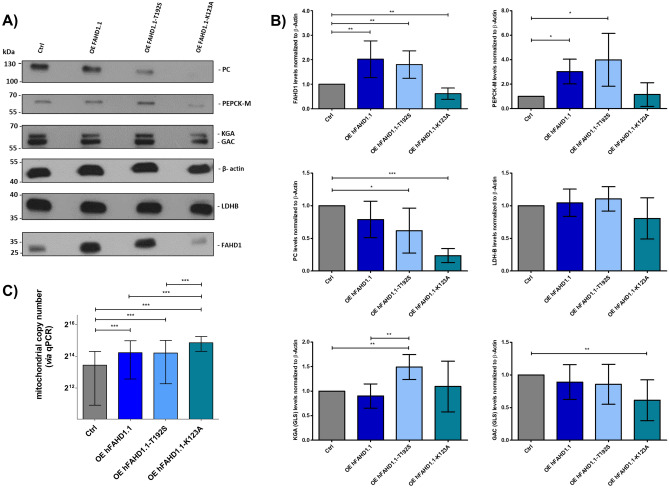
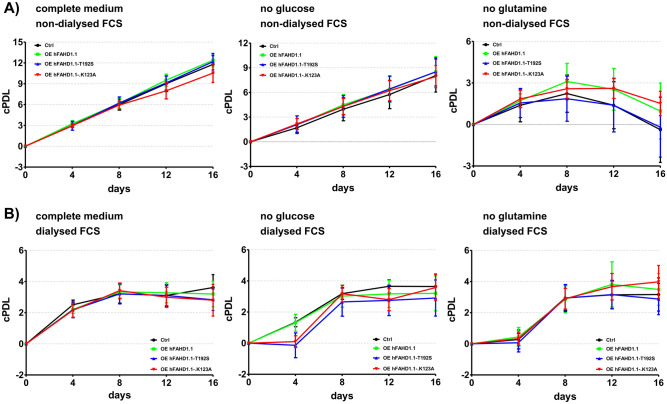
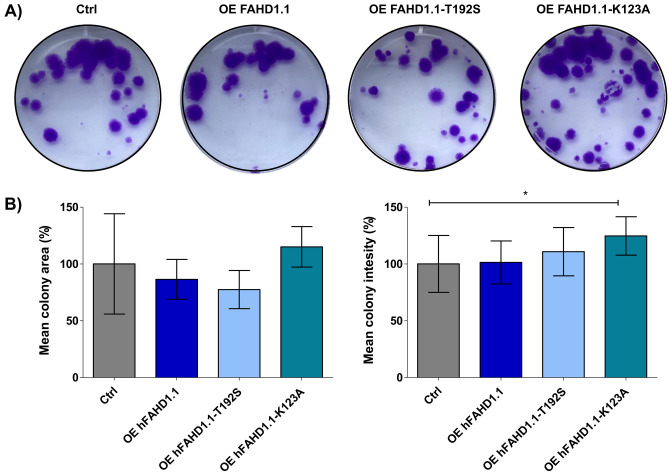
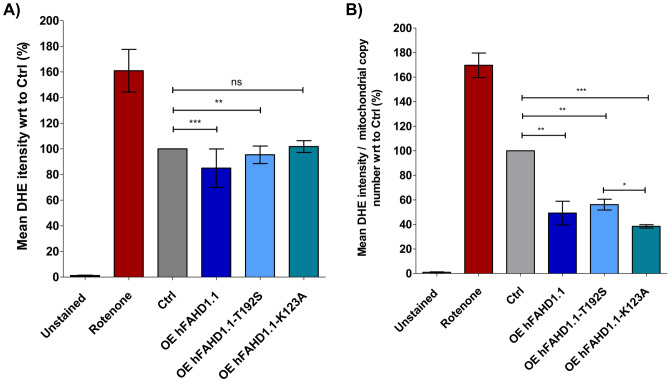
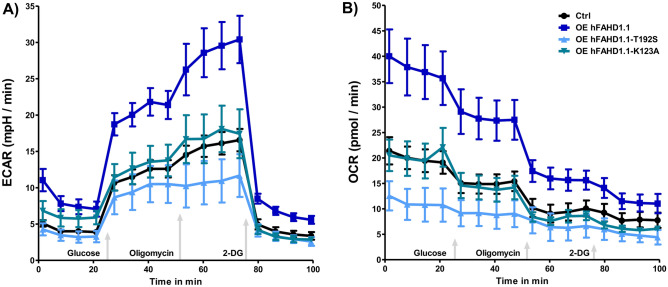
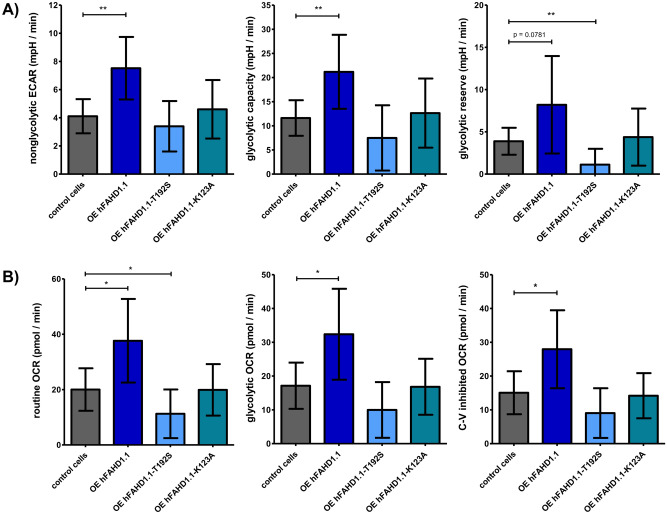
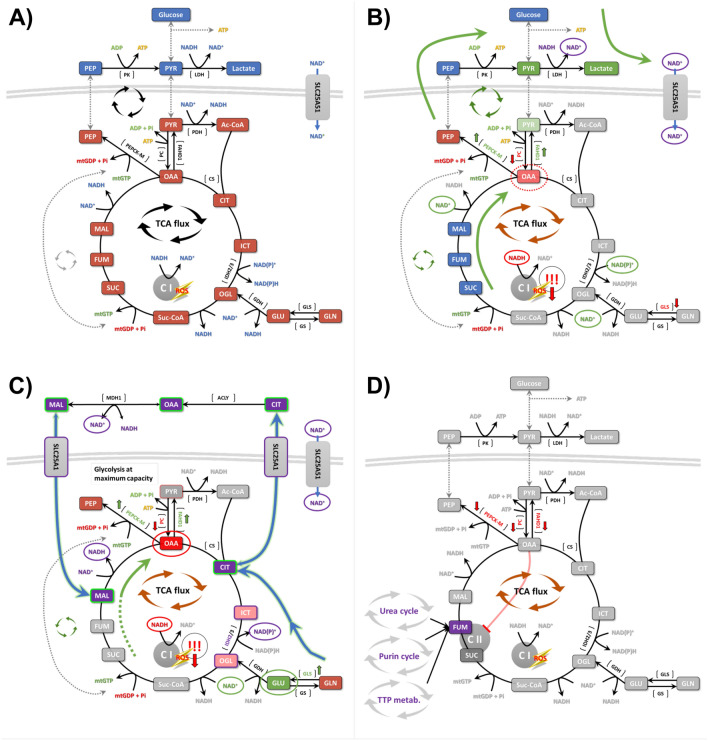
This study investigated the impact of overexpressing the mitochondrial enzyme Fumarylacetoacetate hydrolase domain-containing protein 1 (FAHD1) in human osteosarcoma epithelial cells (U2OS) in vitro. While the downregulation or knockdown of FAHD1 has been extensively researched in various cell types, this study aimed to pioneer the exploration of how increased catalytic activity of human FAHD1 isoform 1 (hFAHD1.1) affects human cell metabolism. Our hypothesis posited that elevation in FAHD1 activity would lead to depletion of mitochondrial oxaloacetate levels. This depletion could potentially result in a decrease in the flux of the tricarboxylic acid (TCA) cycle, thereby accompanied by reduced ROS production. In addition to hFAHD1.1 overexpression, stable U2OS cell lines were established overexpressing a catalytically enhanced variant (T192S) and a loss-of-function variant (K123A) of hFAHD1. It is noteworthy that homologs of the T192S variant are present in animals exhibiting increased resistance to oxidative stress and cancer. Our findings demonstrate that heightened activity of the mitochondrial enzyme FAHD1 decreases cellular ROS levels in U2OS cells. However, these results also prompt a series of intriguing questions regarding the potential role of FAHD1 in mitochondrial metabolism and cellular development.


Conflict of interest statement

The authors declare no competing interests.

Figures

Figure 1
Figure 1
Overexpression of hFAHD1.1 in U2OS. (A) Left: An exemplary Western blot analysis was conducted to detect β-actin and hFAHD1 in four U2OS cell lines. It was observed that all FAHD1 bands ran at the same molecular weight, and any apparent shift detected was attributed to gel drift. Right: Quantification of hFAHD1 protein regulation. Protein levels were analyzed using ImageJ, quantifying hFAHD1 levels relative to β-actin. Data were normalized to control cells and represent four biological replicates. Error bars in the graph represent the standard error of the mean (SEM). (B) Left: Immunofluorescence staining of three cell lines overexpressing hFAHD1 compared to the control. Right: The corrected total cell fluorescence (CTCF) of hFAHD1 for each cell line was quantified using ImageJ software. The data presented include n = 3 biological replicates, with a minimum of 300 cells analyzed per replicate. Error bars in the graph represent the standard error of the mean (SEM).
Figure 2
Figure 2
Western blot analysis of protein regulation. (A) Exemplary Western blot data is presented. It's important to note that all PC and FAHD1 bands run at the same molecular weight. Any apparent shift observed in the figure is attributed to gel drift. (B) Protein regulation was quantified relative to β-actin expression in the same sample and normalized to control cell data. The results are derived from three biological replicates and are presented as mean values ± SEM. (C) Mitochondrial copy numbers of cell lines were obtained via qPCR, calculated using ΔCt based on the nuclear marker B2M and the mitochondrial markers ND4 and COX1. Error bars represent the standard error of the mean (SEM) from four biological replicates, each consisting of three technical replicates.
Figure 3
Figure 3
Proliferation of U2OS cell lines in defined media conditions. (A) Cumulative population doubling levels (cPDL) of the three U2OS cell lines overexpressing hFAHD1 were compared to control cells under both complete medium conditions and glucose/glutamine deprived conditions. Cells were cultured in 6-well plates with three technical replicates, and counting was performed every 4 days using a Bio-Rad TC20 automated cell counter. Error bars indicate the standard deviation (SD). (B) The same series of experiments as depicted in (A) were conducted using dialyzed FCS in all media. The absence of glucose and glutamine from FCS resulted in an altered response in U2OS cells, as they rely on these nutrients for optimal growth conditions. Under these conditions, cell growth was generally comparable to the no glutamine conditions observed with non-dialyzed FCS (A).
Figure 4
Figure 4
Colony forming assay with U2OS cell lines. (A) Cells were seeded in triplicates (100 cells/well in 6-well plates), cultured for 15 days, and subsequently stained with crystal violet. Representative images exhibit one selected well out of three biological replicates that most accurately depict the results. (B) The mean area and mean colony intensity covered by colonies are expressed as percentages. Mean colony intensity correlates with the number of cells in colonies. Error bars represent the standard error of the mean (SEM) of three biological replicates, with each replicate performed in three technical replicates. Each well was individually analyzed using the ImageJ software with the ColonyArea plugin.
Figure 5
Figure 5
Total cellular ROS accumulation in U2OS cell lines. (A) ROS regulation was evaluated by measuring the intensity of 20 µM dihydroethidium (DHE) using flow cytometry. Each data point represents four biological replicates with three technical replicates each, with 3 × 105 cells per tube. In each experiment, a positive control (500 nM rotenone) and an unstained negative control were included. The data were normalized to control cells, and error bars represent the standard error of the mean (SEM). Mean DHE intensity was analyzed using FlowJo software. (B) The data from panel (A) were normalized to mitochondrial content, as determined via quantitative PCR (qPCR).
Figure 6
Figure 6
Glycolytic rates in U2OS cell lines. Glycolytic stress test experiments were conducted using a Seahorse XF HS mini with 104 cells/well, seeded one day prior to the experiment. Glucose administration allowed for the assessment of glycolytic function, further potentiated by the inhibition of Complex V using oligomycin (OMY). Subsequently, glycolysis was completely halted by the addition of 2-deoxyglucose (2-DG). Data were normalized to control cells through the evaluation of total protein, determined via Bradford assay after each experiment. Error bars represent the combined standard error of the mean (SEM) from both analyses. (A) Extracellular acidification rate (ECAR) (B) Oxygen consumption rate (OCR).
Figure 7
Figure 7
Measurement of glycolytic parameters in U2OS cell lines. Quantification of (A) ECAR and (B) OCR data obtained by Seahorse Glycolytic stress test was conducted following the Agilent glycolytic stress test Standard Operating Procedure (SOP), with error bars indicating standard deviation (SD) (n = 3).
Figure 8
Figure 8
A model of how FAHD1 activity may modulate U2OS metabolism. (A) In U2OS cells, the tricarboxylic acid cycle operates independently, relying on both glycolysis and glutaminolysis to sustain the tricarboxylic acid flux. The PEP-PYR-OAA node remains stable, ensuring a consistent supply of mtGDP for the synthesis of succinate (SUC). (B) Overexpression of hFAHD1.1 in U2OS cells enhances glycolysis, leading to a reduction in oxaloacetate levels. This reduction impairs the citrate synthase (CS) reaction, consequently diminishing tricarboxylic acid flux and lowering complex I activity and ROS levels. To compensate for oxaloacetate depletion, the PEP-PYR-OAA node is upregulated, generating mtGDP and SUC. With decreased tricarboxylic acid cycle flux, NAD+ cannot be produced via complex I, prompting cytosolic lactate production to regenerate NAD+. This is facilitated by increased glycolysis. (C) Surprisingly, overexpression of hFAHD1.1-T192S in U2OS cells does not enhance glycolysis but shifts metabolism towards glutaminolysis. Similarly to hFAHD1.1 overexpression, oxaloacetate levels are reduced, impairing CS reaction and lowering tricarboxylic acid flux and complex I activity. As oxaloacetate levels may be drastically reduced, the PEP-PYR-OAA node may not sufficiently compensate. Consequently, the tricarboxylic acid cycle may be maintained through glutaminolysis. NADP+ may be generated via reductive isocitrate dehydrogenase 2 (IDH2) activity, or NAD+ via the nicotinamide (NAM) salvage pathway. Oxaloacetate may also be replenished through a non-canonical tricarboxylic acid cycle, involving citrate export into the cytosol (via SLC25A1), reduction, and subsequent import of malate and NAD+ into mitochondria. Malate can then be converted to oxaloacetate, providing fuel for complex I. (D) Overexpression of hFAHD1.1-K123A in U2OS cells appears to bypass glycolysis, downregulating PC, FAHD1, and PEPCK-M. This likely indicates a catalytic knockdown of FAHD1 via overexpression of a loss-of-function variant. Although the underlying mechanisms require further elucidation, it seems that glycolysis and the PEP-PYR-OAA node may be completely shut down, with cells relying solely on glutaminolysis. Despite similarities to the wild-type setup (A), this metabolic rerouting is weaker. Consequently, these cells exhibit increased mitochondrial content to compensate but otherwise behave similarly to wild-type cells in most experiments, including nearly unchanged ROS levels. Regulation of fumarate (FUM) levels may occur through adjacent pathways to compensate for the lack of biosynthesis.

Similar articles

Cited by

References

    1. Sun W, Wang B, Qu X-L, Zheng B-Q, Huang W-D, Sun Z-W, et al. Metabolism of reactive oxygen species in osteosarcoma and potential treatment applications. Cells. 2019;9:87. doi: 10.3390/cells9010087. - DOI - PMC - PubMed
    1. Kirtonia A, Sethi G, Garg M. The multifaceted role of reactive oxygen species in tumorigenesis. Cell. Mol. Life Sci. . 2020;77:4459–4483. doi: 10.1007/s00018-020-03536-5. - DOI - PMC - PubMed
    1. Oka N, Komuro A, Amano H, Dash S, Honda M, Ota K, et al. Ascorbate sensitizes human osteosarcoma cells to the cytostatic effects of cisplatin. Pharmacol. Res. Perspect. 2020;8:e00632. doi: 10.1002/prp2.632. - DOI - PMC - PubMed
    1. Satheesh NJ, Samuel SM, Büsselberg D. Combination therapy with vitamin C could eradicate cancer stem cells. Biomolecules. 2020;10:79. doi: 10.3390/biom10010079. - DOI - PMC - PubMed
    1. Jaquet V, Scapozza L, Clark RA, Krause K-H, Lambeth JD. Small-molecule NOX inhibitors: ROS-generating NADPH oxidases as therapeutic targets. Antioxid. Redox Signal. 2009;11:2535–2552. doi: 10.1089/ars.2009.2585. - DOI - PubMed

Publication types