. 2024 May;629(8010):154-164.
doi: 10.1038/s41586-024-07348-6. Epub 2024 Apr 22.

Multimodal cell atlas of the ageing human skeletal muscle

Affiliations

Multimodal cell atlas of the ageing human skeletal muscle

Yiwei Lai et al. Nature. 2024 May.

Abstract

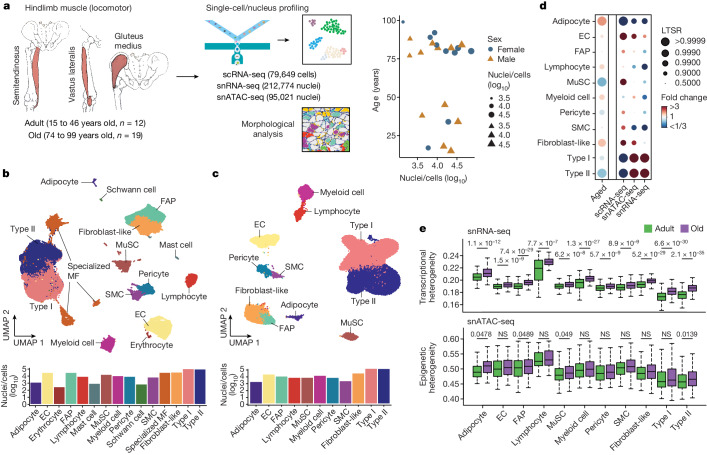
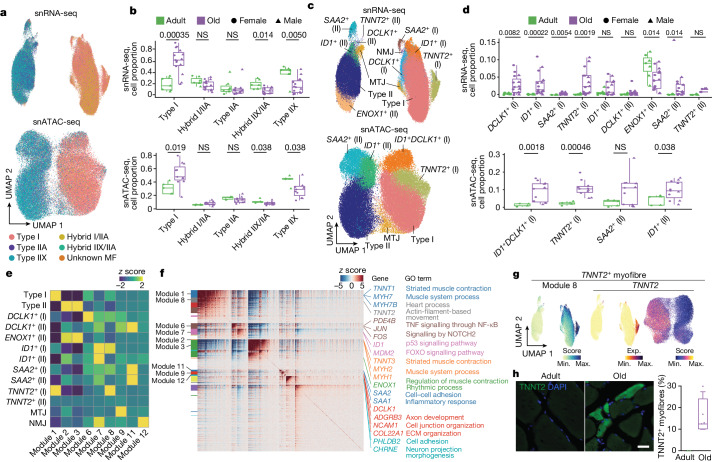
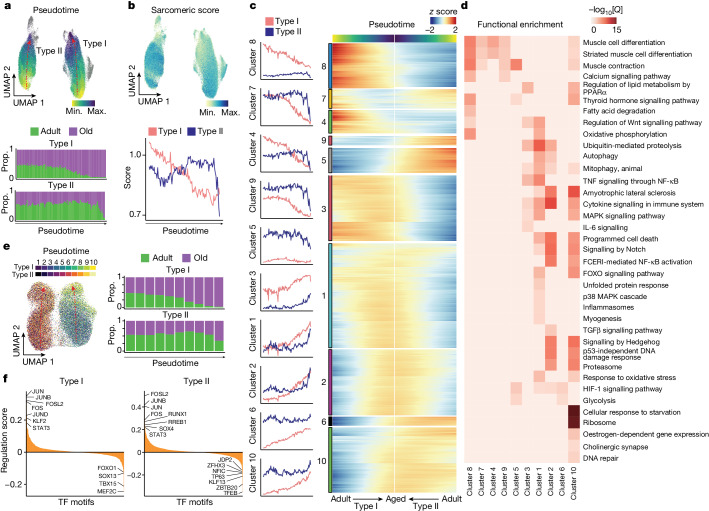
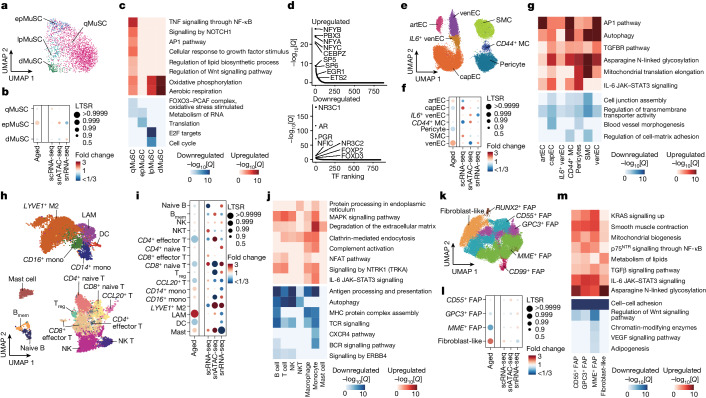
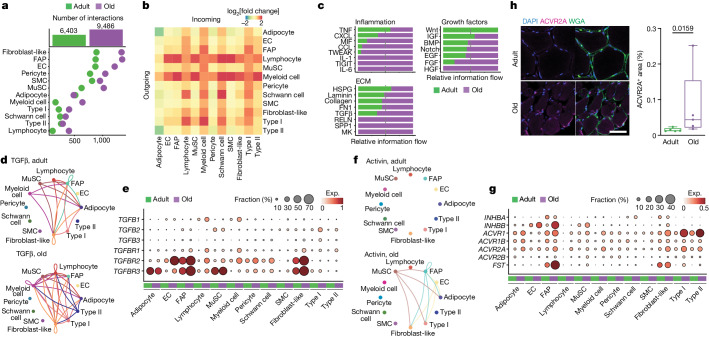
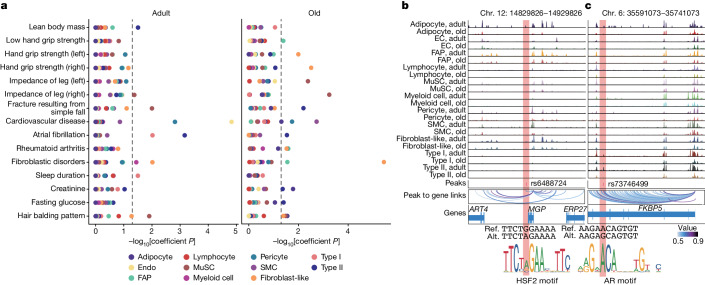
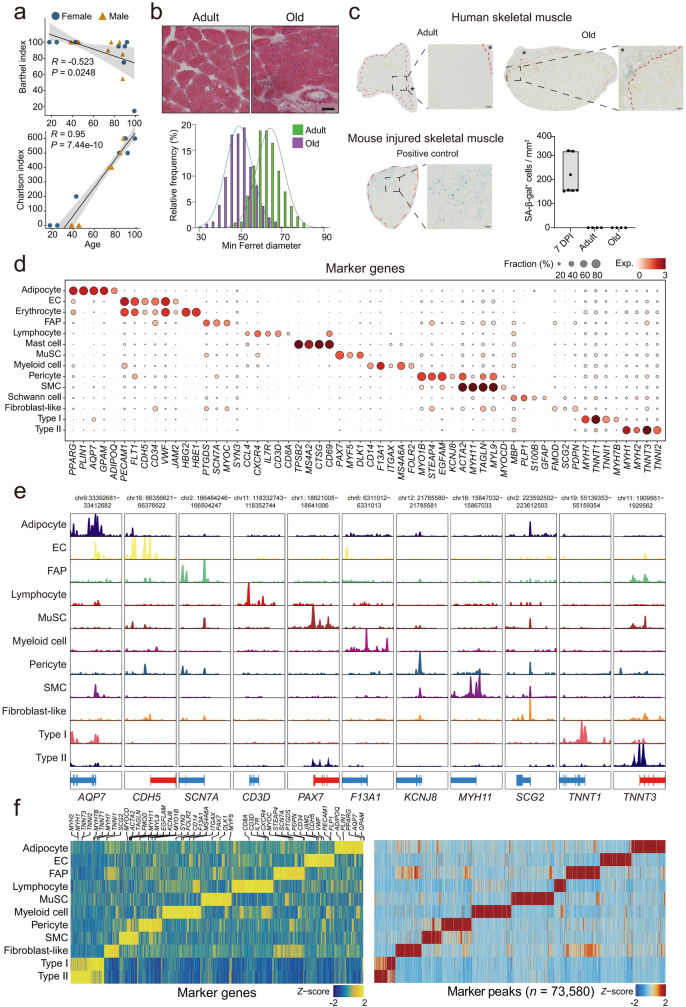
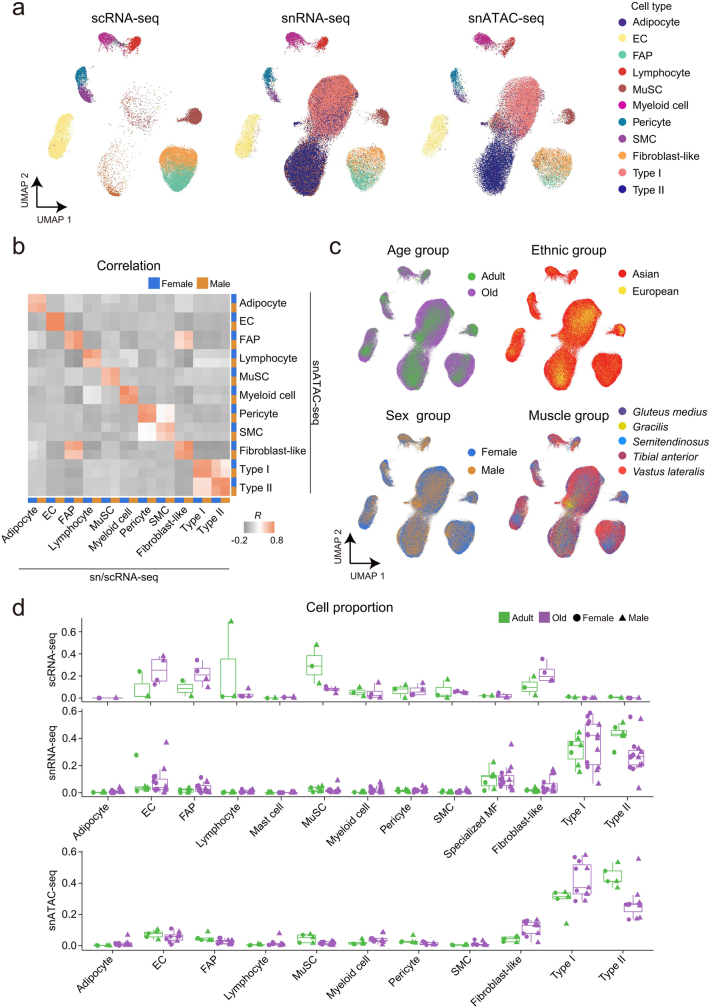
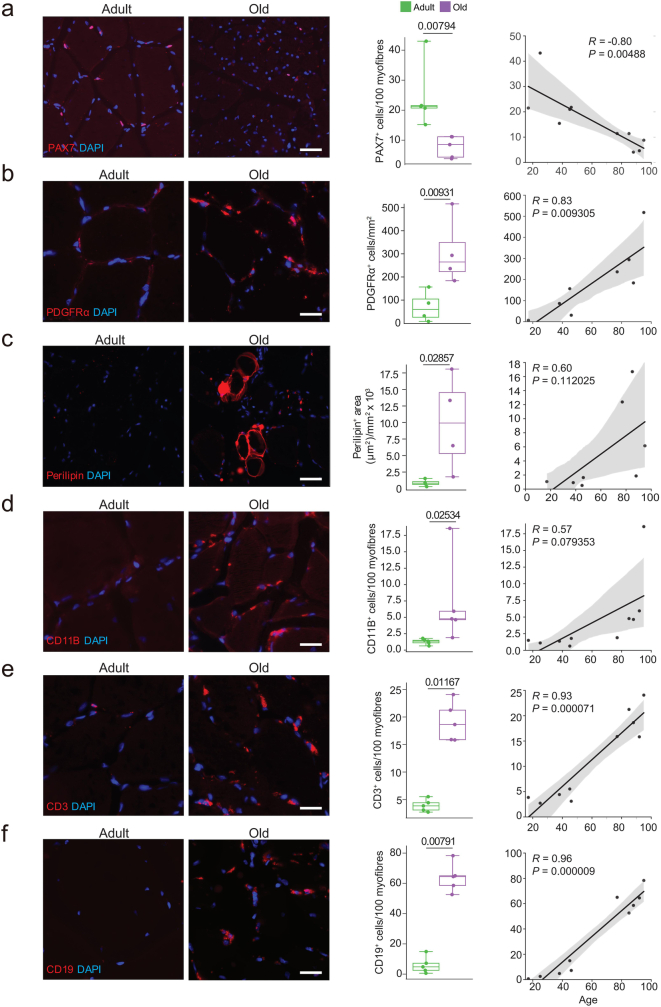
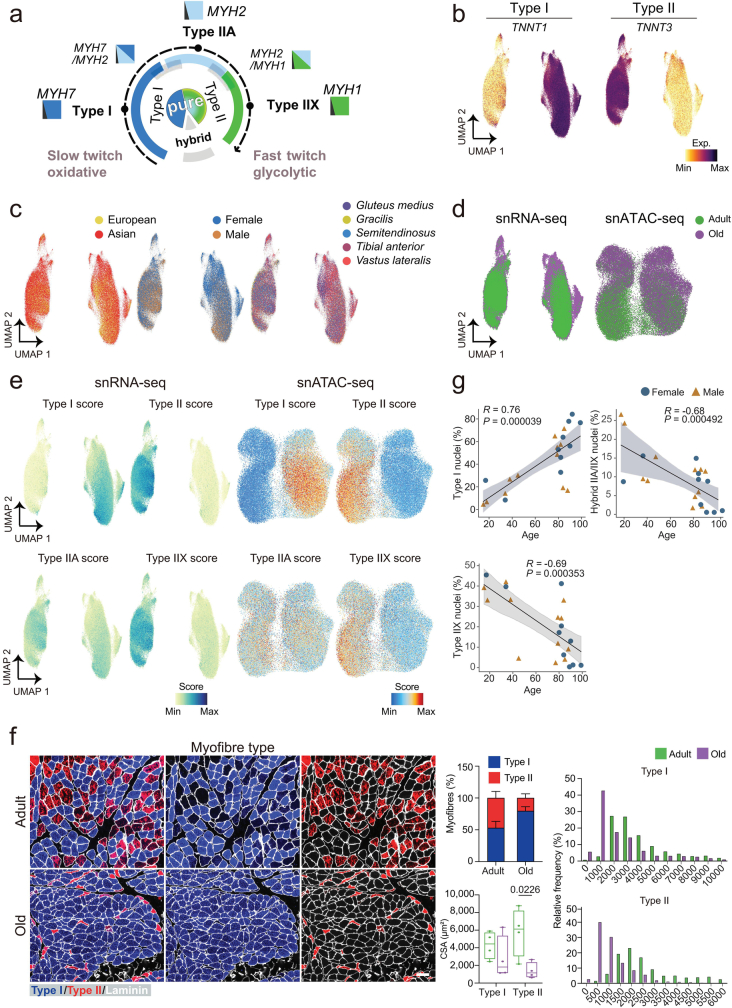
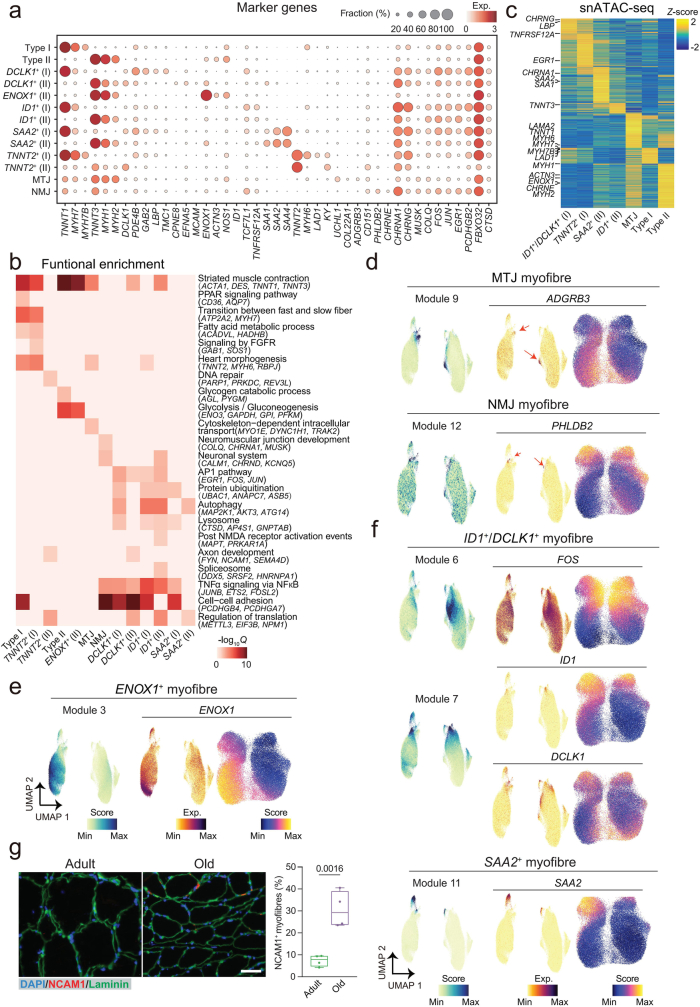
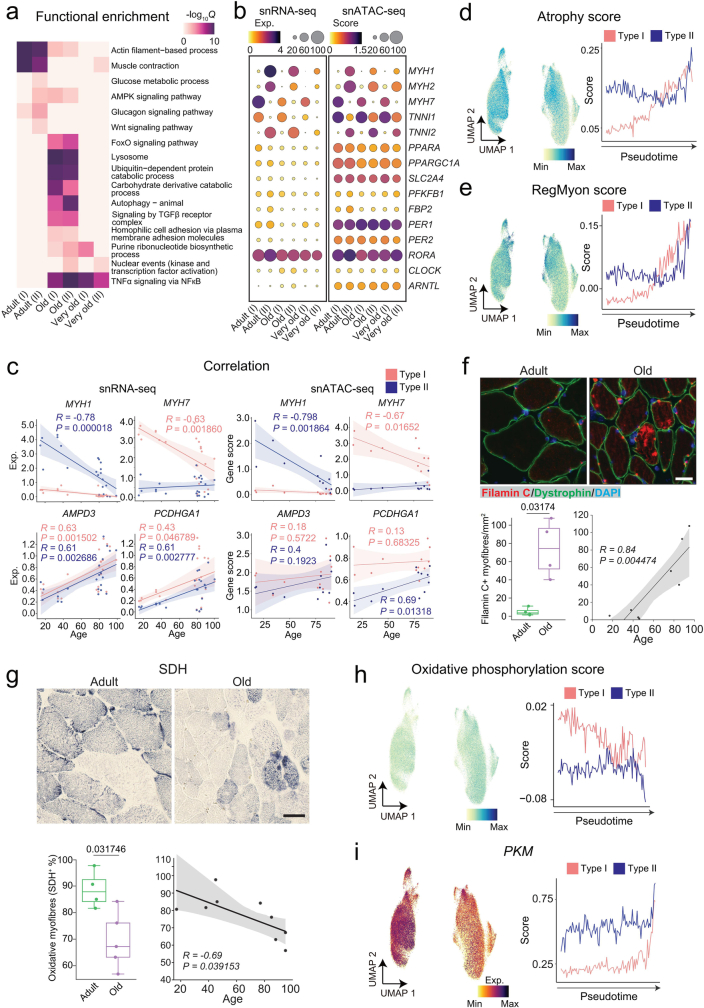
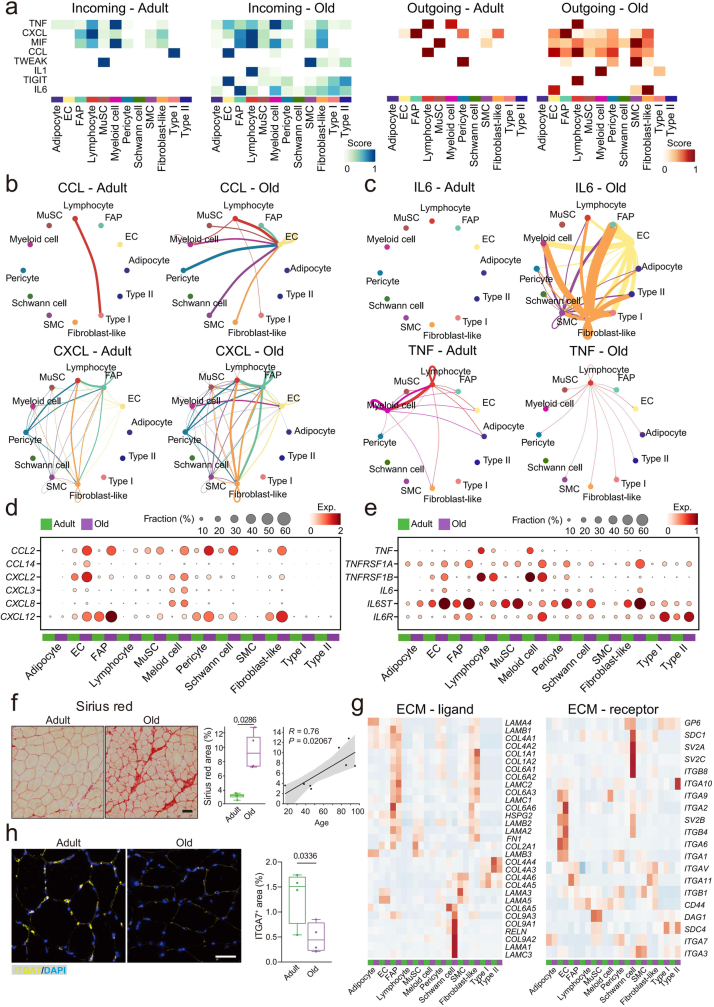
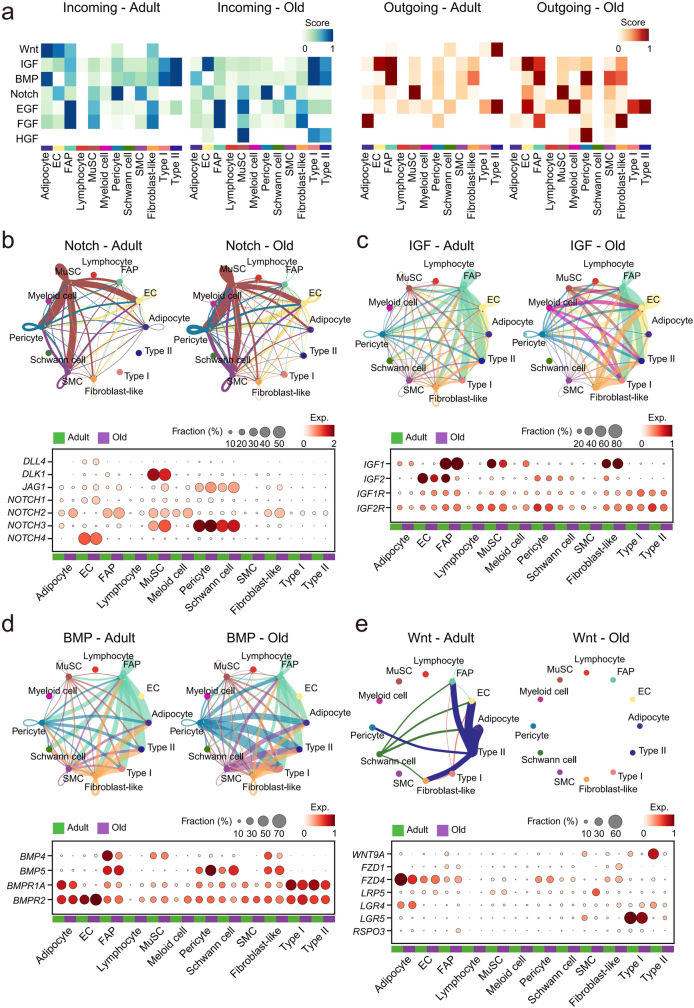
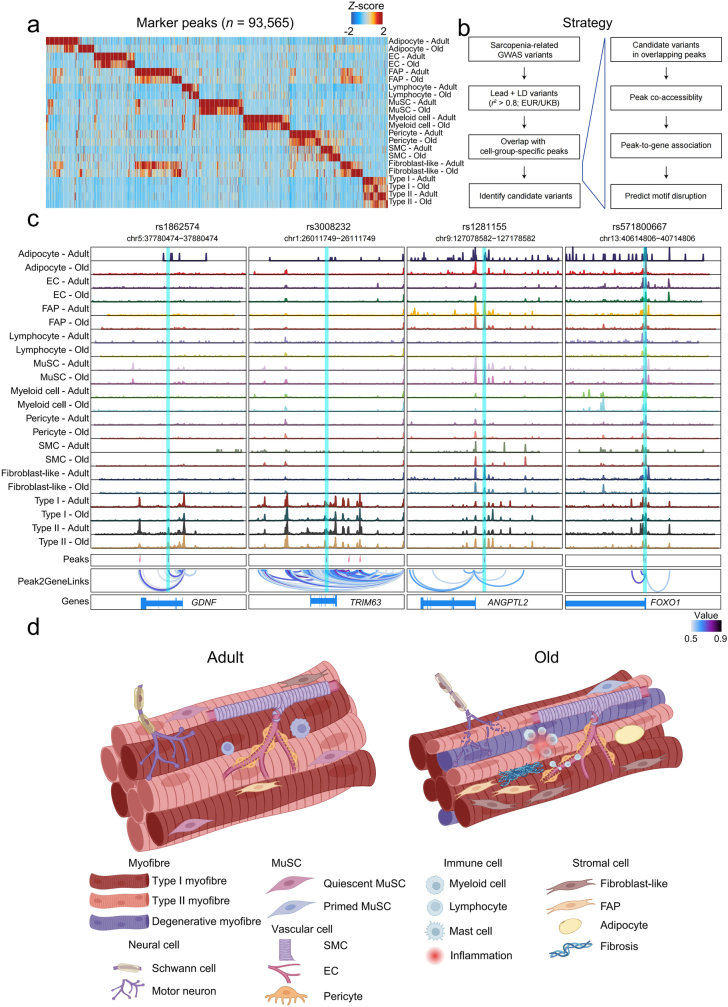
Muscle atrophy and functional decline (sarcopenia) are common manifestations of frailty and are critical contributors to morbidity and mortality in older people1. Deciphering the molecular mechanisms underlying sarcopenia has major implications for understanding human ageing2. Yet, progress has been slow, partly due to the difficulties of characterizing skeletal muscle niche heterogeneity (whereby myofibres are the most abundant) and obtaining well-characterized human samples3,4. Here we generate a single-cell/single-nucleus transcriptomic and chromatin accessibility map of human limb skeletal muscles encompassing over 387,000 cells/nuclei from individuals aged 15 to 99 years with distinct fitness and frailty levels. We describe how cell populations change during ageing, including the emergence of new populations in older people, and the cell-specific and multicellular network features (at the transcriptomic and epigenetic levels) associated with these changes. On the basis of cross-comparison with genetic data, we also identify key elements of chromatin architecture that mark susceptibility to sarcopenia. Our study provides a basis for identifying targets in the skeletal muscle that are amenable to medical, pharmacological and lifestyle interventions in late life.


Conflict of interest statement

Y.L., P.G., J.Z., Y.Y., C.L., L.L., X.X. and M.A.E. are employees of BGI Group. I.R.-P., J.I., E.P., A.L.S. and P.M.-C. are employees of Altos Labs. The other authors declare no competing interests.

Figures

Fig. 1
Fig. 1. Multimodal human locomotor skeletal muscle ageing atlas.
a, Schematic of the hindlimb skeletal muscle samples analysed in this study. The samples were obtained from 12 adult and 19 older adult (old) individuals (left). The samples were processed for single-nucleus or single-cell isolation for sc/snRNA-seq and/or snATAC-seq library construction (using the DNBelab C4 kit) and sequencing (top middle), or subjected to morphological analysis (bottom middle). Right, the sex, age and profiled nuclei/cells per individual. b, UMAP analysis of 292,423 sc/snRNA-seq profiles delineating 15 main skeletal muscle cell populations (top). Bottom, the number of nuclei/cells sequenced for each cell type. Dots and bars are coloured by cell type. MF, myofibre. c, UMAP analysis of 95,021 snATAC-seq profiles delineating 11 main skeletal muscle cell populations (top) at the chromatin level based on gene-activity scores of established marker genes. Bottom, the number of nuclei sequenced for each cell type. Dots and bars are coloured by cell type. d, The relative proportional changes of each cell type with ageing (column 1) and each single-cell modality (columns 2–4) considering co-variable factors as sex, ethnicity, omics technology and sequencing batch. The colour scale represents the fold change, and the dot size shows the probability of change (local true sign rate (LTSR)) calculated using a generalized linear mixed model with a Poisson outcome. e, Quantification of the transcriptional (top) and epigenetic (bottom) heterogeneity by age group and cell type. n = 300 cells obtained by downsampling from the total captured cells in each cell type. For cell types with fewer than 300 cells, all cells were included for analysis. For the box plots, the centre line shows the median, the box limits show the upper and lower quartiles, and the whiskers show 1.5× the interquartile range. For e, P values were calculated using two-tailed Mann–Whitney U-tests. Source Data
Fig. 2
Fig. 2. Emergent myonucleus populations with human muscle ageing.
a, UMAP analysis of myonuclei in both snRNA-seq (top) and snATAC-seq (bottom) coloured according to their myofibre-type-specific classification. Each annotated population is correspondingly coloured in both datasets. b, Quantification of the myonucleus proportions in adult (green) and older adult (purple) individuals according to the classified myofibre type in snRNA-seq (top) and snATAC-seq (bottom). NS, not significant. For snRNA-seq, n = 7 adult individuals and n = 15 older adult individuals; for snATAC-seq, n = 5 adult individuals and n = 11 older adult individuals. c, UMAP analysis of myonucleus subpopulations of snRNA-seq (top) and snATAC-seq (bottom) data. Each annotated population is correspondingly coloured in both datasets. MTJ, myotendinous junction. d, As in b, quantification of the detected myonucleus subpopulation proportions in adult and older adult individuals. e, The scaled aggregated expression levels (z score) in each myonucleus population for the co-expressing genes in each module. f, The scaled gene expression level (z score) across co-expression modules. Selected enriched genes and their associated pathways (coloured according to module) are highlighted on the right. GO, Gene Ontology. g, UMAP analysis of the aggregated expression (exp.) level for module 8 (left), and TNNT2 gene expression (middle) and its gene score (right). h, Representative images (left) and corresponding quantification (right) of immunofluorescence analysis of TNNT2+ myofibres (TNNT2, green; nuclei, DAPI, blue) in adult (sample P9) and older adult (sample P29) individuals. Scale bar, 10 μm. n = 2 adult individuals and n = 4 older adult individuals. For the box plots, the centre line shows the median, the box limits show the upper and lower quartiles, and the whiskers show 1.5× the interquartile range. For b and d, P values were calculated using two-tailed Mann–Whitney U-tests. Source Data
Fig. 3
Fig. 3. Myonucleus ageing trajectories and GRN.
a, UMAP analysis of the ageing trajectory (pseudotime) (top) for type I and type II myonucleus populations in the snRNA-seq dataset. Dots are coloured by the projected pseudotime. The proportion (prop.) of adult (green) and older adult (purple) myonuclei in snRNA-seq data aligned along the type I (middle) and type II (bottom) myonucleus ageing trajectory (divided into 100 bins). b, UMAP analysis of the sarcomeric score for the myonuclei (top) and a line chart showing the average sarcomeric score for type I (red) and type II (blue) myonuclei along the ageing trajectory (bottom). The gene list for sarcomeric score is provided in Supplementary Table 3. c, The module score for the gene clusters along the ageing trajectory for type I (red) and type II (blue) myonuclei (left). Right, the corresponding gene expression level (z score). The gene list for each gene cluster is provided in Supplementary Table 6. d, Functional enrichment analysis of each gene cluster obtained from c. Pathway significance (−log10[Q]) is depicted by the colour scale. A list of genes associated with each pathway is provided in Supplementary Table 6. e, UMAP analysis of the ageing trajectory for type I and type II myonuclei in the snATAC-seq dataset, transferred from snRNA-seq data. The ageing trajectory was divided into ten bins (left). The proportion of adult (green) and older adult (purple) myonuclei in snATAC-seq aligned along the type I (top right) and type II (bottom right) pseudotime trajectory. f, The mean regulation score (log10-transformed) across all DORCs using the FigR approach per TF for type I and type II myonuclei along the ageing trajectory. The regulation score (y axis) discerns between TF activators (positive score) and repressors (negative score) for the mapped TF motifs. Source Data
Fig. 4
Fig. 4. Resident mononucleated populations in the human skeletal muscle with ageing.
a, UMAP analysis of the detected MuSC subpopulations in snRNA-seq data. Dots are coloured according to cell type. b, The relative proportional changes of each MuSC subpopulation with ageing (column 1) and each single-cell modality (columns 2–4), considering co-variable factors (ethnicity, omics technology and sequencing batch). The colour scale represents the fold change, and the dot size shows the probability of change (LTSR) calculated using a generalized linear mixed model with a Poisson outcome. c, Functional enrichment analysis of DEGs obtained between adult and older adult groups for each MuSC subpopulation. The colour scale represents the significance (−log10[Q]) of the enriched terms for upregulated (red) and downregulated (blue) genes with ageing. d, TF motif enrichment for upregulated (top) and downregulated (bottom) peaks in qMuSCs with ageing (older adult versus adult). TFs were plotted according to their rank (x axis) and their associated −log10[Q] (y axis). e, UMAP analysis as in a for vascular cell subpopulations. artEC, arteriole EC; venEC, venule EC; capEC, capillary EC; MC, mural cell subpopulations. f, The relative proportional changes as in b for vascular cell subpopulations. g, Functional enrichment analysis of DEGs (older adult versus adult) as in c for vascular cell subpopulations. h, UMAP analysis as in a for immune cell subpopulations. Bmem, memory B cells; DC, dendritic cells; M2, M2-like macrophages; mono, monocytes; Treg, regulatory T cells. i, The relative proportional changes as in b for immune cell subpopulations. j, Functional enrichment analysis of DEGs (older adult versus adult) as in c for immune cell subpopulations. k, UMAP analysis as in a for stromal cell subpopulations. l, The relative proportional changes as in b for stromal cell subpopulations. m, Functional enrichment analysis of DEGs (older adult versus adult) as in c for stromal cell subpopulations. Source Data
Fig. 5
Fig. 5. Interactome analysis of skeletal muscle cellular components.
a, The number of predicted interactions (L–R pairs) for each cell type in the adult (green) and older adult (purple) age groups. b, The fold change (log2-transformed, colour scale) with ageing in the number of sent signals (outgoing, horizontal side) and received signals (incoming, vertical side) for each cell type. c, The sum of the interaction probability differences (relative information flow) among all pairs for each depicted group of interactions in the adult (green) and older adult (purple) age groups. Interactions are grouped according to the following categories: inflammation (top left), ECM (bottom left) and growth factors (right). d, The TGFβ signalling network in adult (top) and older adult (bottom); nodes represent cell types and edges represent the interactions among them. The edge width is proportional to the interaction probability. e, The expression levels of the genes associated with TGFβ signalling pathway in adult (green) and older adult (purple) muscles. The colour scale represents the average gene expression, and the dot size shows the percentage of cells expressing a given marker within the subpopulation. f, Signalling network, as in d, for the activin signalling pathway. g, The expression levels as in e for the activin signalling pathway and muscle-atrophy-related genes. h, Representative images (left) and corresponding quantification (right) of immunofluorescence analysis of ACVR2A+ area (ACVR2A, magenta; cell membrane, WGA, green; nuclei, DAPI, blue) in adult (sample P5) and older adult (sample P28) individuals. Scale bar, 50 μm. n = 5 individuals for each age group. P values were calculated using two-tailed Mann–Whitney U-tests. For the box plots, the centre line shows the median, the box limits show the upper and lower quartiles, and the whiskers show 1.5× the interquartile range. Source Data
Fig. 6
Fig. 6. Interpretation of genetic variants related to sarcopenia.
a, Differential enrichment (−log10[P]) for complex traits obtained by LDSC analysis of the snATAC-seq peaks mapped within each cell type between adult (left) and older adult (right) age groups. Dots are coloured by cell type. b,c, Genome browser tracks (top) showing the normalized aggregate signals associated to the genetic variant rs6488724 at the MGP locus (b) and rs73746499 at the FKBP5 locus (c) for each cell population (rows) in adult and older adult muscles. Obtained peaks at these loci were linked to corresponding genes. The association between peaks and genes is represented by the colour scale. The reference sequence (ref.) and the altered sequence (alt.) of the genetic variants and the motifs for HSF2 (gain of binding) and AR (loss of binding) are shown at the bottom. Source Data
Extended Data Fig. 1
Extended Data Fig. 1. Functional characterization and major cell type identification in skeletal muscle across ageing.
a, Correlation plots of the Barthel index (autonomy vs dependency assessment, top panel) and the Charlson index (patient´s comorbidities, bottom panel) with the age of the individuals in both men (triangles) and women (circles). The shape and colour represent the sex group. R, Pearson correlation coefficient; P, two-sided P-value; centre represents the average value; shade indicates 95% confidence interval. b, Samples used in this study were subjected to H&E staining to assess their tissular integrity. One representative image from the tissue of each age group is depicted (top panel; adult, sample P13; old, sample P28). Scale bar, 50 μm. The myofibre size (Min Feret diameter) distribution was quantified between muscles from the two age groups (bottom panel). The colour represents the age group. n = 4 for each age group. c. Representative images of SA-β-gal staining of adult (sample P26), old (sample P28) uninjured human muscle (top panel) or of injured mouse muscle at 7 days post-cardiotoxin injury (7 DPI) as a positive control (bottom left panel). In each muscle section (overview and insets), muscle tissue is designated with the red dashed line, and the surrounding tissue is marked with an asterisk. Scale bars, 25 μm. Boxplot showing the SA-β-gal+ cells quantification within the myofibre tissue where boxes represent the upper/lower quartiles, the line depicts the median and whiskers the 1.5 interquartile range. n = 4 individuals from each age group for human muscle, n = 7 for injured mouse muscle. d, Dot plot showing the expression level for representative marker genes in the indicated cell types. Colour scale represents the average gene expression, and dot size, the percentage of cells expressing a given marker within the subpopulation. e, Normalized genome browser track profiles in the proximal promoters of the indicated marker genes (columns) for the indicated cell types (rows) measured in snATAC-seq. f, Heatmap of marker genes (gene score, left panel) and marker peaks (differentially accessible peaks, right panel) for the indicated cell types measured in snATAC-seq. Colour scale represents the relative score (Z-score) of each marker gene/peak. Source Data
Extended Data Fig. 2
Extended Data Fig. 2. Integration of multimodal single-cell data.
a, UMAP plots of the cells/nuclei from the integrated scRNA-seq, snRNA-seq and snATAC-seq datasets split by technologies. Dots are coloured by the cell types. b, Correlation heatmap for cell-type assignment between the sc/snRNA-seq and snATAC-seq datasets. Colour scale represents the computed Pearson correlation coefficient (R). c, UMAP plots of the cells/nuclei from the integrated scRNA-seq, snRNA-seq and snATAC-seq datasets grouped by sampling factors (age, ethnic, sex and muscle group). Dots are coloured by the sampling factors within each group comparison. d, Cell proportion analysis for the percentage of each cell population in the scRNA-seq (top), snRNA-seq (middle) and snATAC-seq (bottom) for each individual. The colour represents the age group and the shape represent the sex group. For scRNA-seq, n = 3 adult individuals and n = 4 old individuals; for snRNA-seq, n = 7 adult individuals and n = 15 old individuals; for snATAC-seq, n = 5 adult individuals and n = 11 old individuals. For boxplots, boxes represent the upper/lower quartiles, the line depicts the median and whiskers the 1.5 interquartile range. Source Data
Extended Data Fig. 3
Extended Data Fig. 3. Cell proportion changes of human skeletal muscle with ageing.
Representative images of immunofluorescence staining from adult (left) and old (right) muscle tissue sections for specific cell types (red), their respective quantifications by age groups, and correlation plots with the age of the individuals (right panels). a, MuSCs labelled with anti-PAX7 (adult, sample P5; old, sample P28); b, FAPs and fibroblast-like cells labelled with anti-PDGFRα (adult, sample P5; old, sample P28); c, Adipocytes labelled with anti-Perilipin (adult, sample P26; old, sample P28); d, macrophages labelled with anti-CD11B (adult, sample P9; old, sample P29) e, T cells labelled with anti-CD3 (adult, sample P9; old, sample P16); f, B cells labelled with anti-CD19 (adult, sample P5; old, sample P23). Scale bars, 50 μm in (a, c), and 25 μm in (b, d-f). Nuclei were counterstained with DAPI (blue). For PDGFRα and perilipin, n = 4 individuals for each group; for PAX7, CD11B, CD3 and CD19, n = 5 individuals for each group. For all boxplots, P values were calculated by a two-tailed Mann-Whitney U-test. For boxplots, boxes represent the upper/lower quartiles, the line depicts the median and whiskers the 1.5 interquartile range. For correlation plots, R, Pearson correlation coefficient; P, two-sided P-value; centre represents the average value; shade indicates 95% confidence interval. Source Data
Extended Data Fig. 4
Extended Data Fig. 4. Myofibre type classification and proportion assessment with ageing.
a, Schematic depicting the definition of myofibre types according to myosin (MYH) genes expression. b, UMAP plots of myonucleus populations coloured according to TNNT1 (type I myonuclei) and TNNT3 (type II myonuclei) gene expression (colour scale). c, UMAP plots of myonucleus populations coloured and grouped by sampling factors (ethnic, sex and muscle group) in the snRNA-seq dataset. d, UMAP plots of myonucleus populations belonging to adult (green) and old (purple) muscles in both snRNA-seq (left panel) and snATAC-seq (right panel) datasets. e, UMAP plots of myonucleus type score for each myofibre type from the snRNA-seq dataset (left panels) and the snATAC-seq dataset (right panels). Myonucleus type scores were calculated based on the gene expression (snRNA-seq) or gene score (snATAC-seq) of distinct MYH genes among other myofibre-type specific genes (Supplementary Table 3). Dots (myonuclei) are coloured according to their computed score. f, Representative images of immunofluorescence for myofibre typing from adult (left top, sample P13) and old (left bottom, sample P29) muscle tissue sections of type I (blue) and type II (red) myofibres delimited by laminin (white). Scale bars, 100 μm. Quantification graphs of average myofibre size (middle bottom), myofibre type proportion (middle top) and myofibre size distribution for type I (right top) and type II myofibres (right bottom). Myofibre size was measured as cross-sectional area (CSA). n = 4 individuals of each age group. For boxplots, boxes represent the upper/lower quartiles, the line depicts the median and whiskers the 1.5 interquartile range. P value was calculated by a two-tailed unpaired Student’s t-test. For barplots, data are presented as mean values +/− SEM. g, Correlation plots of the proportion of indicated myofibre types with ageing. The shape and colours represent the sex group. R, Pearson correlation coefficient; P, two-sided P value; centre represents the average value; shade indicates 95th confidence interval. Source Data
Extended Data Fig. 5
Extended Data Fig. 5. Markers for defining specialized myonucleus subtypes.
a, Dot plot showing the expression levels for representative marker genes in all myonucleus subpopulations. Colour scale represents the average gene expression, and dot size, the percentage of cells expressing a given marker within the subpopulation. b, Heatmap depicting enriched pathways from DEGs obtained in each myonucleus population. Colour scale represents the significance (-log10 Q) of the enriched terms. c, Heatmap showing the gene score for DEGs (row) in each myonucleus population (columns) identified in snATAC-seq. Colour scale represents the scaled gene score (Z-score) for each DEG. d-f, UMAP plots highlighting the aggregated gene module expression (left panel); gene expression (middle panel) and gene score (right panel) for the following myonucleus subpopulations: d, module 9 with ADGRB3 gene for MTJ population; and module 12 with PHLDB2 gene for NMJ population; e, module 3 with ENOX1 gene for ENOX1+ population; f, module 6 and 7 with FOS, ID1 and DCLK1 genes for ID1+/DCLK1+ population; and module 11 with SAA2 genes for SAA2+ population. Dots (myonuclei) are coloured according to their computed score or gene expression value. g, Representative images (left panel) and the corresponding quantification (right panel) of immunofluorescence for denervated myofibres (NCAM1, red; myofibre membrane, laminin, green; nuclei, DAPI, blue) in adult (sample P9) and old (sample P28) individuals. n = 4 individuals of each age group. Scale bar, 10 μm. For boxplots, boxes represent the upper/lower quartiles, the line depicts the median and whiskers the 1.5 interquartile range. P value was calculated by a two-tailed Student’s t-test. Source Data
Extended Data Fig. 6
Extended Data Fig. 6. Functional processes driving type I and type II myofibre ageing.
a, Heatmap depicting enriched pathways of DEGs for both myonucleus types in adult (≤ 46 years), old (74-82 years) and very old (≥ 84 years) age groups. Pathway significance (-log10 Q) is represented by the colour scale. b, Dot plots showing the gene expression (snRNA-seq, left panel) or gene score (snATAC-seq, right panel) for selected genes (rows) in adult, old and very old type I (I) and type II (II) myonuclei. Colour scale represents the average gene expression, and dot size, the percentage of cells expressing a given marker within the subpopulation. c, Correlation plots of the expression levels for the given genes (MYH1, MYH7, AMPD3, PCDHGA1) with the individual’s age, for type I (red) and type II (blue) myonuclei in snRNA-seq (left panels) and chromatin accessibility levels for the corresponding genes in snATAC-seq (right panels). R, Pearson correlation coefficient; P, two-sided P-value; centre represents the average value; shade indicates 95% confidence interval. d-e, UMAP plots (left) or line charts (right) showing the (d) atrophy score (atrophy-related genes; left panels) and (e) RegMyon score (regenerating myonucleus signature; right panels) for type I (red) and type II myonuclei (blue) along the ageing trajectory. Gene lists for atrophy score and RegMyon score can be found in Supplementary Table 3. Dots (myonuclei) are coloured according to their computed score. f, Representative images (top panel), quantification comparing the age groups (bottom left panel) and correlation with the age of the individuals (bottom right panel) of immunofluorescence for filamin-C+ myofibres (filamin-C, red; myofibre membrane, dystrophin, green; nuclei, DAPI, blue) (left panel) in adult (sample P13) and old (sample P28) individuals; boxplot showing the quantification for filamin-C+ myofibres (middle panel); correlation plot of the proportion of filamin-C+ myofibres. n = 4 individuals of each age group. Scale bar, 25 μm. For boxplots, boxes represent the upper/lower quartiles, the line depicts the median and whiskers the 1.5 interquartile range. P value was calculated by two-tailed Mann-Whitney U-test. For the correlation plot, R, Pearson correlation coefficient; P, two-sided P value; centre represents the average value; shade indicates a 95% confidence interval. g, Representative images (top panel), quantification comparing the age groups (bottom left panel) and correlation with the age of the individuals (bottom right panel) for succinate dehydrogenase (SDH) activity staining (blue) in adult (sample P13) and old (sample P28) individuals. n = 4 for the adult group and n = 5 for old group. Scale bar, 50 μm. For boxplots, boxes represent the upper/lower quartiles, the line depicts the median and whiskers the 1.5 interquartile range. P value was calculated by two-tailed Mann-Whitney U-test. For the correlation plot, R, Pearson correlation coefficient; P, two-sided P value; centre represents the average value; shade indicates 95% confidence interval. h-i, UMAP plots (left) or line charts (right) showing the oxidative phosphorylation scores (h) and the gene expression level of PKM (i) as a representative gene for glycolysis pathway for type I (red) and type II myonuclei (blue) along the ageing trajectory. Gene lists for oxidative phosphorylation scores can be found in Supplementary Table 3. Dots (myonuclei) are coloured according to their computed score or gene expression value. Source Data
Extended Data Fig. 7
Extended Data Fig. 7. Gene regulatory network for ageing myofiber.
a, Pipeline scheme for constructing gene-regulatory network: (1) nuclei of snRNA-seq and snATAC-seq datasets were paired using scOptMatch; (2) identification of significant peak-to-gene associations for defining the domains of regulatory chromatin (DORC); (3) TF binding motif enrichment was evaluated in DORC regions; and (4) identification of potential TF regulators (repressors or activators) based on the correlation of TF expression and the motif enrichment. b, Correlation heatmap for the DORC expression (RNA) and chromatin accessibility (ATAC) for type I (top panel) and type II (bottom panel) myonuclei. Colour scale represents the computed Pearson correlation coefficient (R). c, Heatmap showing the smoothed normalized DORC accessibility (left panel), RNA expression (middle panel), and residual (DORC-RNA, right panel) levels for JUND, JUN, FOS, JUNB and EGR1 along the ageing trajectory for type I (top panel) and type II (bottom panel) myofibre. d, Tn5 bias-adjusted TF footprints for FOSL2 and STAT3 along the type I (left panel) and type II (right panel) ageing trajectory. The type I and type II myonuclei were classified into five proportions according to the pseudotime in the ageing trajectory. In each graph, the Tn5 bias-subtracted normalized insertions (y-axis) from the motif centre to 200 bp at each side (x-axis) were shown. Source Data
Extended Data Fig. 8
Extended Data Fig. 8. Multimodal human muscle stem cell atlas in ageing.
a, UMAP plots showing the level of stress index (top panels) and FOS (bottom panels) expression as representative genes contributing to this index for both scRNA-seq (left panels) and snRNA-seq (right panels) datasets. The gene list for the stress index can be found in Supplementary Table 3. Dots (cells/nuclei) are coloured according to their computed score or gene expression value. b, UMAP plots of the detected MuSC subpopulations (top panels) and age groups (bottom panels) in sc/snRNA-seq (left panels) and snATAC-seq (right panels). Dots (cells/nuclei) are coloured by subpopulation (top panels) or age group (bottom panels). c, Dot plots showing the expression level for representative marker genes (columns) for MuSC subpopulations (rows) by snRNA-seq (top panel) and scRNA-seq (bottom panel). Colour scale represents the average gene expression, and dot size, the percentage of cells expressing a given marker within the subpopulation. d, Heatmaps showing the expression levels for DEGs (left panel, colour scale by Z-score) and the corresponding functional enrichment analysis (right panel, colour scale by -log10 Q) for each MuSC subpopulation in the snRNA-seq dataset. e, Heatmaps showing the marker peaks (left panel, colour scaled by Z-score) and the corresponding enriched TF motifs (right panel, colour scaled by -log10 Q) for each MuSC subpopulation in the snATAC-seq dataset. f, Tn5 bias-adjusted TF footprints for JUNB (top panel) and MYOG (bottom panel) in each MuSC subpopulation detected by snATAC-seq. In each graph, the Tn5 bias-subtracted normalized insertions (y-axis) from the motif centre to 200 bp at each side (x-axis) were shown. g, Cell proportion analysis for the percentage of each MuSC subpopulation in the snRNA-seq (top), scRNA-seq (middle) and snATAC-seq (bottom) for each individual. The colours represent the age group and the shapes represent the sex group. For scRNA-seq, n = 3 adult individuals and n = 4 old individuals; for snRNA-seq, n = 7 adult individuals and n = 15 old individuals; for snATAC-seq, n = 5 adult individuals and n = 11 old individuals. h, Representative images (left panel) and corresponding quantification (right panel) of immunofluorescence for primed MuSCs (PAX7, red; FOS, green; nuclei, DAPI, blue) in adult (sample P26, top left) and old (sample P28, bottom left) individuals. n = 4 individuals of each age group. Scale bar, 25 μm. For boxplots, boxes represent the upper/lower quartiles, the line depicts the median and whiskers the 1.5 interquartile range. P value was calculated by a two-tailed Student’s t-test. i, Heatmap depicting enriched pathways of the qMuSCs population in adult (≤ 46 years), old (74-82 years) and very old (≥ 84 years) age groups. Colour scale represents the significance (-log10 Q) of the enriched terms. j, Correlation plots of the expression levels for the given genes (ITGBL1, MEF2D and FOS) with individuals’ age for qMuSCs. R, Pearson correlation coefficient; P, two-sided P-value; centre represents the average value; shade indicates 95% confidence interval. Source Data
Extended Data Fig. 9
Extended Data Fig. 9. Vascular and immune compartment atlas of the ageing human skeletal muscle.
a, Dot plot showing the expression levels for representative marker genes (columns) for each vascular cell subpopulation (rows). Colour scale represents the average gene expression, and dot size, the percentage of cells expressing a given marker within the subpopulation. b, UMAP plot of the detected vascular cell subpopulations by snATAC-seq. Dots were coloured by the cell types. c, Heatmaps of the marker genes (gene score, left panel) and marker peaks (differentially accessible peaks, right panel) for each vascular subpopulation measured in snATAC-seq. Colour scale represents the relative score (Z-score) of each marker gene/peak. d, Heatmap showing the cell-type assignment correlation for vascular cell subpopulations between the sc/snRNA-seq and snATAC-seq datasets. Colour scale represents the computed Pearson correlation coefficient (R). e, Cell proportion analysis with the percentage of each vascular cell subpopulation for the scRNA-seq (top panel), snRNA-seq (middle panel) and snATAC-seq (bottom panel) for each individual. The colours represent the age group and the shapes represent the sex group. For scRNA-seq, n = 3 adult individuals and n = 4 old individuals; for snRNA-seq, n = 7 adult individuals and n = 15 old individuals; for snATAC-seq, n = 5 adult individuals and n = 11 old individuals. For boxplots, boxes represent the upper/lower quartiles, the line depicts the median and whiskers the 1.5 interquartile range. f, as in (a), for immune cell subpopulations. g, as in (b), for immune cell subpopulations. h, as in (c), for immune cell subpopulations. i, as in (d), for immune cell subpopulations. j, as in (e), for immune cell subpopulations. For scRNA-seq, n = 3 adult individuals and n = 4 old individuals; for snRNA-seq, n = 5 adult individuals and n = 13 old individuals; for snATAC-seq, n = 4 adult individuals and n = 10 old individuals. Source Data
Extended Data Fig. 10
Extended Data Fig. 10. Stromal compartment atlas of the ageing human skeletal muscle.
a, Dot plot showing the expression levels for representative marker genes for each stromal subpopulation (row). Colour scale represents the average gene expression, and dot size, the percentage of cells expressing a given marker within the subpopulation. b, UMAP plot of the detected stromal subpopulations in snATAC-seq. Dots were coloured by the cell types. c, Heatmaps of the marker genes (gene score, left panel) and marker peaks (differentially accessible peaks, right panel) for each identified population (columns). Colour scale represents the relative score (Z-score) for each marker gene/peak. d, Heatmap showing the cell-type assignment correlation for stromal cell subpopulations. Colour scale represents the Pearson correlation coefficient (R). e, Cell proportion analysis with the percentage of each stromal cell subpopulation in the scRNA-seq (top), snRNA-seq (middle) and snATAC-seq (bottom) for each individual. The colours represent the age group and the shapes represent the sex group. For scRNA-seq, n = 3 adult individuals and n = 4 old individuals; for snRNA-seq, n = 7 adult individuals and n = 14 old individuals; for snATAC-seq, n = 5 adult individuals and n = 11 old individuals. For boxplots, boxes represent the upper/lower quartiles, the line depicts the median and whiskers the 1.5 interquartile range. f, Heatmap depicting significantly enriched pathways for DEGs in each stromal cell subpopulation. Colour scale represents the significance (-log10 Q) of the enriched terms. g, Heatmap depicting the enriched pro-inflammatory (IL6/AP1) and pro-fibrotic (TGFβ) pathways of the resident mononucleated cell subpopulations in adult (≤ 46 years), old (74-82 years) and very old (≥ 84 years) age groups. Colour scale represents the significance (-log10Q) of the enriched terms. h, Dot plots showing the expression levels for the indicated cell-cycle inhibitor genes. Colour scale represents the average gene expression, and dot size, the percentage of cells expressing a given gene within the subpopulation. Source Data
Extended Data Fig. 11
Extended Data Fig. 11. Inflammatory and cell-ECM interaction networks of skeletal muscle with ageing.
a, Heatmaps of the incoming (white-blue scale, left panel) and outgoing (white-red scale, right panel) signals for adult (left side) and old (right side) for indicated signalling pathways. Colour scale represents the relative interaction intensity of each cell type for the represented pathways. b-c, (b) Chemokines (CCL, top panel; and CXCL, bottom panel) and (c) inflammatory factors (IL6, top panel; and TNF, bottom panel) signalling networks in adult (left panels) and old (right panels) groups. The nodes represent cell types and edges the interactions among them. Edge width is proportional to the interaction probability. Nodes and edges are coloured according to the cell type. d-e, Dot plot showing the expression level for the representative (d) chemokines and (e) inflammatory factors in adult (green) and old (purple) skeletal muscle cell populations. Colour scale represents the average gene expression, and dot size, the percentage of cells expressing a given gene within the subpopulation. f, Representative images (left panel) of adult (sample P26) and old (sample P28) muscles of Sirius red staining, quantification comparing the age groups (middle panel) and correlation with the age of the individuals (right panel). n = 4 individuals of each age group. Scale bar, 50 μm. For boxplots, boxes represent the upper/lower quartiles, the line depicts the median and whiskers the 1.5 interquartile range. P value was calculated by a two-tailed Mann-Whitney U-test. For the correlation plot, R, Pearson correlation coefficient; P, two-sided P value; centre represents the average value; shade indicates a 95% confidence interval. g, Heatmaps of the relative gene expression (Z-score) of ECM-ligands (left panel) and ECM-receptors (right panel) in each major cell population in both adult (green) and old (purple) individuals. h, Representative images (left panel) and corresponding quantification (right panel) of immunofluorescence for ITGA7+ area (ITGA7, yellow; nuclei, DAPI, blue) in adult (sample P5) and old (sample P29) individuals. Scale bar, 50 μm. n = 4 individuals of each age group. For boxplots, boxes represent the upper/lower quartiles, the line depicts the median and whiskers the 1.5 interquartile range. P value was calculated by a two-tailed Student’s t-test. Source Data
Extended Data Fig. 12
Extended Data Fig. 12. Perturbed Notch, IGF, BMP and Wnt signalling networks in aged muscles.
a, Heatmaps of the incoming (white-blue scale, left panel) and outgoing (white-red scale, right panel) signals for adult (left side) and old (right side) for indicated signalling pathways. Colour scale represents the relative interaction intensity of each cell type for the represented pathways. b-e, Notch (b), IGF (c), BMP (d), and Wnt (e) signalling networks (top panels) and the expression levels for the corresponding representative genes in each signalling network (bottom panels). Signalling networks are depicted for adult (left top panels) and old (right top panels). The nodes represent cell types and edges the interactions among them. Edge width is proportional to the interaction probability. Nodes and edges are coloured according to the cell type. For dot plots, the colour scale represents the average gene expression and dot size the percentage of cells expressing a given gene within the cell type in adult (green) and old (purple) individuals. Source Data
Extended Data Fig. 13
Extended Data Fig. 13. GWAS analysis of ageing muscle and spatial distribution of the human skeletal muscle changes with ageing.
a, Heatmap of the ageing-related marker peaks in each cell type identified by snATAC-seq. Colour scale represents the relative score (Z-score) of each marker peak. b, Pipeline scheme for identification of candidate sarcopenia-related genetic variants. Briefly, genetic variants with the high linkage disequilibrium (LD, r2 ≥ 0.8) to reported lead variants were overlapped to cell-type defined marker peaks to identify candidate variants. Next, the potential effects of candidate variants were assessed by the following steps: 1) identification of the co-accessible peaks; 2) construction of peak to gene linkage 3) predicting the effect of genetic variants on TF binding. c, Genome browser tracks for each cell population in adult and old muscles showing the peaks associated with the identified SNPs rs1862574, rs3008232, rs1281155 and rs571800667 within the locus of GDNF, TRIM63, ANGPTL2 and FOXO1, respectively. Chromatin tracks show the linkages between the variant-containing peaks and the associated gene promoter. d, (Adult) Human skeletal muscles are mainly composed of syncytial multinucleated type II and type I myofibres, each of which is innervated by single motorneuron endplates whose axons are surrounded by Schwann cells. Muscle resident mononuclear cell populations, such as MuSCs, stromal cells (FAPs and fibroblast-like cells), immune cells (myeloid cells and lymphocytes) and vascular cells (ECs, SMCs and pericytes), contribute to muscle homeostasis. (Old) Human skeletal muscle ageing is characterized by a reduction in mass, increased inflammation and fibrosis. Myofibre numbers are reduced, particularly type II myofibres. In addition, myofibres tend to lose their innervation and change their characteristics, and new myonuclear populations arise with abnormal regenerative, degenerative and denervation traits. The MuSC population is reduced and enters a primed state, leading to exhaustion of the stem cell pool. Intramuscular adipocytes accumulate among muscle fibres, and stromal cells increase, with a shift towards a pro-fibrotic profile. In the vasculature, the proportion of pericytes and capillary ECs decrease, and vascular integrity is impaired. Immune cells (myeloid cells, lymphocytes and mast cells) infiltrate the muscle and acquire a pro-inflammatory profile. Collectively, these alterations and the associated abnormalities in signalling networks impact muscle characteristics and functions. The schematic was created with BioRender.com.

Similar articles

Cited by

References

    1. Evans WJ, et al. Sarcopenia: no consensus, no diagnostic criteria, and no approved indication—how did we get here? Geroscience. 2023;46:183–190. doi: 10.1007/s11357-023-01016-9. - DOI - PMC - PubMed
    1. Wiedmer P, et al. Sarcopenia—molecular mechanisms and open questions. Ageing Res. Rev. 2021;65:101200. doi: 10.1016/j.arr.2020.101200. - DOI - PubMed
    1. Eraslan G, et al. Single-nucleus cross-tissue molecular reference maps toward understanding disease gene function. Science. 2022;376:eabl4290. doi: 10.1126/science.abl4290. - DOI - PMC - PubMed
    1. Perez K, et al. Single nuclei profiling identifies cell specific markers of skeletal muscle aging, frailty, and senescence. Aging. 2022;14:9393–9422. - PMC - PubMed
    1. Soendenbroe C, Andersen JL, Mackey AL. Muscle-nerve communication and the molecular assessment of human skeletal muscle denervation with aging. Am. J. Physiol. Cell Physiol. 2021;321:C317–C329. doi: 10.1152/ajpcell.00174.2021. - DOI - PubMed

Publication types

MeSH terms