. 2024 May;25(5):2188-2201.
doi: 10.1038/s44319-024-00139-0. Epub 2024 Apr 22.

Cellular remodeling and JAK inhibition promote zygotic gene expression in the Ciona germline

Affiliations

Cellular remodeling and JAK inhibition promote zygotic gene expression in the Ciona germline

Naoyuki Ohta et al. EMBO Rep. 2024 May.

Abstract

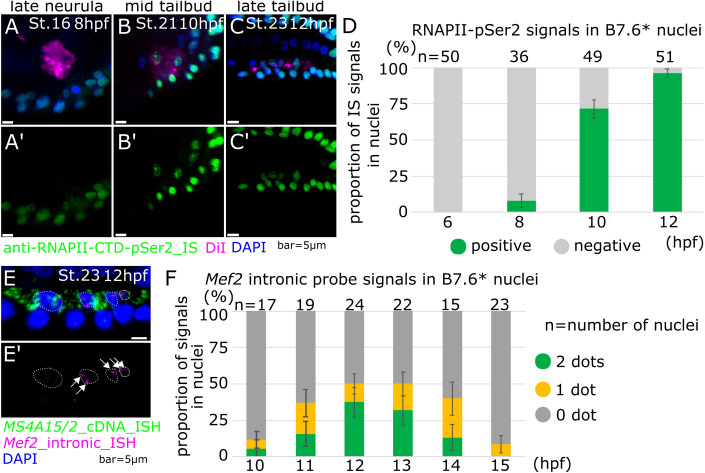
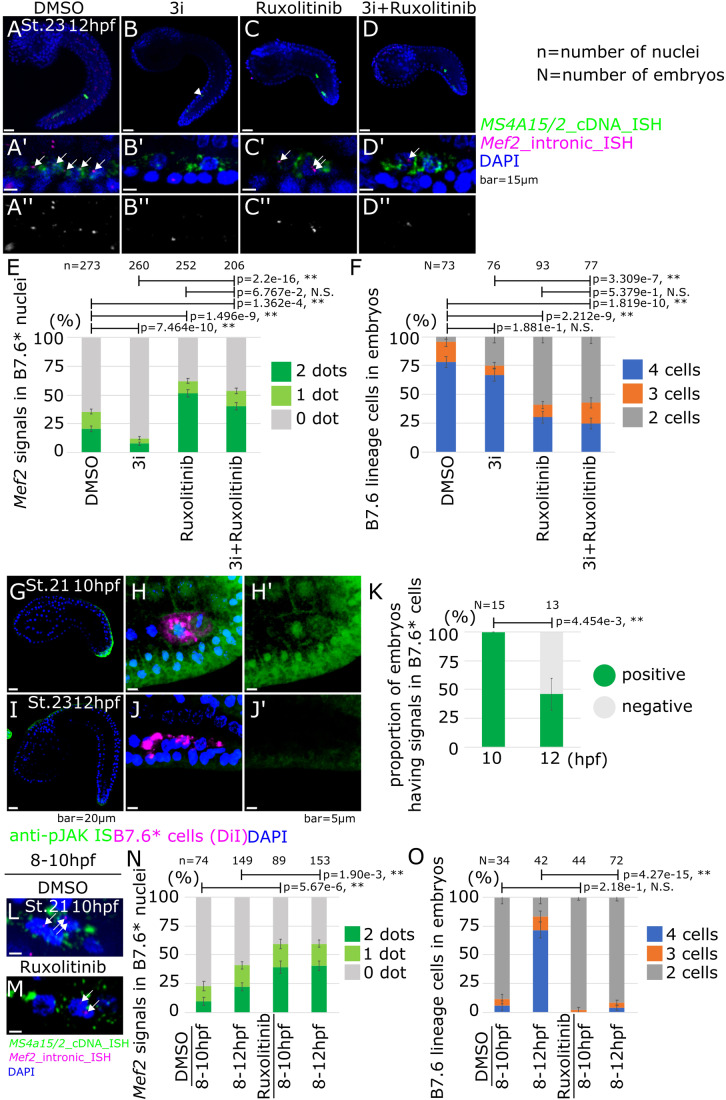
Transcription control is a major determinant of cell fate decisions in somatic tissues. By contrast, early germline fate specification in numerous vertebrate and invertebrate species relies extensively on RNA-level regulation, exerted on asymmetrically inherited maternal supplies, with little-to-no zygotic transcription. However delayed, a maternal-to-zygotic transition is nevertheless poised to complete the deployment of pre-gametic programs in the germline. Here, we focus on early germline specification in the tunicate Ciona to study zygotic genome activation. We first demonstrate that a peculiar cellular remodeling event excludes localized postplasmic Pem-1 mRNA, which encodes the general inhibitor of transcription. Subsequently, zygotic transcription begins in Pem-1-negative primordial germ cells (PGCs), as revealed by histochemical detection of elongating RNA Polymerase II, and nascent Mef2 transcripts. In addition, we uncover a provisional antagonism between JAK and MEK/BMPRI/GSK3 signaling, which controls the onset of zygotic gene expression, following cellular remodeling of PGCs. We propose a 2-step model for the onset of zygotic transcription in the Ciona germline and discuss the significance of germ plasm dislocation and remodeling in the context of developmental fate specification.

Keywords: Germline Specification; Lobe Scission; Primordial Germ Cells; Transcription Control; Tunicate.


Conflict of interest statement

The authors declare no competing interests.

Figures

Figure 1
Figure 1. B7.6 cells form a lobe including Pem-1 mRNA without nuclei.
(A) Expression of PGC marker genes, Pem-1 and MS4a15/2 detected by ISH probes corresponding to exons at the mid tailbud stage, St. 21. (B) Expression of MS4a15/2 at the late tailbud stage, St. 25. (C, C’) Expression of Pem-1 in lobe at the late tailbud stage, St. 25. C’ shows the blue channel of (C). (D) Schematic diagram of Ciona development from 64-cell stage, St. 8 to late tailbud stage, St. 23. Magenta shows DiI label. (EH’) Cell membranes of B7.6 cells were stained by DiI at the 64-cell stage, and images taken at the gastrula (E, E’) and the neurula stages (FH’). (E’, G’, H’) Blue channels of (E, G, H), respectively. (I, J) B7.6 cells were stained by spraying with BioTracker Membright 560 Dye (I), and the whole cell membrane was stained with BioTracker Membright 488 (J). Snapshots of Movies EV1 and EV2 are shown in time from left to right. (K, L) B7.6 cells were traced by DiI, and lobe was detected by ISH with a Pem-1 probe corresponding to exons. (L’) Green and blue channels of (L). (L”) Magenta and blue channels of (L). (MQ) DiI and Cytochalasin D were specifically sprayed at B7.6 cells, and lobe scission was observed and quantified as proportion of successful lobe scission based on the DiI staining (MQ), and the segregation of the Pem-1 mRNA was observed (P, Q). Data information: (O, Q) n means the number of embryos. Error bars indicate standard error. P value was calculated by z-test. P > 0.05; N.S, 0.05>P > 0.01; *, 0.01>P; **. (AC’) Scale bars are 10 μm. (EH’, KL’, M, N’, P) scale bars are 5 μm. Source data are available online for this figure.
Figure 2
Figure 2. RNA polymerase II Ser2 phosphorylation and Mef2 nascent expression in B7.6* cells.
(AC) Immunostaining for anti-RNAPII-CTD-pSer2 antibody was done at the late neurula; 8 hpf (A), the mid tailbud; 10 hpf (B) and the late tailbud; 12 hpf (C) stages. (D) Proportion of RNAPII-CTD-pSer2 positive B7.6* cells. (EE’) Nascent expression of Mef2 gene was detected by Mef2 intronic probes in 12 hpf embryos at 18 °C. White arrows indicate the dotted signals of nascent Mef2 expression in nuclei of B7.6* cells. White dotted circles show nuclei of B7.6* cells. (F) Mef2 intronic probe signals in nuclei in B7.6* cells. The proportion of signal positive nuclei was shown in y axis. Data information: (D, F) Error bars indicate standard error. n means the number of nuclei. (AC, E) Scale bars are 5 μm. Source data are available online for this figure.
Figure 3
Figure 3. Mef2 nascent expression in inhibitor-treated embryos.
(AD) ISH was done with Mef2 intronic probes under each pharmacological inhibitor treatment; DMSO (A), 3i (B), Ruxolitinib (C) and 3i+Ruxolitinib (D). White arrows show the dotted signals of nascent Mef2 expression. White arrowhead shows lobe in (B). (A’–D’) Magnification images of (AD). (A”–D”) Black and white images of the magenta channel of (A’D’), respectively. (E) Proportion of B7.6* cells with Mef2 signals in nuclei (y axis) under each pharmacological inhibitor treatment (x axis). (F) Proportion of B7.6* lineage cells in embryos (y axis) under each pharmacological inhibitor treatment. (x axis). (GJ) Immunostaining with anti-JAK2 antibody was done at the mid tailbud; 10 hpf (GH’) and the late tailbud; 12 hpf (IJ’) stages. Image G is the same as the image on S5B. (K) Proportion of embryos with JAK2-positive B7.6* cells (y axis). (L, M) ISH was done with Mef2 intronic probes under each pharmacological inhibitor treatment; DMSO (L) and Ruxolitinib (M) in 10 hpf embryos and quantified in (N). White arrows show the dotted signals of nascent Mef2 expression. (N) Proportion of Mef2-positive B7.6* nuclei showing either 1 or 2 dots (y axis) under each condition. (O) Proportion of cell numbers of B7.6* cells in embryos (y axis) under each condition. Data information: (E, F, K, N, O) Error bars indicate standard error. P value was calculated by z-test. P > 0.05; N.S, 0.05>P > 0.01; *, 0.01>P; **. Scale bars are 15 μm on (AD), 20 μm on (G, I) and 5 μm on (H, J, L, M). Source data are available online for this figure.
Figure 4
Figure 4. RNA polymerase II Ser2 phosphorylation in inhibitor-treated embryos.
(AC) Immunostaining was done with anti-RNAPII-CTD-pSer2 antibody under each pharmacological inhibitor treatment at 12 hpf. (D) Proportion of B7.6* cells with a positive signal of immunostaining with anti-RNAPII-CTD-pSer2 antibody in the nucleus (y axis) under each pharmacological inhibitor treatment. (E) Proportion of B7.6* cell numbers in embryos (y axis) under each pharmacological inhibitor treatment. (F) A schematic image for activity or presence of each factor in B7.6 and B7.6* cells based on this study and a previous report (Shirae-Kurabayashi et al, 2011). (G) Working scheme of onset of zygotic transcription in B7.6* cells. Data information: (D, E) Error bars indicate standard error. P value was calculated by z-test. P > 0.05; N.S, 0.05>P > 0.01; *, 0.01>P; **. (AC”) Scale bar is 5 μm. Source data are available online for this figure.

Similar articles

Cited by

References

    1. Abdu Y, Maniscalco C, Heddleston JM, Chew T-L, Nance J. Developmentally programmed germ cell remodelling by endodermal cell cannibalism. Nat Cell Biol. 2016;18:1302–1310. doi: 10.1038/ncb3439. - DOI - PMC - PubMed
    1. Anderson R, Copeland TK, Schöler H, Heasman J, Wylie C. The onset of germ cell migration in the mouse embryo. Mech Dev. 2000;91:61–68. doi: 10.1016/S0925-4773(99)00271-3. - DOI - PubMed
    1. Batchelder C, Dunn MA, Choy B, Suh Y, Cassie C, Shim EY, Shin TH, Mello C, Seydoux G, Blackwell TK. Transcriptional repression by the Caenorhabditis elegans germ-line protein PIE-1. Genes Dev. 1999;13:202–212. doi: 10.1101/gad.13.2.202. - DOI - PMC - PubMed
    1. Bensaude O. Inhibiting eukaryotic transcription: which compound to choose? How to evaluate its activity? Transcription. 2011;2:103–108. doi: 10.4161/trns.2.3.16172. - DOI - PMC - PubMed
    1. Bhartiya D, Anand S, Patel H, Parte S. Making gametes from alternate sources of stem cells: past, present and future. Reprod Biol Endocrinol. 2017;15:89. doi: 10.1186/s12958-017-0308-8. - DOI - PMC - PubMed