Randomized Controlled Trial
. 2024 Apr 22;15(1):3402.
doi: 10.1038/s41467-024-47463-6.

Multi-omics analysis reveals COVID-19 vaccine induced attenuation of inflammatory responses during breakthrough disease

Affiliations
Randomized Controlled Trial

Multi-omics analysis reveals COVID-19 vaccine induced attenuation of inflammatory responses during breakthrough disease

Ruth E Drury et al. Nat Commun. .

Abstract

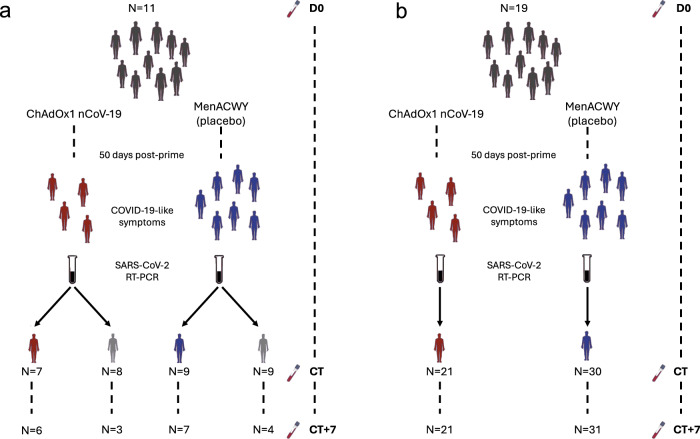
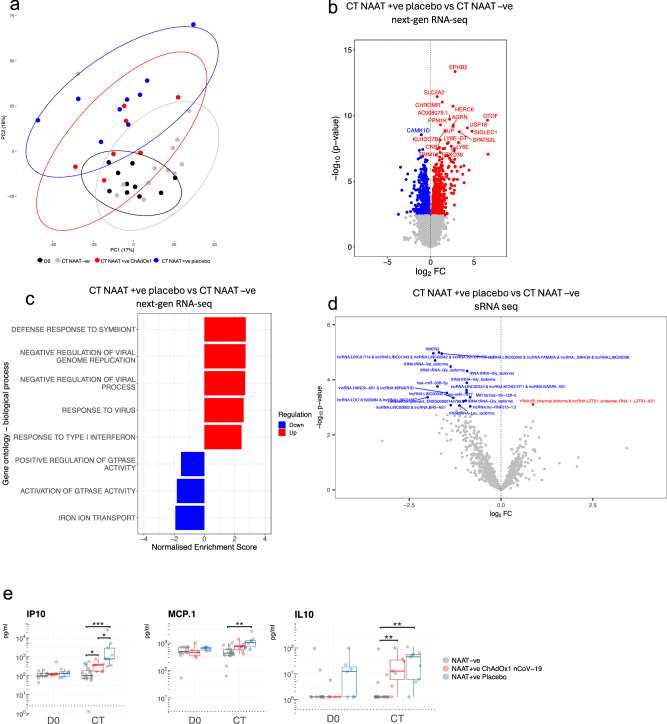
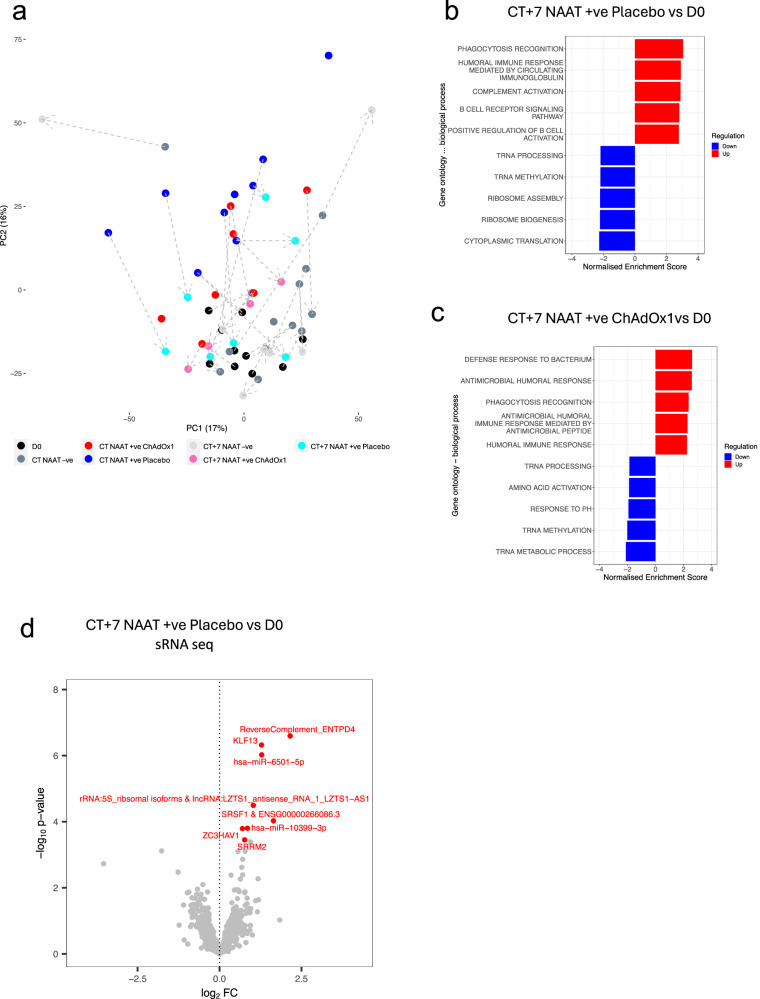
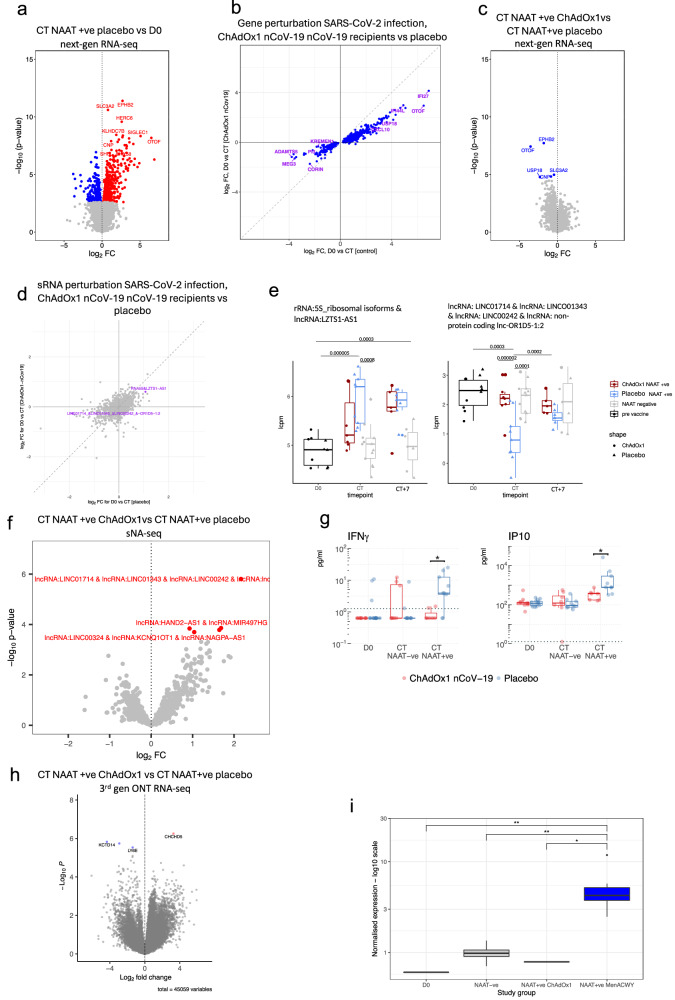
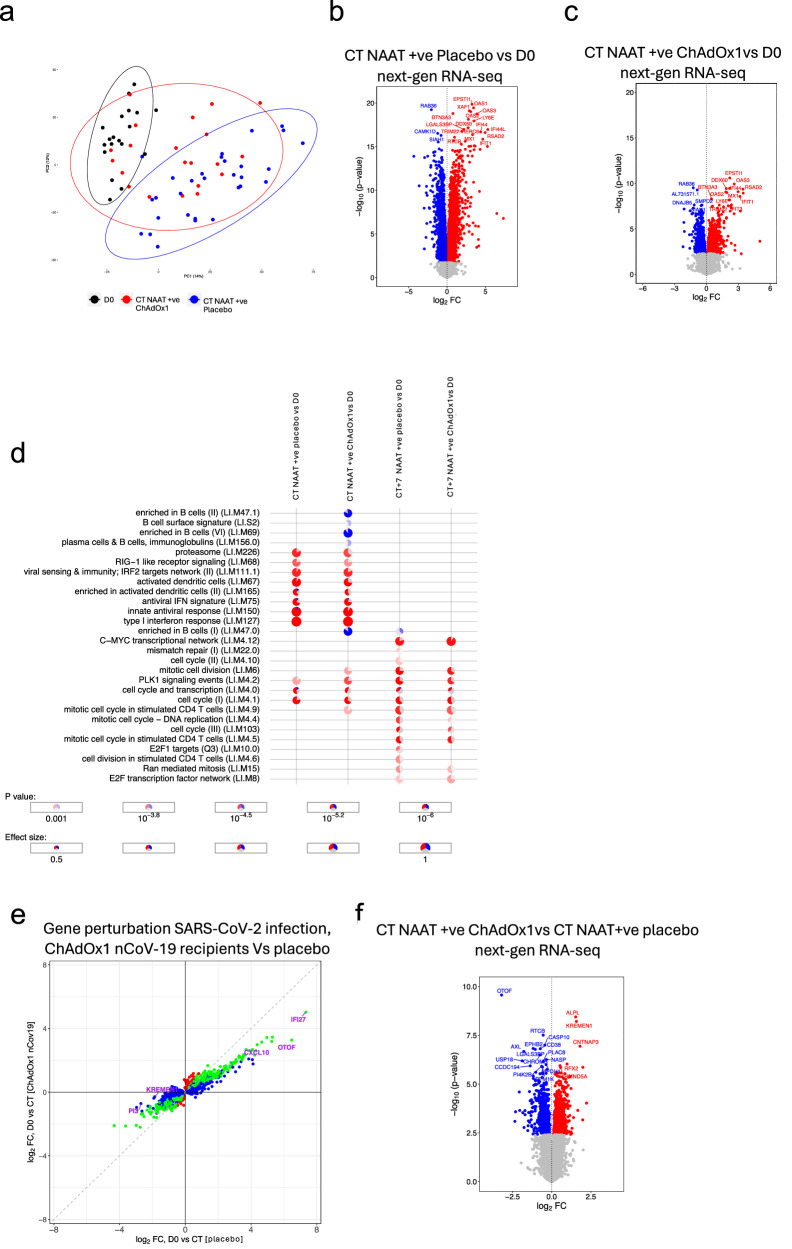
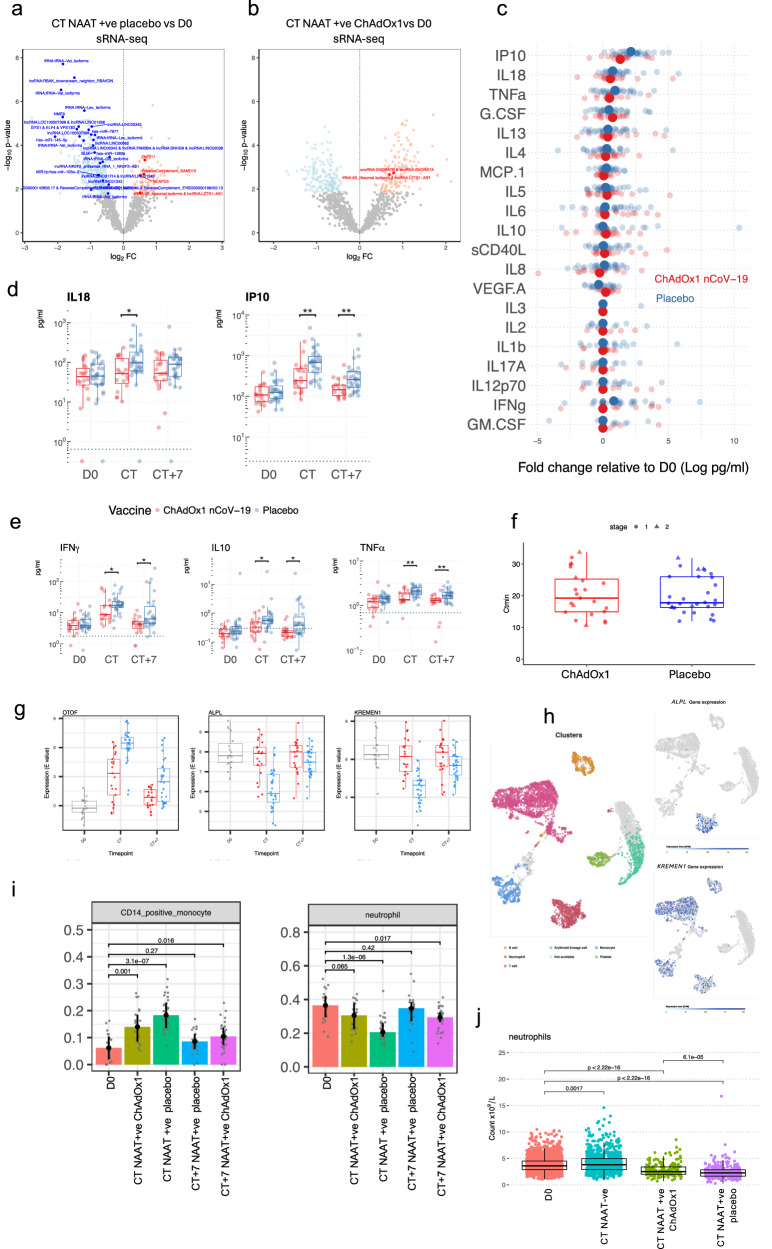
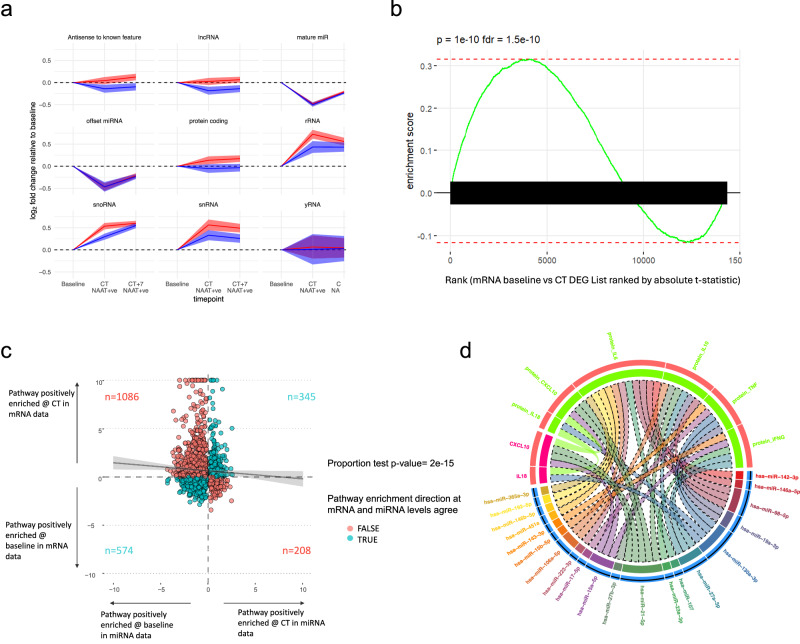
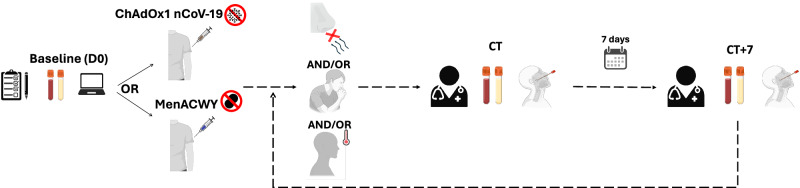
The immune mechanisms mediating COVID-19 vaccine attenuation of COVID-19 remain undescribed. We conducted comprehensive analyses detailing immune responses to SARS-CoV-2 virus in blood post-vaccination with ChAdOx1 nCoV-19 or a placebo. Samples from randomised placebo-controlled trials (NCT04324606 and NCT04400838) were taken at baseline, onset of COVID-19-like symptoms, and 7 days later, confirming COVID-19 using nucleic amplification test (NAAT test) via real-time PCR (RT-PCR). Serum cytokines were measured with multiplexed immunoassays. The transcriptome was analysed with long, short and small RNA sequencing. We found attenuation of RNA inflammatory signatures in ChAdOx1 nCoV-19 compared with placebo vaccinees and reduced levels of serum proteins associated with COVID-19 severity. KREMEN1, a putative alternative SARS-CoV-2 receptor, was downregulated in placebo compared with ChAdOx1 nCoV-19 vaccinees. Vaccination ameliorates reductions in cell counts across leukocyte populations and platelets noted at COVID-19 onset, without inducing potentially deleterious Th2-skewed immune responses. Multi-omics integration links a global reduction in miRNA expression at COVID-19 onset to increased pro-inflammatory responses at the mRNA level. This study reveals insights into the role of COVID-19 vaccines in mitigating disease severity by abrogating pro-inflammatory responses associated with severe COVID-19, affirming vaccine-mediated benefit in breakthrough infection, and highlighting the importance of clinically relevant endpoints in vaccine evaluation.


Conflict of interest statement

P.K. has received consultancy fees from AstraZeneca. S.C.G. is named as an inventor on the patent covering ChAdOx1 use as a vaccine vector and holds stock in Vaccitech. T.L. reports consulting fees from Vaccitech on an unrelated project, an honorarium from Seqirus, work-related investments, and is named as an inventor on a patent application for a vaccine against SARS-CoV-2. A.J.P. was a member of WHO’s Strategic Advisory Group of Experts on Immunization until January, 2022 and remains chair of the UK Department of Health and Social Care’s Joint Committee on Vaccination and Immunisation (JCVI) but does not participate in the JCVI COVID-19 committee; and reports providing advice to Shionogi on COVID-19, and funding from the NIHR, AstraZeneca, the Bill & Melinda Gates Foundation, Wellcome, the Medical Research Council, and the Coalition for Epidemic Preparedness Innovations. Oxford University has entered into a partnership with AstraZeneca for the development of COVID-19 vaccines.

Figures

Fig. 1
Fig. 1. Study overview and cohort description.
a Stage 1, symptomatic cohort: ChAdOx1 nCoV-19 vaccinees are shown in red. MenACWY vaccinees are placebo vaccinees (blue). NAAT+ve are participants with COVID-19, NAAT-ve are people who had COVID-19-like symptoms and thus had a CT visit but were subsequently shown not to have COVID-19 (grey); (b) Stage 2: all participants had COVID-19 (i.e. were NAAT+ve). D0: Baseline visit, before vaccination. CT: COVID-19 test visit. CT + 7: 7 days after CT visit.
Fig. 2
Fig. 2. Differential signatures and features in acute COVID-19 compared with symptomatic controls.
a Principal component analysis of blood RNA-seq transcriptome (next-gen RNA-seq) of study participants during symptomatic episodes consistent with COVID-19, with 95% confidence intervals ellipses. D0 n = 10, CT NAAT-ve n = 13, CT NAAT+ve ChAdOx1 nCoV-19 n = 7, CT NAAT+ve placebo n = 9. b Volcano plot comparing the next-gen RNA-seq blood transcriptome of NAAT+ve (placebo vaccine, n = 9) and NAAT–ve individuals at CT (n = 13). Blue = higher in NAAT-ve (FDR < 0.05), red = higher in NAAT+ve (FDR < 0.05). Differential expression analysis was performed using a two-sided moderate t test. c GSEA gene ontology biological process when comparing NAAT+ve (placebo vaccine, n = 9) compared with NAAT-ve individuals (n = 13) at CT. d Volcano plot comparing the small RNA-seq blood transcriptome of NAAT+ve (placebo vaccine, n = 9) and symptomatic NAAT-ve individuals (n = 13) at CT. Blue = higher in at NAAT-ve (FDR < 0.05), red = higher in NAAT+ve (FDR < 0.05). Differential expression analysis was performed using a two-sided moderate t test. e Serum cytokine levels measured at baseline (D0, paired samples from NAAT-ve n = 11, NAAT+ve ChAdOx1 nCoV−19 n = 5, NAAT+ve placebo n = 7) and CT (NAAT-ve n = 17, NAAT+ve ChAdOx1 nCoV-19 n = 7, NAAT+ve placebo n = 9). Each dot represents a volunteer. The centre line denotes the median value (50th percentile, Q2), the box contains the 25th (Q1) to 75th (Q3) percentiles of dataset. The whiskers mark the Q1 – 1.5*IQR and Q3 + 1.5*IQR. Dashed line represents limit of detection. Values below the limit of detection were assigned a value of half the limit of detection. P values were derived from a two-sided unpaired Wilcoxon tests. Multiple testing correction was applied using the Benjamini-Hochberg method with an FDR < 0.05 deemed significant. Source data are provided as a Source Data file.
Fig. 3
Fig. 3. Signatures of COVID-19 response seven days after symptoms onset.
a Principal component analysis of blood RNA-seq transcriptome (next-gen RNA seq) of study participants before and around symptomatic episode consistent with COVID-19. The dashed arrows connect the different time points from the same participants; the direction of the arrows is pointing towards the latter time point. D0 n = 10, CT NAAT-ve n = 13, CT NAAT+ve ChAdOx1 nCoV-19 n = 7, CT NAAT+ve placebo n = 9, CT + 7 NAAT-ve n = 7, CT + 7 NAAT+ve ChAdOx1 nCoV-19 n = 5, CT + 7 NAAT+ve placebo n = 7. b GSEA gene ontology biological process at CT + 7 in NAAT+ve placebo vaccinated individuals (n = 7) compared with baseline placebo samples (n = 10). c GSEA gene ontology biological process at CT + 7 NAAT+ve (ChAdOx1 nCoV-19) individuals (n = 5) compared with baseline (D0) samples (n = 10). d Volcano plot comparing the small RNA-seq blood transcriptome at CT + 7 in NAAT+ve placebo vaccinated individuals (n = 7) compared with baseline (D0) samples (n = 10). Blue = downregulated at CT + 7 (FDR < 0.05), red = upregulated at CT + 7(FDR < 0.05). The top 20 differentially expressed genes — ranked by FDR— are labelled, with the omission of overlapping labels. Differential expression analysis was performed using a two-sided moderate t-test. Source data are provided as a Source Data file.
Fig. 4
Fig. 4. Attenuated response to SARS-CoV-2 infection in ChAdOx1 nCoV-19 vaccinees.
a Volcano plot comparing next-gen RNA-seq blood transcriptome at CT in NAAT+ve (placebo vaccine) with baseline samples. Blue = downregulated at CT, red = upregulated at CT. b Agreement plot of differentially expressed genes at CT in NAAT+ve individuals in Placebo (x-axis) and ChAdOx1 nCoV-19 (y-axis) vaccinees compared with baseline. c Volcano plot comparing the next-gen RNA-seq blood transcriptome at COVID-19 onset in ChAdOx1 nCoV-19 vaccinees compared with placebo vaccinees. d Agreement plot of small RNA-seq differentially expressed genes at CT in NAAT+ve individuals in Placebo (x-axis) and ChAdOx1 nCoV-19 (y-axis) vaccinees compared with baseline. Coloured features differentially expressed in placebo arm (FDR < 0.05). e Boxplots of sRNA features differentially expressed (FDR < 0.05) between baseline and CT in the placebo vaccine group. Y-axis shows unadjusted p values. f Volcano plot comparing the small RNA-seq blood transcriptome at COVID-19 onset (NAAT +ve CT) in ChAdOx1 nCoV-19 vaccinees compared with placebo vaccinees. Red = higher in placebo group. g Serum cytokine levels measured at D0 (paired samples NAAT+ve ChAdOx1 nCoV-19 n = 5, NAAT+ve placebo n = 7) and symptom onset in Placebo (NAAT-ve n = 9, NAAT+ve n = 9) and ChAdOx1 nCoV-19 (NAAT-ve n = 8, NAAT+ve n = 7) vaccinees. Dashed line represents limit of detection. P values were derived from two-sided unpaired Wilcoxon tests. h Volcano plot comparing the 3rd gen ONT RNA-seq blood transcriptome COVID-19 onset (NAAT+ve CT) in ChAdOx1 nCoV-19 vaccinated participants compared with placebo vaccinees; 45,231 transcripts included in total. i MX1 ENST00000288383 transcript (MX1-201 isoform) expression across the study groups. Group sizes: D0 n = 10, CT NAAT-ve n = 13, CT NAAT+ve ChAdOx1 nCoV-19 n = 7, CT NAAT+ve placebo n = 9. Statistics: Unless otherwise stated above, differential gene expression analyses were performed using a two-sided moderated t test. Multiple testing correction applied to all differential expression analyses using the Benjamini-Hochberg method with an FDR < 0.05 deemed significant; *=FDR < 0.05, **=FDR < 0.01. Box plots: the centre line denotes the median value, the box contains the 25th (Q1) to 75th (Q3) percentiles of dataset. Whiskers mark the Q1 – 1.5*IQR and Q3 + 1.5*IQR. Source data are provided as a Source Data file.
Fig. 5
Fig. 5. Signatures of COVID-19 response from transcriptomics in larger cohort of NAAT+ participants.
a Principal component analysis of blood RNA-seq transcriptome (next-gen RNA-seq) of study participants before (D0, n = 19) and at the time of COVID-19 (CT NAAT+ve ChAdOx1 nCoV-19 n = 21, CT NAAT+ve placebo n = 30). b Volcano plot comparing the next-gen RNA-seq blood transcriptome at COVID-19 onset (CT NAAT+ve), placebo vaccinees (n = 30) compared with baseline (D0, n = 19) samples. Blue = downregulated at CT (FDR < 0.05), red = upregulated at CT (FDR < 0.05). Differential expression analysis was performed using a two-sided moderate t test. c Volcano plot comparing the next-gen RNA-seq blood transcriptome at COVID-19 onset (CT NAAT+ve) in ChAdOx1 nCoV-19 vaccinees (n = 21) compared with baseline (D0, n = 19) samples. Blue = downregulated at CT (FDR < 0.05), red = upregulated at CT(FDR < 0.05). Differential expression analysis was performed using a two-sided moderate t test. d Blood transcriptional modules (BTM) enriched during COVID-19 compared with baseline. Enriched BTMs (FDR < 0.001) are displayed. Segments of the pie charts represent the proportion of upregulated (red) and downregulated (blue) genes (absolute fold change >1.25). Enrichment P values were derived from a hypergeometric test, after adjustment for multiple testing (Benjamini and Hochberg’s method). e Agreement plot of differentially expressed genes at CT NAAT+ve in individuals in Placebo (x-axis, n = 30) and ChAdOx1 nCoV-19 (y-axis, n = 21) vaccine recipients compared with baseline (D0, n = 19). f Volcano plot comparing the next-gen RNA-seq blood transcriptome at CT NAAT+ve in individuals who received the ChAdOx1 nCoV-19 vaccine (n = 21) compared with individuals who received a placebo vaccine (n = 30). Blue = higher in placebo group (FDR < 0.05), red = higher in ChAdOx1 nCoV-19 group (FDR < 0.05). Differential expression analysis was performed using a two-sided moderate t test. Source data are provided as a Source Data file.
Fig. 6
Fig. 6. Dissecting attenuation of the response in vaccines.
Volcano plot comparing the small RNA-seq blood transcriptome at CT NAAT+ve (placebo, n = 30) (a) and at CT NAAT+ve in ChAdOx1 nCoV-19 vaccinees (n = 21) (b) compared with baseline (D0, n = 19) samples (blue downregulated FDR < 0.05, red upregulated FDR < 0.05, bold p < 0.05 in stage 1 data). Differential expression analysis was performed using a two-sided moderate t test. Serum cytokine levels measured by Luminex (c, d) and MSD (e) in paired samples from NAAT+ve ChAdOx1-nCoV-19 (n = 18 D0, n = 19 CT and CT + 7, red) and NAAT+ve placebo (n = 31 D0 and CT, n = 30 CT + 7, blue). c Fold-change in cytokines at symptom onset relative to baseline. Solid dots represent mean fold-change, translucent dots represent individual volunteers. d, e Boxplots describing representative concentrations of cytokines. Statistical significance assessed based on FDR from two-sided unpaired Wilcoxon tests. Dashed line represents limit of detection. f Minimum cycle threshold (Ctmin) values of RT-PCR for the COVID-19 episode in placebo and ChAdOx1 nCoV-19 vaccine recipients, two-sided Wilcoxon test, p = 0.79 for stage 1 (ChAdOx1 nCoV-19 n = 5, placebo n = 6), p = 0.93 for stage 2 (ChAdOx1 nCoV-19 = 18, placebo n = 24); p = 0.93 overall. g Top three genes differentially regulated, by p value, during COVID-19 in ChAdOx1-nCoV-19 vaccinees (red, CT n = 21, CT + 7 n = 21) compared with placebo vaccine recipients (blue, CT n = 21, CT + 7 n = 31). h RNA-sequencing data from single cell expression atlas (https://www.ebi.ac.uk/gxa/sc/experiments/E-MTAB-9221/) showing clusters by cell identity and expression of ALPL and KREMEN1 in cell clusters. i Estimated cell abundance from RNA-seq data derived from CibersortX at baseline (D0, n = 19) and in NAAT+ve participants at CT (ChAdOx1 nCoV-19 n = 21, placebo n = 30) and CT + 7 (ChAdOx1 nCoV-19 n = 21, placebo n = 31). Bar denotes the median value. j Absolute neutrophil counts measured at baseline (n = 2276), and at CT in NAAT+ve (ChAdOx1 nCoV-19 vaccinees n = 190, placebo vaccinees n = 327) and NAAT-ve (n = 835) participants. Multiple testing applied in differential gene and protein analyses using the Benjamini-Hochberg method (*FDR < 0.05, **FDR < 0.01). Boxplot (dg, j) boxes contain 25th to 75th percentiles of dataset, with central lines representing medians. Whiskers mark 1.5x the inter-quantile range (IQR). Each dot represents one volunteer. Source data are provided as a Source Data file.
Fig. 7
Fig. 7. sRNA expression and post-transcriptional regulation of COVID-19 responses.
a Class-wise changes in sRNA expression over time relative to baseline. Y-axis represents mean log2 foldchange of sRNA features within each sRNA class. 95% confidence intervals shown in shaded area. b Gene set enrichment result for the set of mRNAs targeted by miRNAs downregulated at CT. mRNAs ranked by t-statistic based on differential expression gene expression analysis comparing baseline with CT. P value derived from a GSEA analysis computed via the MIEA2 web-program which uses a two-sided Kolmogorow–Smirnow test and performs multiple testing correction. c Agreement plot for GO:BP term enrichment in the mRNA and miRNA data. Each dot is a pathway. The x-axis shows the log10 of the p-value of the pathway enrichment in the miRNA data. The y-axis shows the log10 of the p-value of the pathway enrichment in the mRNA data multiplied by the enrichment sign ( + 1 if positive, −1 if negative). Colour indicates whether the sign of miRNA and mRNA enrichment results for a pathway agree (blue) or disagree (red). The numbers of pathways in each quadrant is shown on the plot. The line of best fit is shown in black with 95% confidence intervals in grey. Spearman rank (two-tailed) r = −0.04, p = 0.001. d Chord plot showing the cross-over between differentially expressed proteins (bright green) and mRNAs (multi-coloured), and the miRNAs (bright pink) that target them at NAAT+ve CT vs baseline in the placebo group. Track 1 (Outermost track) = feature name, track 2 = whether that feature was up (red) or downregulated (blue) at CT in NAAT+ve placebo vaccinees compared with baseline, track 3 = colour bar for that feature/feature type. The length of the feature bar corresponds to the number of links the feature has with other features. Linking lines (“chords”) represent a connection between features. Links drawn between mRNA and their protein counterparts. miRNAs are connected to their targets. Links with dotted edges connect features with opposite directions of foldchange. Links without dotted edges connect features with the same direction of foldchange. Source data are provided as a Source Data file.
Fig. 8
Fig. 8. Visit schema. Baseline visit (D0) involved assessment, enrolment and blood sampling.
Participants were then vaccinated with either ChAdOx1 nCoV-19 or placebo vaccine (MenACWY). Participants with at least one of: loss of smell or tase, continuous cough or fever attended the study site for a CT visit (COVID-19 test visit) at symptom onset for assessment, a COVID-19 NAAT test (RT-PCR test) and blood sampling. Participants presented again 7 days later (CT + 7) for repeat study procedures regardless of COVID-19 test result. Participants then returned to normal follow up until their next set of symptoms. Created with BioRender.com.

References

    1. Watson, O. J. et al. Global impact of the first year of COVID-19 vaccination: a mathematical modelling study. Lancet Infect Dis. 10.1016/S1473-3099(22)00320-6 (2022). - PMC - PubMed
    1. World Health Organization. WHO Coronavirus (COVID-19) Dashboard, https://covid19.who.int/ (2023).
    1. Honda-Okubo Y, et al. Severe acute respiratory syndrome-associated coronavirus vaccines formulated with delta inulin adjuvants provide enhanced protection while ameliorating lung eosinophilic immunopathology. J Virol. 2015;89:2995–3007. doi: 10.1128/JVI.02980-14. - DOI - PMC - PubMed
    1. Liu, L. et al. Anti-spike IgG causes severe acute lung injury by skewing macrophage responses during acute SARS-CoV infection. JCI Insight4. 10.1172/jci.insight.123158 (2019). - PMC - PubMed
    1. Shinde V, et al. Efficacy of NVX-CoV2373 Covid-19 Vaccine against the B.1.351 variant. N. Engl. J. Med. 2021;384:1899–1909. doi: 10.1056/NEJMoa2103055. - DOI - PMC - PubMed

Publication types

Supplementary concepts

LinkOut - more resources