. 2024 Apr 22;15(1):3413.
doi: 10.1038/s41467-024-47602-z.

Biomolecular condensates form spatially inhomogeneous network fluids

Affiliations

Biomolecular condensates form spatially inhomogeneous network fluids

Furqan Dar et al. Nat Commun. .

Abstract

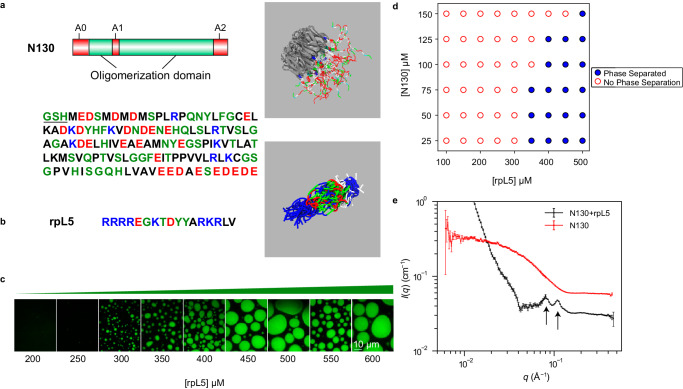
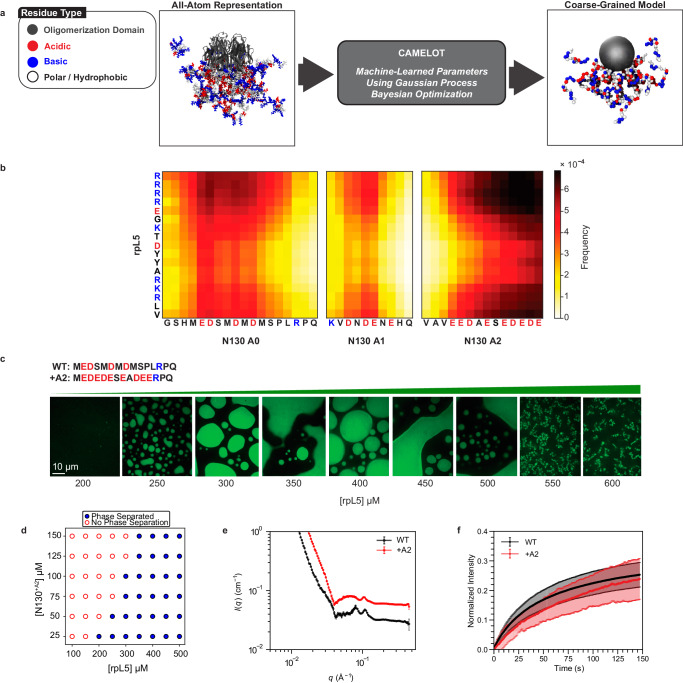
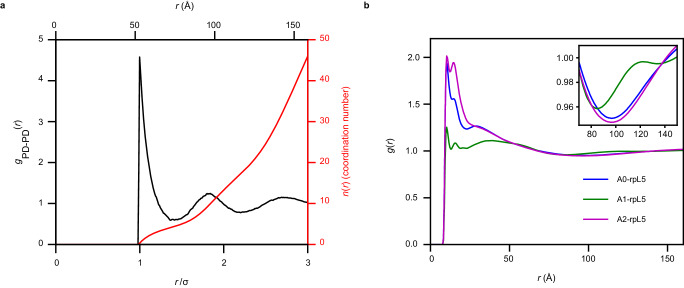
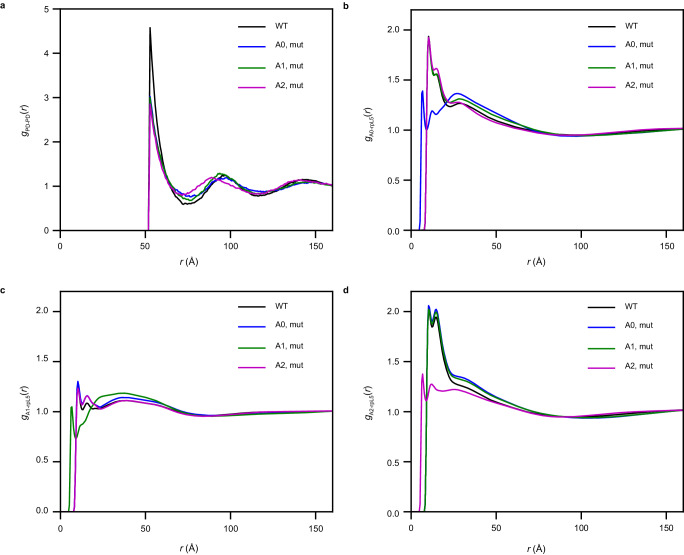
The functions of biomolecular condensates are thought to be influenced by their material properties, and these will be determined by the internal organization of molecules within condensates. However, structural characterizations of condensates are challenging, and rarely reported. Here, we deploy a combination of small angle neutron scattering, fluorescence recovery after photobleaching, and coarse-grained molecular dynamics simulations to provide structural descriptions of model condensates that are formed by macromolecules from nucleolar granular components (GCs). We show that these minimal facsimiles of GCs form condensates that are network fluids featuring spatial inhomogeneities across different length scales that reflect the contributions of distinct protein and peptide domains. The network-like inhomogeneous organization is characterized by a coexistence of liquid- and gas-like macromolecular densities that engenders bimodality of internal molecular dynamics. These insights suggest that condensates formed by multivalent proteins share features with network fluids formed by systems such as patchy or hairy colloids.


Conflict of interest statement

R.V.P. is a member of the scientific advisory board and shareholder of Dewpoint Therapeutics Inc. D.M.M. is an employee and shareholder of Dewpoint Therapeutics. The work reported here was not influenced by these affiliations. The remaining authors have no competing interests to declare.

Figures

Fig. 1
Fig. 1. Complexation between acidic regions within N130 and R-motifs of rpL5 is required for condensation.
a Schematic representation of N130 including the different acidic regions. The amino acid sequence of N130 is also shown. The three acidic regions A0, A1, and A2 span residues 4–18, 35–44, and 120–133, respectively. Non-native N-terminal residues that remain after protease cleavage are underlined. On the right, we show the overall structure of the hairy colloid generated by superposition of 50 distinct conformations from atomistic simulations. These simulations use the ABSINTH implicit solvent model and explicit representations of solution ions (which are not shown in the figure). The pentamerized OD (PDB ID 4N8M), in gray, was modeled as a rigid molecule in the atomistic simulations. b The amino acid sequence of rpL5. The panel on the right shows a superposition of 50 different conformations extracted from ABSINTH-based simulations. c Confocal microscopy images of phase separation of 100 µM N130 upon titrating the concentration of rpL5 in buffer and 150 mM NaCl. N130 is labeled with AlexaFluor488. Microscopy experiments were repeated in three independent experiments with similar results. d Two-component phase boundary for N130 + rpL5, showing the result of concentration titrations. e SANS curve showing the intensity I(q) plotted against q, the scattering vector, for condensates formed by a solution of N130 (200 µM): rpL5 at 1:3 stoichiometry. Multi-peak analysis, as described by Mitrea et al., leads to the identification of two major peaks corresponding to 55 Å (right arrow) and 77 Å (left arrow) that are annotated on the figure. The SANS curve for N130 pentamers, in the absence of rpL5, is shown for comparison. In the interest of clarity, this curve is shifted upwards vis-à-vis the curve for the N130 + rpL5 system. We computed the scattering curve for individual N130 pentamers. These computed profiles show qualitative resemblance to the SANS curve shown here for N130 pentamers (see Supplementary Fig. 1). The error bars are propagated through each of the SANS data reduction steps, described and cited in the Methods. Intensity data are binned and circularly averaged to convert the 2D detector data into I(q) data, from which we calculate uncertainty values at each value of q. The data correspond to a single measurement (n=1).
Fig. 2
Fig. 2. Coarse-grained simulations of N130 + rpL5 condensates highlight the importance of an N-terminal acidic region (A0) within N130.
a Coarse-graining procedure for N130 and rpL5 systems. To generate sequence- and system-specific CG models for N130 and rpL5 peptides, we start with atomistic Monte Carlo simulations of individual molecules that are based on the ABSINTH implicit solvation model and forcefield paradigm. Ions are modeled explicitly in these simulations. We then prescribe a CG model for the system. Here, the residues of the PD are collectively modeled as one large bead depicted in gray. Next, for regions outside the PD, the residues are single beads, and the bead types are organized into three groups: 1: E,K,R,D; 2: V,F,M,I,L,Y,Q,N,W,H; and 3: A,P,G,S,T,C, respectively. To determine the optimal interaction parameters for the CG model, we used the CAMELOT algorithm. b Bead-to-bead contact maps from coarse-grained simulations of dense phases comprising a 1:3 ratio of N130 and rpL5. The A1 and A2 regions interact favorably with rpL5 peptides. The contact maps reveal interactions involving a region we refer to as A0. c Confocal microscopy images of phase separation at a fixed concentration of N130+A2 upon titrating with rpL5. The A0 tract in the wild type is replaced with the reversed sequence of the A2 tract. Microscopy experiments were repeated in three independent experiments with similar results. d Two-component phase boundary for N130+A2 + rpL5, showing the result of concentration titrations. e Comparative SANS curves for the WT N130 + rpL5 and +A2 mutant + rpL5. SANS data were collected with 200 µM N130 and 600 µM rpL5. For clarity, the curve for N130+A2 + rpL5 is shifted upwards. The data correspond to a single measurement (n=1), with the error bars calculated as in Fig. 1e. f FRAP curves for the condensates containing N130 and N130+A2. FRAP curves were collected at 100 µM N130 and 400 µM rpL5 with 12 replicates (n=12). Error bars represent the standard deviation of the mean.
Fig. 3
Fig. 3. Radial distribution functions point to network fluid structure of N130 + rpL5 condensates.
a Radial distribution function gPD-PD(r) in black and nPD-PD(r) in red quantifying the correlations between N130 PDs in the simulated N130 + rpL5 system. There are local maxima at 53 Å, 95 Å, and 144 Å. On average, approximately four PDs are found within the first coordination shell. b Radial distribution functions g+–(r) quantifying the correlations between positive charges in rpL5 and negative charges in acidic regions of N130. The inset shows a zoom in to troughs in g(r) in a spatial range between 75 Å and 140 Å that is between 1.5σ and 2.5σ, where σ is the diameter of the N130 PD. Averages were calculated over five replicates (n=5).
Fig. 4
Fig. 4. Interactions between acidic regions and rpL5 are modular and independent of one another.
a gPD-PD(r) computed after neutralizing the charges in each of the acidic regions indicated in the legend. b gA0-rpL5(r) quantifies the pair correlations between acidic residues in A0 and basic residues in rpL5. Results are shown for the WT (black), when acidic residues are neutralized in A0 (blue), A1 (green), and A2 (magenta). Neutralizing charges within A0 weakens the interactions between A0 and rpL5. However, neutralizing the charges within A1 and A2 does not significantly affect the interactions between A0 and rpL5. c gA0-rpL5(r) quantifies the pair correlations between acidic residues in A1 and basic residues in rpL5. Results are shown for the WT (black), when acidic residues are neutralized in A0 (blue), A1 (green), and A2 (magenta). Neutralizing charges within A1 weakens the interactions between A1 and rpL5 (green curve). However, neutralizing the charges within A0 and A2 does not significantly affect the interactions between A1 and rpL5. d gA2-rpL5(r) quantifies the pair correlations between acidic residues in A2 and basic residues in rpL5. Results are shown for the WT (black), when acidic residues are neutralized in A0 (blue), A1 (green), and A2 (magenta). Neutralizing charges within A2 weakens the interactions between A2 and rpL5 (magenta curve). However, neutralizing the charges within A0 and A1 does not significantly affect the interactions between A2 and rpL5. In all cases, averages were calculated over five replicates (n=5).
Fig. 5
Fig. 5. Flowchart describing the graph-theoretic analysis of simulations of dense phases of N130 and rpL5.
We start by selecting a set of residues of interest. As an illustrative example, we pick the acidic residues in N130 and the basic residues in rpL5. To determine an edge, we compute the g(r) between sets of beads where the first minimum serves as the distance cutoff for bead adjacency. Given this cutoff, we construct the bead-to-bead adjacency matrices. The system includes the N130 PD. Performing appropriate block summations of the bead-to-bead adjacency matrix generates the molecular adjacency matrix. The latter is analyzed using standard graph-theoretic analyses. As an example, a random embedding is shown where the size of a node corresponds to the degree of centrality of that node.
Fig. 6
Fig. 6. Each acidic region of N130 in the N130 + rpL5 dense phase imparts a different network structure onto the system.
a Degree distributions, P(k), for pure LJ systems. Because the density of the vapor ρ=0.01,T=1.000 is low, the most likely degree is zero. For the liquid ρ=0.80,T=1.000, the degree distribution shifts towards higher values with a mean around twelve, where the widths of the distribution correspond to the inherent variation in the number of bonds that particles can make in the locally spatially inhomogeneous environment of a liquid. For the solid ρ=1.5,T=0.758, the degree distribution is peaked at twelve. Note that we use reduced units for density and temperature. b Degree distributions, P(k), for the complementary charge interactions between the different acidic regions of N130 and the rpL5 peptides. Unlike the graphs in a, the distributions display bimodality, which is an indication of a bipartite graph. Consistent with the radial distribution functions in Fig. 3, we see that A2 has the largest degrees, followed by A0 and A1. In all cases, averages were calculated across five replicates (n=5).
Fig. 7
Fig. 7. Motions within dense phases of N130 + rpL5 show bimodality.
a MSD of the PD plotted against the lag time shows that N130 has super-diffusive and sub-diffusive regimes. Here, the abscissa is a unitless parameter t′ = t/tD where tD is the timescale over which the motion of the PD is purely diffusive. The red region in the panel indicates the timescales that fit best to purely diffusive motion. There is a timescale below tD where the motion is super-diffusive and a timescale above tD where the motion is sub-diffusive, with the regimes and corresponding exponents indicated in the panel. b Histograms of the exponents calculated for the mean square displacements of individual PDs. The bimodal distribution reflects the presence of super-diffusive and sub-diffusive regimes. Negative exponents result from uncertainty regarding the long-time behavior of the MSDs. c MSDs of the PD and charged residues in each of the acidic regions and the rpL5 peptides. In contrast to the PD, the acidic regions and the peptides show only sub-diffusive motions on all timescales. In all cases, averages were calculated over five replicates (n=5).

Update of

References

    1. Banani SF, Lee HO, Hyman AA, Rosen MK. Biomolecular condensates: organizers of cellular biochemistry. Nat. Rev. Mol. Cell Biol. 2017;18:285–298. doi: 10.1038/nrm.2017.7. - DOI - PMC - PubMed
    1. Brangwynne CP, et al. Germline P granules are liquid droplets that localize by controlled dissolution/condensation. Science. 2009;324:1729–1732. doi: 10.1126/science.1172046. - DOI - PubMed
    1. Brangwynne CP, Mitchison TJ, Hyman AA. Active liquid-like behavior of nucleoli determines their size and shape in Xenopus laevis oocytes. PNAS. 2011;108:4334–4339. doi: 10.1073/pnas.1017150108. - DOI - PMC - PubMed
    1. Feric M, et al. Coexisting liquid phases underlie nucleolar subcompartments. Cell. 2016;165:1686–1697. doi: 10.1016/j.cell.2016.04.047. - DOI - PMC - PubMed
    1. Shin Y, et al. Spatiotemporal control of intracellular phase transitions using light-activated optoDroplets. Cell. 2017;168:159–171.e114. doi: 10.1016/j.cell.2016.11.054. - DOI - PMC - PubMed

Publication types

MeSH terms