. 2024 Jul;21(7):1306-1315.
doi: 10.1038/s41592-024-02245-2. Epub 2024 Apr 22.

Virtual reality-empowered deep-learning analysis of brain cells

Affiliations

Virtual reality-empowered deep-learning analysis of brain cells

Doris Kaltenecker et al. Nat Methods. 2024 Jul.

Abstract

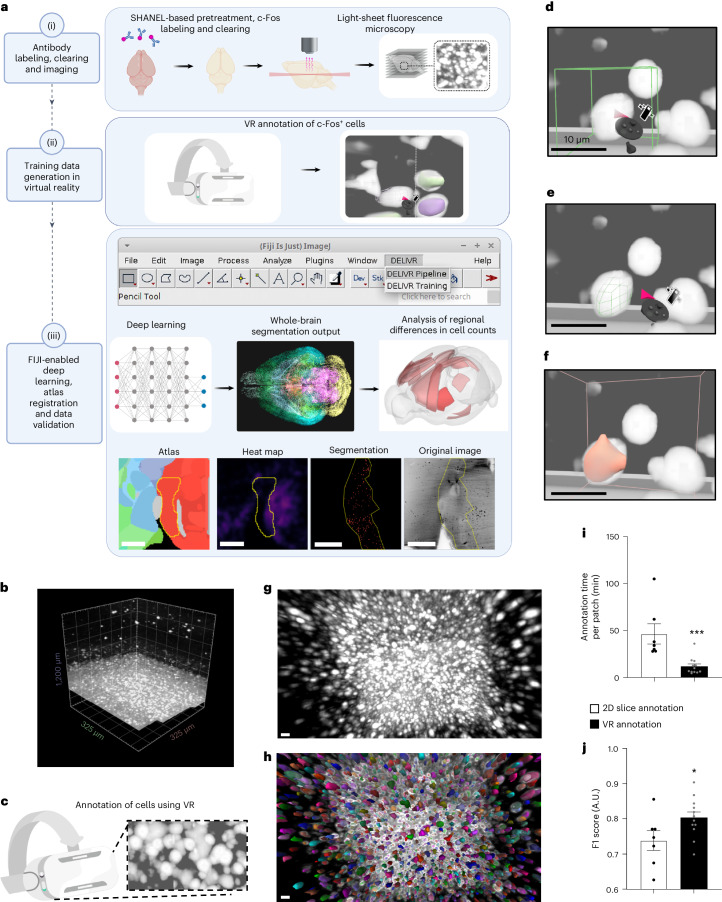
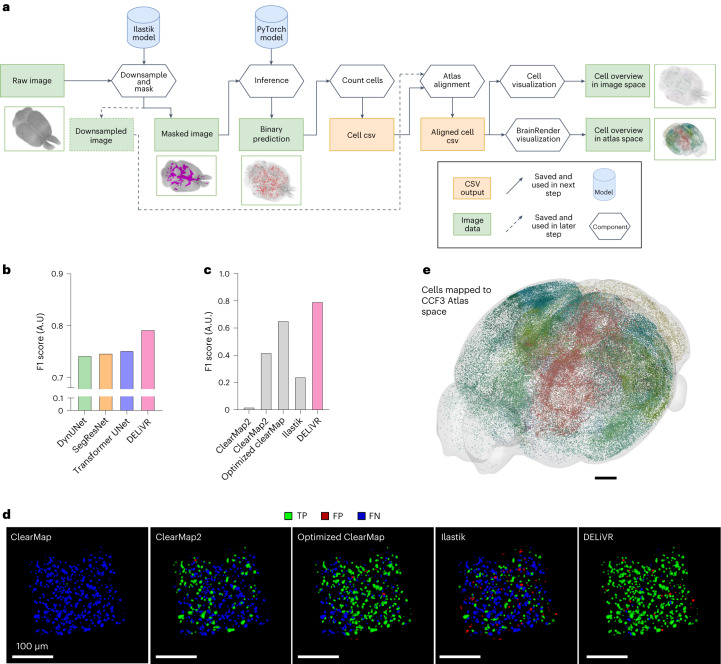
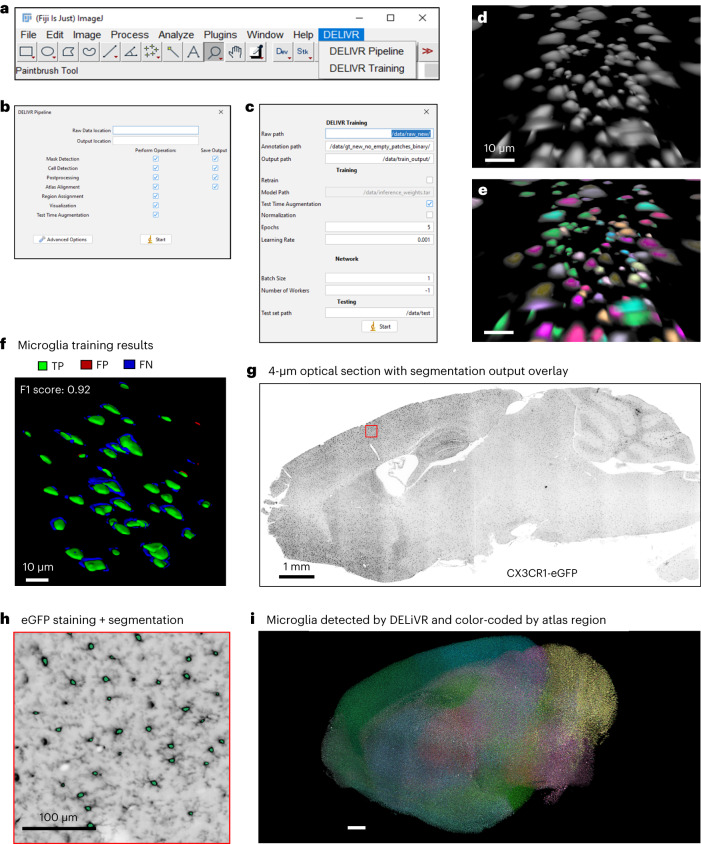
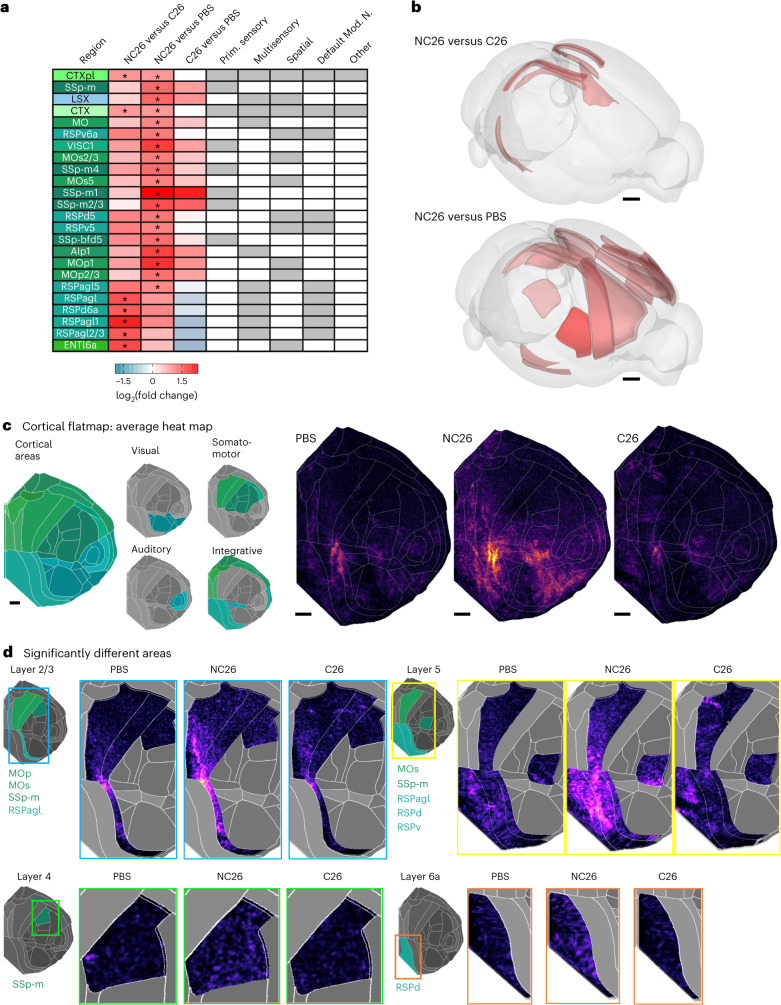
Automated detection of specific cells in three-dimensional datasets such as whole-brain light-sheet image stacks is challenging. Here, we present DELiVR, a virtual reality-trained deep-learning pipeline for detecting c-Fos+ cells as markers for neuronal activity in cleared mouse brains. Virtual reality annotation substantially accelerated training data generation, enabling DELiVR to outperform state-of-the-art cell-segmenting approaches. Our pipeline is available in a user-friendly Docker container that runs with a standalone Fiji plugin. DELiVR features a comprehensive toolkit for data visualization and can be customized to other cell types of interest, as we did here for microglia somata, using Fiji for dataset-specific training. We applied DELiVR to investigate cancer-related brain activity, unveiling an activation pattern that distinguishes weight-stable cancer from cancers associated with weight loss. Overall, DELiVR is a robust deep-learning tool that does not require advanced coding skills to analyze whole-brain imaging data in health and disease.


Conflict of interest statement

A.E. is a co-founder of Deep Piction. The remaining authors declare no competing interests related to this work.

Figures

Fig. 1
Fig. 1. Virtual reality-aided annotation is faster than 2D-slice annotation.
a, Summary of VR-aided deep learning for antibody-labeled cell segmentation in mouse brains. (i) Fixed mouse brains are subjected to SHANEL-based antibody labeling, tissue clearing and fluorescent light-sheet imaging. (ii) Volumes of raw data are labeled in VR to generate reference annotations. (iii) The DELiVR pipeline was packaged in a Docker container, controlled via a Fiji plugin. DELiVR segments cells using deep learning and registers them to the Allen Brain Atlas. DELiVR produces per-region cell counts and generates visualizations with all detected cells color coded by atlas region. b, Patch volume of raw data (c-Fos-labeled brain imaged with LSFM) and loaded into Arivis VisionVR. Volume size represents 2003 voxel, rendered isotropically. c, Illustration of VR goggles and VR zoomed-in view of the same data as in b. df, Using Arivis VisionVR, individual cells were annotated by placing a selection cube on the cell (d), fitting the cube to the size of the cell (e) and filling (f). Scale bar, 10 µm. g,h, Zoomed-in view of raw data (same volume as in b) (g) and annotation overlay generated in VR (h). Scale bar, 10 µm. i, Time spent for annotating a test patch using 2D-slice (n = 7) and VR annotation (n = 12 with n = 6 annotations performed with Arivis VisonVR and n = 6 annotations performed with syGlass). Data are presented as mean ± s.e.m. ***P = 0.0005, two-sided Mann–Whitney U-test. j, Instance Dice of 2D-slice annotation (n = 7) versus VR annotation (n = 12 with n = 6 annotations performed with Arivis VisonVR and n = 6 annotations performed with syGlass). Data are presented as mean ± s.e.m. *P = 0.0445, two-sided unpaired t-test. A.U., arbitrary units. Source data
Fig. 2
Fig. 2. DELiVR’s UNet outperforms current methods for c-Fos+ cell detection.
a, Scheme of the DELiVR inference pipeline. All components are packaged in a single Docker container. Raw image stacks serve as input. They are downsampled for atlas alignment and optionally masked (to exclude detection on ventricles). The masked images are then passed on to deep-learning cell detection (inference), which produces binary segmentations. The binarized cell’s center points are subsequently transformed to the Allen Brain Atlas CCF3 space. The cells are visualized in atlas space as (group-wise) heat maps and in image space as color-coded tiff stacks. b, Quantitative comparison of segmentation performance based on instance Dice (F1 score) between different deep-learning architectures and DELiVR. c, F1 scores for non-deep-learning methods (gray) and DELiVR (the same F1 score for DELiVR is used as in b). d, 3D qualitative comparison between ClearMap, ClearMap2, ‘Optimized’ ClearMap, Ilastik and DELiVR on instance basis. Predicted cells with overlap in reference annotations (TP) are masked in green, predicted cells with no overlap in reference annotations (FP) are masked in red. Undetected reference annotation cells (FN) are marked in blue. TP, true positive; FP, false positive; FN, false negative. Scale bar, 100 µm. e, Whole-brain segmentation output of the detected cells is visualized in atlas space using BrainRender. Scale bar, 1 mm in CCF3 atlas space. Source data
Fig. 3
Fig. 3. DELiVR runs end to end and can be adapted to other cell types.
ac, The DELiVR plugin will appear in Fiji upon installation. It can launch DELiVR for inference (b) or launch the training Docker to train on domain-specific training data (c). d,e, Zoomed-in Arivis VisionVR view of raw data from a CX3CR1GFP/+ microglia reporter mouse (d) and annotation overlay of cell bodies generated in VR (e). Scale bar, 10 µm. f, 3D representation of the training evaluation on instance basis; predicted cells with overlap in reference annotations are masked in green (TP), predicted cells with no overlap in reference annotations are masked in red (FP) and reference annotation cells with no corresponding prediction are marked in blue (FN). Following training, DELiVR segments microglia cell bodies with a Dice (F1) score of 0.92. Scale bar, 10 µm. g, Optical section of a CX3CR1GFP/+ microglia reporter mouse brain hemisphere (n = 1, sagittal), scanned at ×12 magnification and with inversed brightness (microglia indicates black spots). Scale bar, 1 mm. h, Zoomed-in view of the cortex (red inset in g), with overlaid segmented cells detected by whole-hemisphere DELiVR analysis shown in green (n = 1). Scale bar, 100 µm. i, Visualization of 12.2 million CX3CR1GFP/+ microglia across one hemisphere, generated by DELiVR and visualized with Imaris. Color-coding per Allen Brain Atlas CCF3 regions. Scale bar, 1 mm.
Fig. 4
Fig. 4. DELiVR identifies changes in neuronal activity in weight-stable cancer.
a, Experimental setup. Adult mice were subcutaneously injected with PBS as control; NC26 cells that lead to a weight-stable cancer or cachexia-inducing C26 cancer cells. b, Body weight change of mice at the end of the experiment compared to starting body weight. Tumor weight was subtracted from the final body weight. n(PBS) = 12, n(NC26) = 8, n(C26) = 12. Data are presented as mean ± s.e.m. ****P < 0.0001, one-way ANOVA with Sidak post hoc analysis c, Tumor weight at the end of the experiment. n(NC26) = 8, n(C26) = 12. Data are presented as mean ± s.e.m. d, Normalized c-Fos+ cell density in brains of PBS controls, mice with weight-stable cancer (NC26) and mice with cancer-associated weight loss (C26), visualized in CCF3 atlas space. n(PBS) = 12, n(NC26) = 8, n(C26) = 12. Scale bars, 2 mm. Source data
Fig. 5
Fig. 5. DELiVR identifies cancer-related brain activation patterns.
a, Brain-region-wise c-Fos+ cell density log2(fold change) compared between the three groups. *Padj < 0.1 (two-sided unpaired t-tests with Benjamini–Hochberg multiple-testing correction with FWER = 0.1, n(PBS) = 12, n(NC26) = 8, n(C26) = 12). b, Brain areas with significantly different (Padj < 0.1) c-Fos expression between NC26/C26 (top) or NC26/PBS (bottom) visualized using BrainRender. Red indicates significantly (*Padj < 0.1) more c-Fos+ cells in NC26 in both cases. Two-sided unpaired t-tests with Benjamini–Hochberg multiple-testing correction with FWER = 0.1, n(PBS) = 12, n(NC26) = 8, n(C26) = 12. Scale bars, 1 mm. c, Flattened-cortex visualizations of normalized c-Fos+ cell density for PBS control mice (n = 12), NC26 (n = 8) and C26 tumor-bearing mice (n = 12), Scale bars, 1 mm in flattened-cortex projection space (flattened from CCF3 atlas space). d, c-Fos+ cell density in cortical subregions that were statistically significantly (*Padj < 0.1) different after multiple-testing correction. Two-sided unpaired t-tests with Benjamini–Hochberg multiple-testing correction with FWER = 0.1, n(PBS) = 12, n(NC26) = 8, n(C26) = 12. Source data
Extended Data Fig. 1
Extended Data Fig. 1. VR Segmentation in syGlass and 2D-slice-based segmentation using ITK-SNAP.
a, Volume of raw data (c-Fos labeled brain) that was generated by light-sheet microscopy and loaded into syGlass. Volume size represents 2003 voxel, rendered isotropically. b-d, Using VR, individual cells were segmented in syGlass by using three-dimensional euclidean shapes as ROI and adjusting a threshold until the segmentation was acceptable. Scale bar indicates 5 µm. e, ITK-SNAP view of a single plane of the image stack. Cells were labeled in 2D, slice by slice. Segmentations are color coded by cell ID.
Extended Data Fig. 2
Extended Data Fig. 2. DELiVR pre-processing automatically removes artefacts.
a-c, Horizontal view of an original image slice (a), the proposed mask (b) and the masked image slice generated (c). Scale bar = 1 mm. d, Architecture of the c-Fos deep-learning network; a MONAI 3D BasicUNet. e, Quantitative comparison (instance precision and sensitivity) of segmentation performance between deep-learning architectures and DELiVR’s 3D BasicUNet. f, Segmentation performance of non-deep-learning methods and DELiVR (Scores for DELiVR are the same as used in e). Source data
Extended Data Fig. 3
Extended Data Fig. 3. Whole-brain segmentation output generated with DELiVR.
a, 3D visualization of a whole raw light-sheet image stack. b, 3D view of whole-brain segmentation output of detected cells by DELiVR. The area-wise color code from the Allen Brain Atlas was combined with the 3D segmentation. Thereby each cell is color coded according to the brain area it was detected in. The segmentation of cells is shown in the original image space. Scale bar = 500 µm. c, Visualization of the detected cells in CCF3 atlas space using BrainRender (same image as in Fig. 2e). Scale bar = 1 mm.
Extended Data Fig. 4
Extended Data Fig. 4. Tissue weights of mice with weight-stable cancer (NC26) and cancer-associated weight loss (C26).
a, Gastrocnemius (GC) muscle weight. n(PBS) = 12, n(NC26) = 8, n(C26) = 12, ****p < 0.0001,***p = 0.0004, One-way ANOVA with Sidak post hoc analysis. b, Epididymal white adipose tissue (eWAT) weight. n(PBS) = 12, n(NC26) = 8, n(C26) = 12, **p(PBS vs C26) = 0.0040,**p(NC26 vs C26) = 0.0015, Kruskal-Wallis test with Dunn´s multiple comparison test. c, Subcutaneous WAT (scWAT) weight. ***p = 0.0003, **p = 0.0019, Kruskal-Wallis test with Dunn´s multiple comparison test. d, Brain weight. n(PBS) = 12, n(NC26) = 7, n(C26) = 12, *p = 0.0479, One-way ANOVA with Sidak post hoc analysis. All data are presented as mean values +/− SEM. Source data

References

    1. Ueda HR, et al. Tissue clearing and its applications in neuroscience. Nat. Rev. Neurosci. 2020;21:61–79. doi: 10.1038/s41583-019-0250-1. - DOI - PubMed
    1. Erturk A, et al. Three-dimensional imaging of solvent-cleared organs using 3DISCO. Nat. Protoc. 2012;7:1983–1995. doi: 10.1038/nprot.2012.119. - DOI - PubMed
    1. Cai R, et al. Panoptic imaging of transparent mice reveals whole-body neuronal projections and skull-meninges connections. Nat. Neurosci. 2019;22:317–327. doi: 10.1038/s41593-018-0301-3. - DOI - PMC - PubMed
    1. Belle M, et al. Tridimensional visualization and analysis of early human development. Cell. 2017;169:161–173. doi: 10.1016/j.cell.2017.03.008. - DOI - PubMed
    1. Bhatia HS, et al. Spatial proteomics in three-dimensional intact specimens. Cell. 2022;185:5040–5058. doi: 10.1016/j.cell.2022.11.021. - DOI - PubMed

Substances

LinkOut - more resources