

Investigating potential biomarkers of acute pancreatitis in patients with a BMI>30 using Mendelian randomization and transcriptomic analysis
- PMID: 38649912
- PMCID: PMC11034057
- DOI: 10.1186/s12944-024-02102-3
Investigating potential biomarkers of acute pancreatitis in patients with a BMI>30 using Mendelian randomization and transcriptomic analysis
Abstract
Background: Acute pancreatitis (AP) has become a significant global health concern, and a high body mass index (BMI) has been identified as a key risk factor exacerbating this condition. Within this context, lipid metabolism assumes a critical role. The complex relationship between elevated BMI and AP, mediated by lipid metabolism, markedly increases the risk of complications and mortality. This study aimed to accurately define the correlation between BMI and AP, incorporating a comprehensive analysis of the interactions between individuals with high BMI and AP.
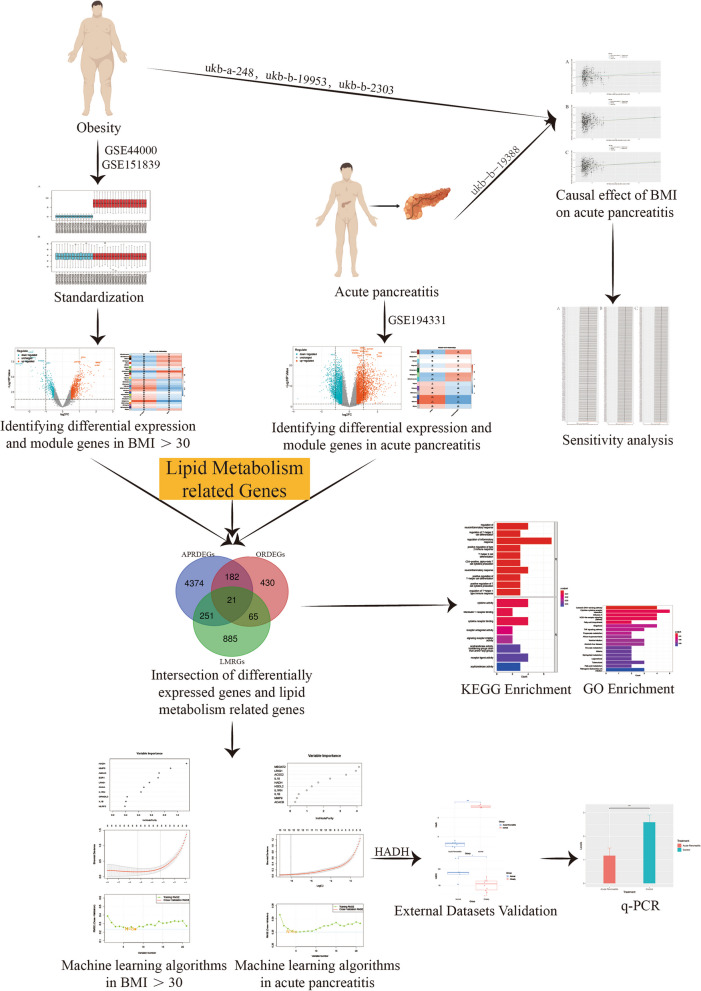
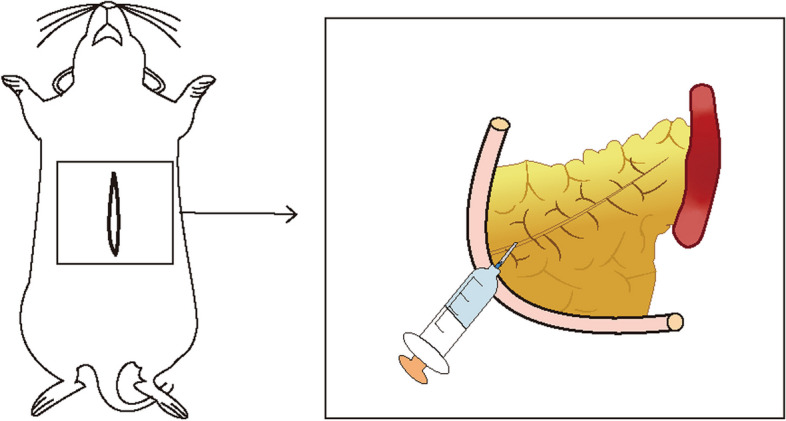
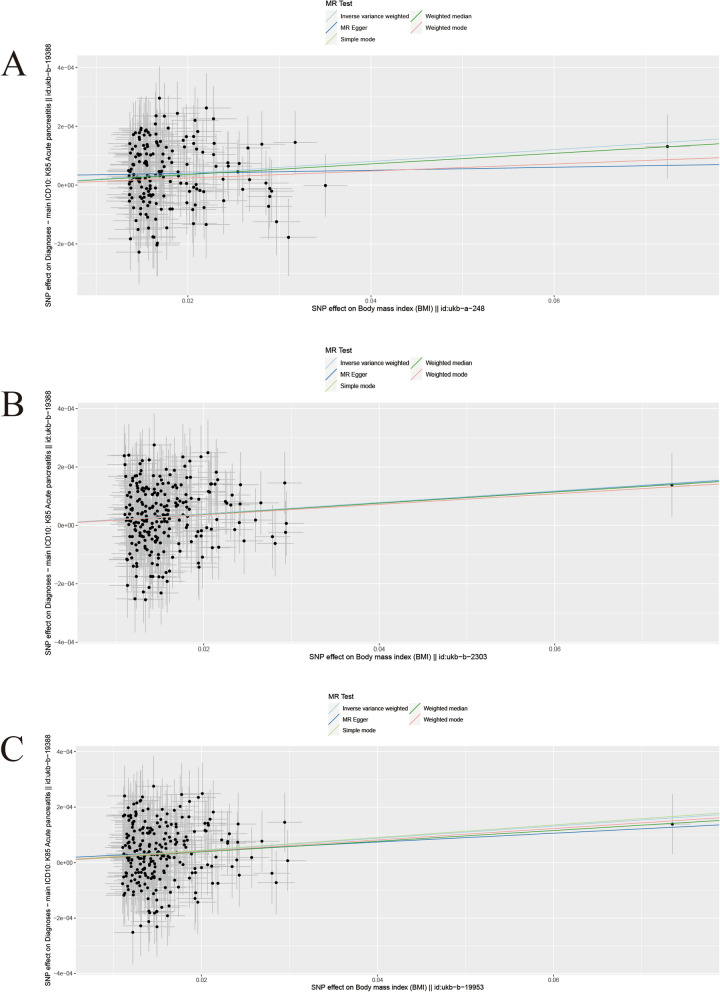
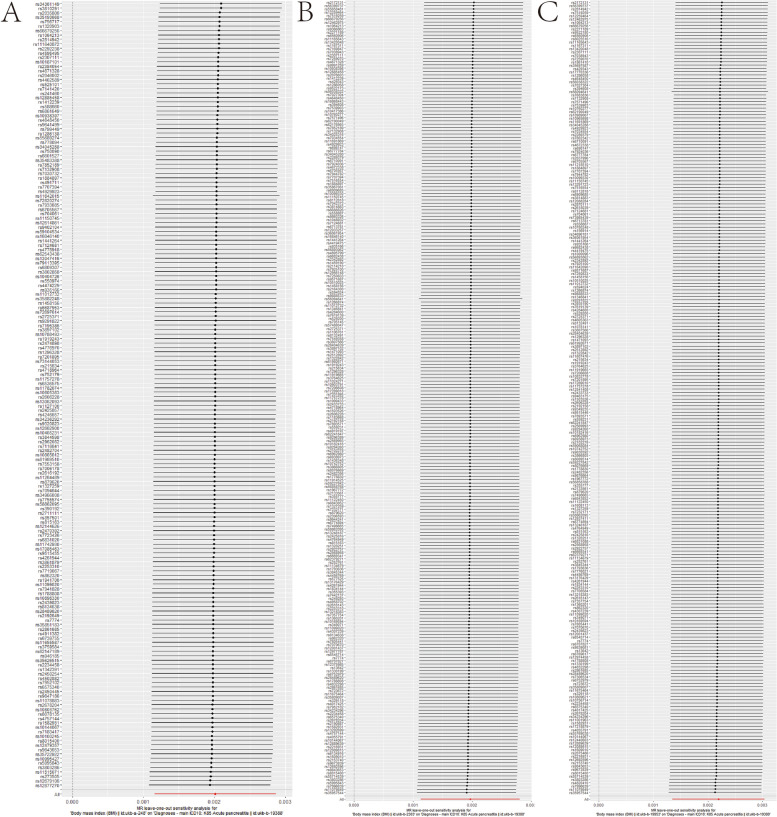
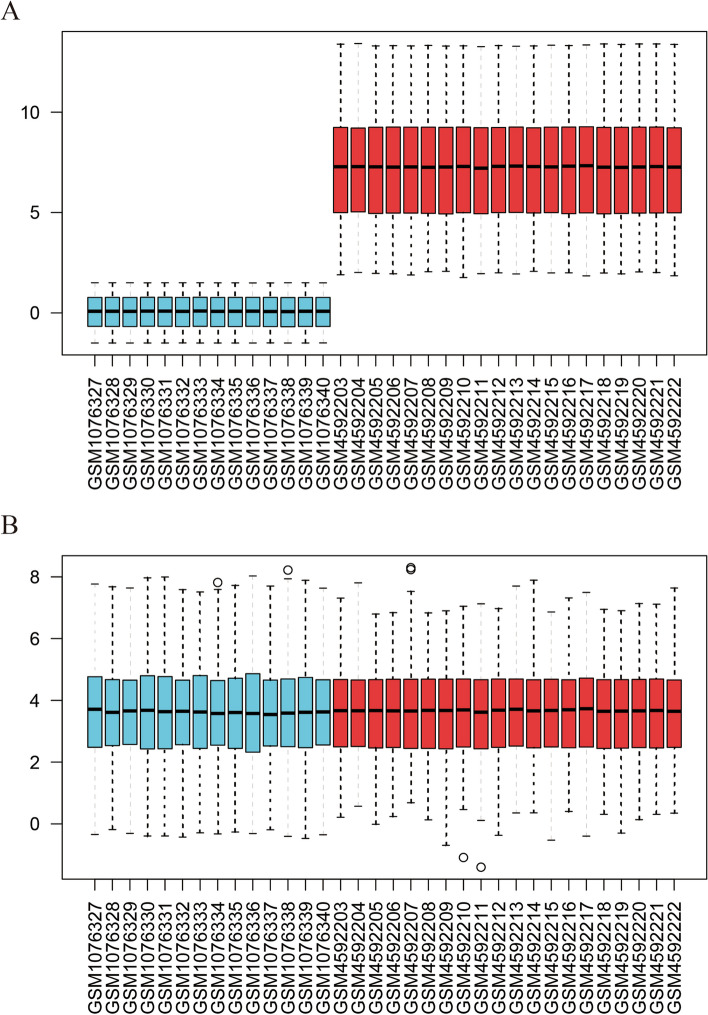
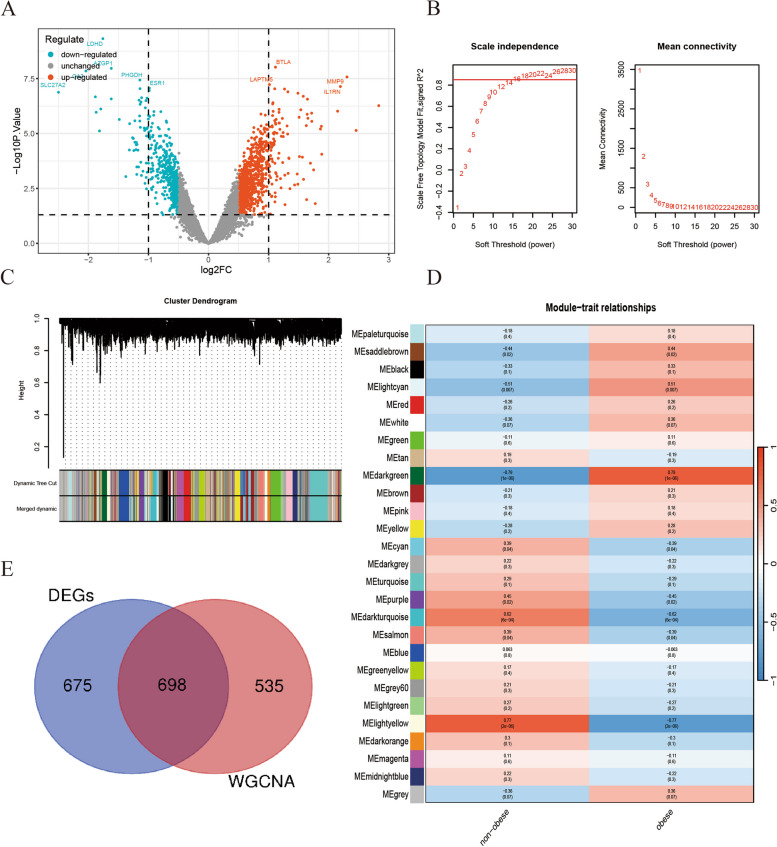
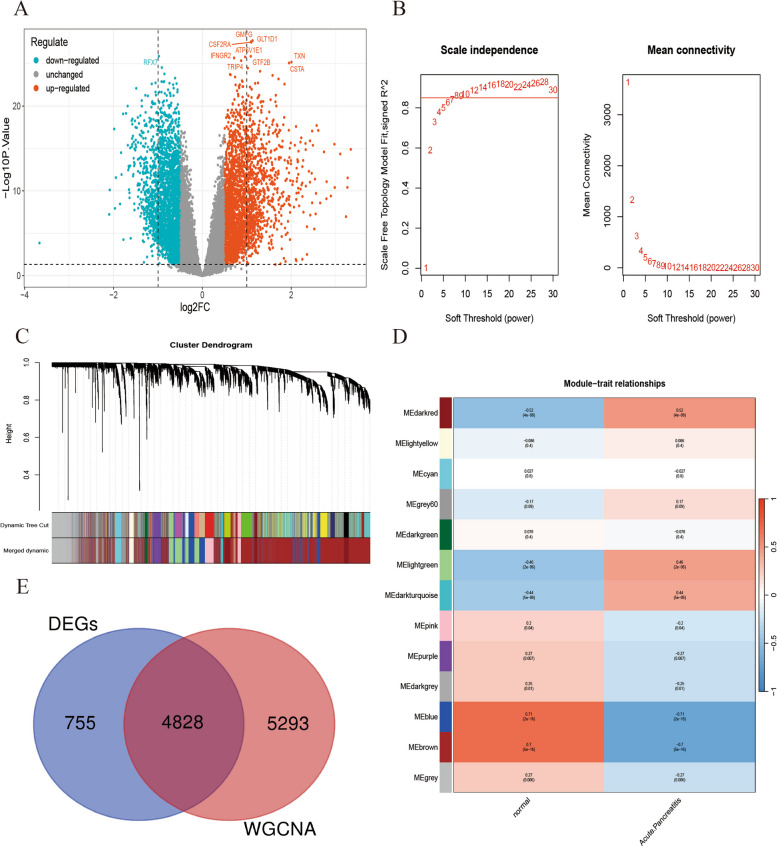
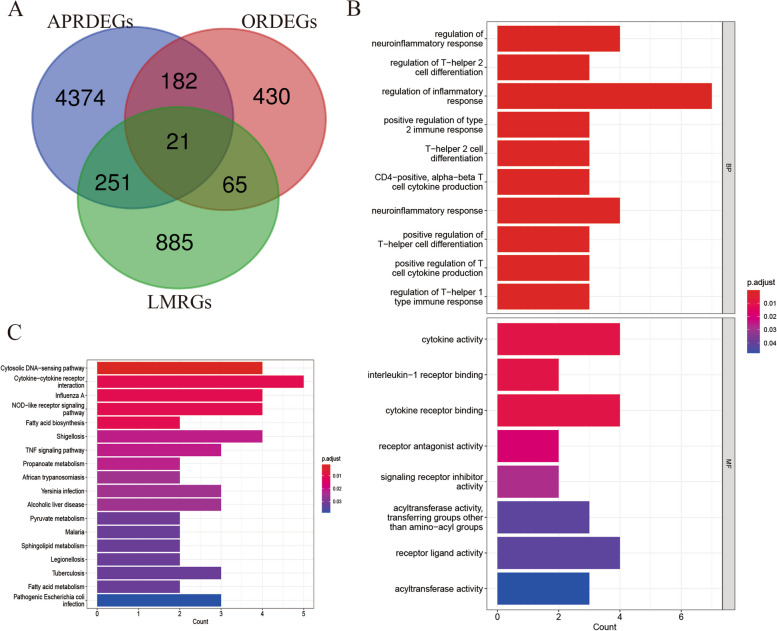
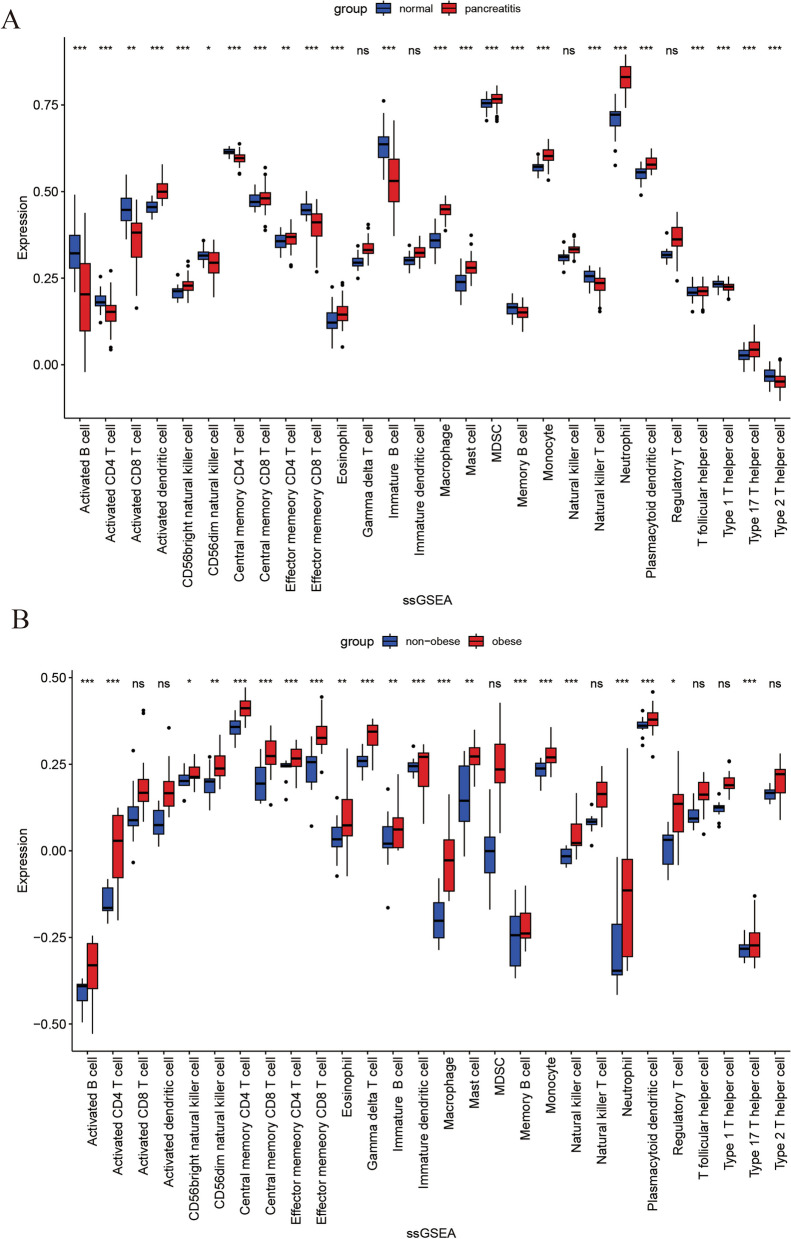
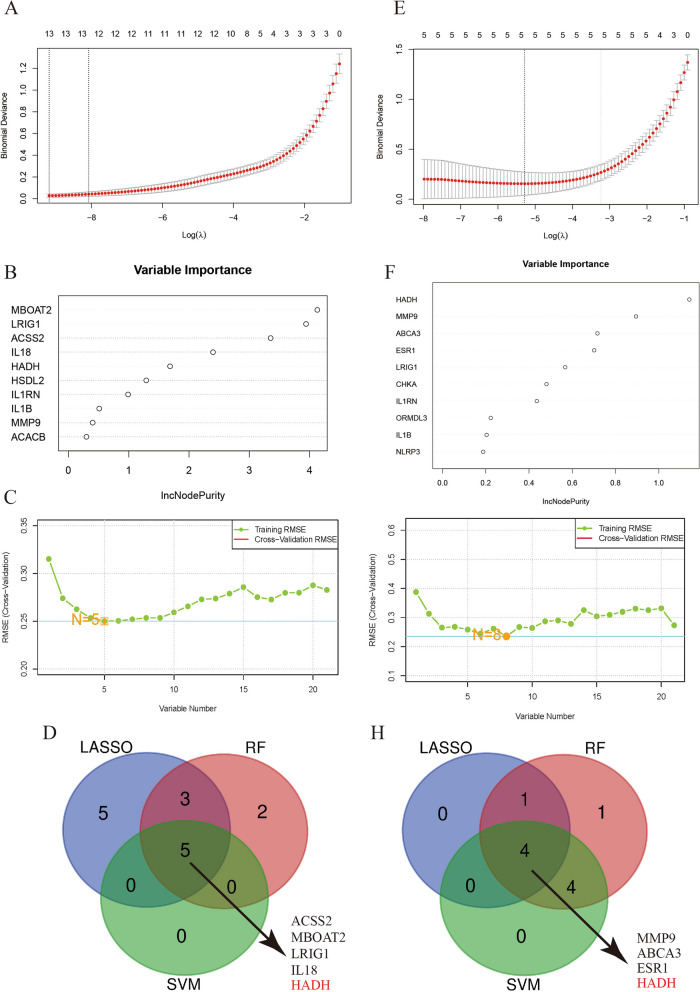
Methods: Mendelian randomization (MR) analysis was first applied to determine the causal relationship between BMI and the risk of AP. Subsequently, three microarray datasets were obtained from the GEO database. This was followed by an analysis of differentially expressed genes and the application of weighted gene coexpression network analysis (WGCNA) to identify key modular genes associated with AP and elevated BMI. Functional enrichment analysis was then performed to shed light on disease pathogenesis. To identify the most informative genes, machine learning algorithms, including Random Forest (RF), Support Vector Machine-Recursive Feature Elimination (SVM-RFE), and Least Absolute Shrinkage and Selection Operator (LASSO), were employed. Subsequent analysis focused on the colocalization of the Quantitative Trait Loci (eQTL) data associated with the selected genes and Genome-Wide Association Studies (GWAS) data related to the disease. Preliminary verification of gene expression trends was conducted using external GEO datasets. Ultimately, the diagnostic potential of these genes was further confirmed through the development of an AP model in mice with a high BMI.
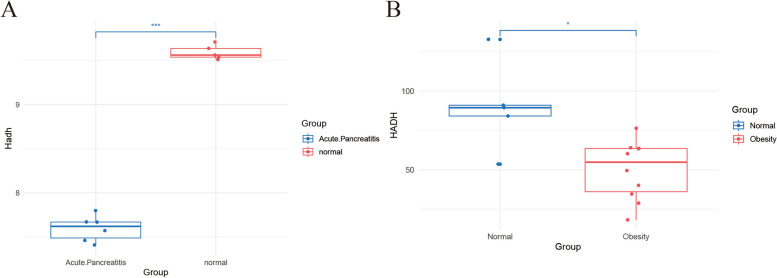
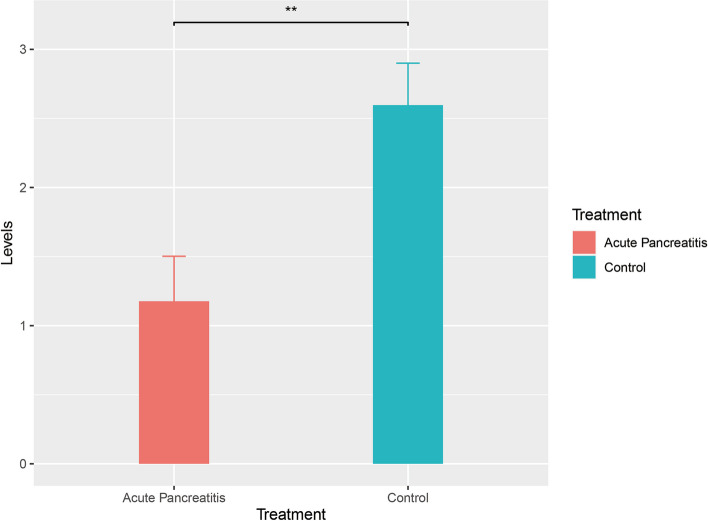
Results: A total of 21 intersecting genes related to BMI>30, AP, and lipid metabolism were identified from the datasets. These genes were primarily enriched in pathways related to cytosolic DNA sensing, cytokine‒cytokine receptor interactions, and various immune and inflammatory responses. Next, three machine learning techniques were utilized to identify HADH as the most prevalent diagnostic gene. Colocalization analysis revealed that HADH significantly influenced the risk factors associated with BMI and AP. Furthermore, the trend in HADH expression within the external validation dataset aligned with the trend in the experimental data, thus providing a preliminary validation of the experimental findings.The changes in its expression were further validated using external datasets and quantitative real-time polymerase chain reaction (qPCR).
Conclusion: This study systematically identified HADH as a potential lipid metabolism-grounded biomarker for AP in patients with a BMI>30.
Keywords: AP; BMI; Lipid metabolism; Machine learning.
© 2024. The Author(s).
Conflict of interest statement
The authors declare no competing interests.
Figures
References
-
- Xiao AY, Tan MLY, Wu LM, Asrani VM, Windsor JA, Yadav D, et al. Global incidence and mortality of pancreatic diseases: a systematic review, meta-analysis, and meta-regression of population-based cohort studies. Lancet Gastroenterol Hepatol. 2016;1(1):45–55. doi: 10.1016/S2468-1253(16)30004-8. - DOI - PubMed
MeSH terms
Substances
Grants and funding
- 2021-XZYG-B16/Hospital Management of the General Hospital of Western Theater Command
- 2021-XZYG-B16/Hospital Management of the General Hospital of Western Theater Command
- 2021-XZYG-B16/Hospital Management of the General Hospital of Western Theater Command
- 2021-XZYG-B16/Hospital Management of the General Hospital of Western Theater Command
- 2021-XZYG-B16/Hospital Management of the General Hospital of Western Theater Command
- 2021-XZYG-B16/Hospital Management of the General Hospital of Western Theater Command
- 2022YFS0195/the Key Research and Development Program of Sichuan Provincial Science and Technology Department
- 2022YFS0195/the Key Research and Development Program of Sichuan Provincial Science and Technology Department
- 2022YFS0195/the Key Research and Development Program of Sichuan Provincial Science and Technology Department
- 2022YFS0195/the Key Research and Development Program of Sichuan Provincial Science and Technology Department
- 2022YFS0195/the Key Research and Development Program of Sichuan Provincial Science and Technology Department
- 2022YFS0195/the Key Research and Development Program of Sichuan Provincial Science and Technology Department
LinkOut - more resources
Full Text Sources
Medical
Miscellaneous
