. 2024 Apr 22;40(1):16.
doi: 10.1186/s42826-024-00202-w.

Refined protocol for newly onset identification in non-obese diabetic mice: an animal-friendly, cost-effective, and efficient alternative

Affiliations

Refined protocol for newly onset identification in non-obese diabetic mice: an animal-friendly, cost-effective, and efficient alternative

Chia-Chi Liao et al. Lab Anim Res. .

Abstract

Background: Therapeutic interventions for diabetes are most effective when administered in the newly onset phase, yet determining the exact onset moment can be elusive in practice. Spontaneous autoimmune diabetes among NOD mice appears randomly between 12 and 32 weeks of age with an incidence range from 60 to 90%. Furthermore, the disease often progresses rapidly to severe diabetes within days, resulting in a very short window of newly onset phase, that poses significant challenge in early diagnosis. Conventionally, extensive blood glucose (BG) testing is typically required on large cohorts throughout several months to conduct prospective survey. We incorporated ultrasensitive urine glucose (UG) testing into an ordinary BG survey process, initially aiming to elucidate the lag period required for excessive glucose leaking from blood to urine during diabetes progression in the mouse model.

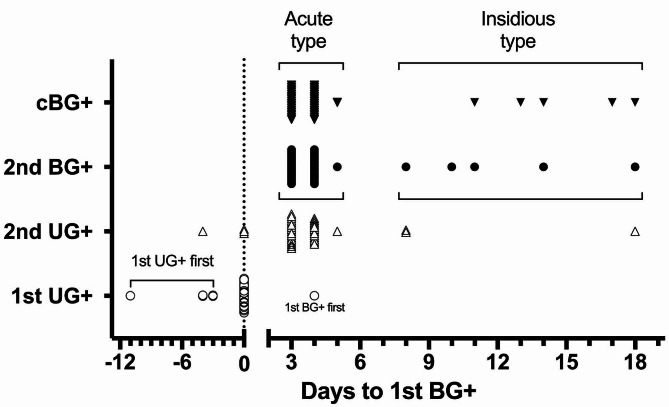
Results: The observations unexpectedly revealed that small amounts of glucose detected in the urine often coincide with, sometimes even a couple days prior than elevated BG is diagnosed. Accordingly, we conducted the UG-based survey protocol in another cohort that was validated to accurately identified every individual near onset, who could then be confirmed by following few BG tests to fulfill the consecutive BG + criteria. This approach required fewer than 95 BG tests, compared to over 700 tests with traditional BG survey, to diagnose all the 37-38 diabetic mice out of total 60. The average BG level at diagnosis was slightly below 350 mg/dl, lower than the approximately 400 mg/dl observed with conventional BG monitoring.

Conclusions: We demonstrated a near perfect correlation between BG + and ultrasensitive UG + results in prospective survey with no lag period detected under twice weekly of testing frequency. This led to the refined protocol based on surveying with noninvasive UG testing, allowing for the early identification of newly onset diabetic mice with only a few BG tests required per mouse. This protocol significantly reduces the need for extensive blood sampling, lancet usage, labor, and animal distress, aligning with the 3Rs principle. It presents a convenient, accurate, and animal-friendly alternative for early diabetes diagnosis, facilitating research on diagnosis, pathogenesis, prevention, and treatment.

Keywords: Autoimmune diabetes; Blood glucose; Early onset diagnosis; Glycemia; Glycosuria; NOD mice; Spontaneous diabetes; Ultrasensitive glucose test; Urine glucose.


Conflict of interest statement

The authors declare that there are no competing interests.

Figures

Fig. 1
Fig. 1
The appearance of BG + and UG + are highly synchronized in Part I during the weekly diabetes survey. Each line represents an individual of diabetic mouse in Part I marked by the age diagnosed for the 1st and 2nd BG+ (gray circle and black circle) alongside the 1st and 2nd UG+ (open circle and open triangle). The period before the diagnosis of 1st BG + is depicted by gray bars, encompassed 263 BG tests in these 38 diabetic mice alone. Additionally, the rest 22 non-diabetic mice underwent 398 BG tests throughout the entire observation window without yielding positive results. The duration between 1st and 2nd BG + are illustrated by black bars. Mice are categorized based on two types of diabetes onset: the acute type (33/38, 86.8%) where 1st and 2nd BG + occur consecutively with short black bars, and the insidious type (5/38, 13.2%), where 2nd BG + is observed a week or longer after 1st BG+, resulting in extended black bars in the upper part of the figure. Most importantly, 32 out of 38 mice (84.2%) exhibit 1st UG + and 1st BG + simultaneously (indicated by vertically overlapping open and gray circles in the middle part). The 5 mice in the 1st UG + first group can be also diagnosed of their own 1st BG + results in the following tests. These findings strongly suggest that during the progression of spontaneous diabetes, the appearance of 1st UG + results precedes or coincides with the 1st BG+, indicating a potential use of ultrasensitive UG test as a primary survey approach
Fig. 2
Fig. 2
Diabetes onset timeline of Part I. The 1st BG + day of each diabetic mouse in Part I is set as day 0 (aligned by the dashed line) and the corresponding days of diagnosis for 1st UG+, 2nd UG+, 2nd BG+, and cBG + are plotted accordingly to illustrate the onset timeline. The majority of mice (32/38) exhibit a simultaneous diagnosis of both 1st UG + and 1st BG + on the exact same day, represented by condensed open circles on day 0. The 5 open circles on the left indicate their 1st UG + day appearing a couple of days earlier than day 0, forming the 1st UG + first group. In the mouse with 1st BG + first, the 1st UG + day occurs four days after day 0, shown as the only open circle on the right of the dashed line. Symbols in the figure maintain consistency with those in Fig. 1, and group labels are displayed on the y-axis, with additional cBG + denoted by a reversed black triangle. This figure suggests that the UG test can predict the 1st BG + moment effectively and has the potential to replace routine weekly BG survey initially. Furthermore, 2nd BG + and cBG + can be uniformly diagnosed within days 3 to 5 in the acute onset group, a sharp contrast to the insidious onset group. To better distinguish these two onset types, frequent BG tests starting from day 0 are essential. Therefore, we next focus on using ultrasensitive UG tests to identify the 1st BG + moment of individual candidates and subsequently perform intensive BG tests to achieve early diagnosis as soon as possible
Fig. 3
Fig. 3
BG levels at each diagnosis moment in Part I. Average BG levels are presented as mean ± SD on the right, analyzed using Tukey’s multiple comparison of ANOVA test. All statistical significances are indicated on the right: one asterisk (*) for p value < 0.05 and two asterisks (**) for p value < 0.01. Symbols remain consistent with previous figures, and group labels are displayed on the y-axis. In instances where the 1st UG + and 1st BG + are identified on the same day (similarly for 2nd BG + and cBG+), they share the same BG level, represented as vertical lines. The average BG level at the 1st UG + moment is found to be comparable to that at the 1st BG + moment but significantly lower than the levels at the 2nd BG + and cBG + moments, indicating a gradual increasing trend. The BG level of mice confirmed at the cBG + moment is measured at 383 ± 74 mg/dl, representing a definitive onset of newly diagnosed diabetes
Fig. 4
Fig. 4
Appearance of UG + and BG + in Part II survey with refined protocol. Each line represents an individual diabetic mouse in Part II. The period surveyed by the UG testing is illustrated by open bars, concluding at the age of each 1st UG + moment represented as open circles. This contrasts with the gray bars of BG testing in Fig. 2, as these have been replaced with the non-invasive UG testing in Part II. BG testing were then immediately performed starting from the day of the 1st UG+, with corresponding ages for the 1st and 2nd BG + marked with gray circles and black circles, respectively. The 2nd UG + is indicated with open triangles, and the duration between 1st and 2nd BG + is represented by black lines. Mice are categorized based on two types of diabetes onset: the acute type (31/37, 83.8%), where 1st and 2nd BG + occur consecutively with very short black lines, and the insidious type (6/37, 16.2%), where the 2nd BG + is observed a week after the 1st BG+, resulting in extended black lines in the upper part of the figure. The majority of mice, 30 out of 37 (81.1%), exhibit their 1st UG + and 1st BG + simultaneously in the same day, indicated by vertically overlapping open and gray circles in the middle part. Using this refined protocol, it takes less than 50 bleedings to identify the 1st BG + moment in these 37 diabetic mice. Additionally, hundreds of negative BG results are saved among the 23 non-diabetic mice. Interestingly, during the twice-weekly UG survey, 7 mice are found to have UG + first (while BG remains normal), followed by their own 1st BG + results in subsequent tests. These findings strongly suggest that during the progression of spontaneous diabetes, the appearance of a small amount of glucose in the urine primarily coincides, and sometimes even precedes, the 1st BG + moment, making the ultrasensitive UG testing an excellent tool to assist in diabetes diagnosis
Fig. 5
Fig. 5
Diabetes onset timeline of Part II. The 1st BG + day of each diabetic mouse in Part II is designated as day 0 (aligned by the dashed line), and the corresponding days of diagnosis for 1st UG+, 2nd UG+, 2nd BG+, and cBG + are plotted to illustrate the onset timeline. The 7 open circles on the left indicate their 1st UG + day occurring 1–11 days earlier than day 0, forming the 1st UG + first group. The remaining mice (30/37) are all diagnosed with their 1st UG + and 1st BG + on the exact same day, represented by condensed open circles on day 0. Symbols in the figure remain consistent with previous figures, and group labels are displayed on the y-axis. Intensive measurements since day 0 reveal that the 2nd BG + can be observed in 22 and 9 mice on day 1 and day 2–4, respectively, comprising all acute types of onset. In contrast, the 2nd BG + appears between day 7 to 35 in the insidious type of onset. We conclude that the 4-day interval from day 0 is crucial for onset determination, especially on day 1 (22/37, 59.5%). When the earliest onset moment is required, daily measurements from day 1 to 4 provide the best resolution (31/37, 83.8%). Moreover, in both types of onset, all the cBG + in both Part I and II can be detected within 4 days from the previous BG+, indicating that the potential fluctuation of BG level (in insidious types of onset) may not exceed 4 days in overt diabetes onset conditions. Considering the frequency of diagnosis substantially determines the definition of “consecutive BG+” with different time intervals, our data suggest that following BG+ (from the previous BG+) within 4 days can be considered as the onset to better identify newly diabetic animals
Fig. 6
Fig. 6
BG levels at each diagnosis moment in Part II. Average BG levels are presented as mean ± SD on the right. Symbols maintain consistency with previous figures, and group labels are displayed on the y-axis. In instances where the 1st UG + and 1st BG + are identified on the same day (similarly for 2nd BG + and cBG+), they share the same BG level, represented as vertical lines. The average BG level at the 1st UG + moment is 316 ± 75 mg/dl, comparable to the cBG + moment of 347 ± 68 mg/dl when overt diabetes is validated. In contrast with the Part I study where cBG level was at 383 ± 74 mg/dl, an unpaired t test revealed a significantly lower BG level (p = 0.03) screened by this refined protocol. Tukey’s multiple comparison of ANOVA test revealed no statistically significant differences within any two of these values in Part II, suggesting rapid diagnosis within short period (mostly < 4 days) from 1st UG + moment to achieve a more efficient newly onset diagnosis

References

    1. Atkinson MA, Eisenbarth GS, Michels AW. Type 1 diabetes. Lancet. 2014;383:69–82. doi: 10.1016/S0140-6736(13)60591-7. - DOI - PMC - PubMed
    1. Pugliese A. Autoreactive T cells in type 1 diabetes. J Clin Invest. 2017;127:2881–91. doi: 10.1172/JCI94549. - DOI - PMC - PubMed
    1. Pozzilli P, Signore A, Williams AJK, Beales PE. NOD mouse colonies around the world- recent facts and figures. Immunol Today. 1993;14:193–6. doi: 10.1016/0167-5699(93)90160-M. - DOI - PubMed
    1. Chen D, Thayer TC, Wen L, Wong FS. Mouse models of Autoimmune Diabetes: the nonobese Diabetic (NOD) mouse. In: King AJF, editor. Animal models of diabetes. New York, NY: Springer US; 2020. pp. 87–92. - PMC - PubMed
    1. Anderson MS, Bluestone JA. THE NOD MOUSE: a model of Immune Dysregulation. Annu Rev Immunol. 2005;23:447–85. doi: 10.1146/annurev.immunol.23.021704.115643. - DOI - PubMed

LinkOut - more resources