Review
. 2024 Apr 22;18(1):29.
doi: 10.1186/s13036-024-00425-4.

Promoting osteogenesis and bone regeneration employing icariin-loaded nanoplatforms

Affiliations
Review

Promoting osteogenesis and bone regeneration employing icariin-loaded nanoplatforms

Mahsa Mohammadzadeh et al. J Biol Eng. .

Abstract

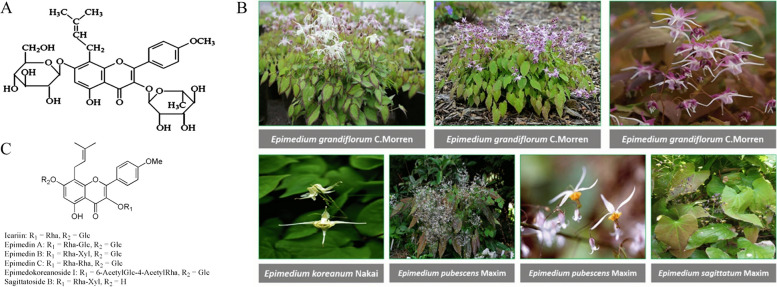
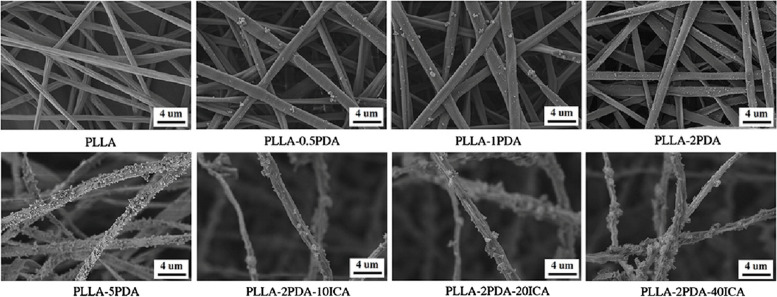
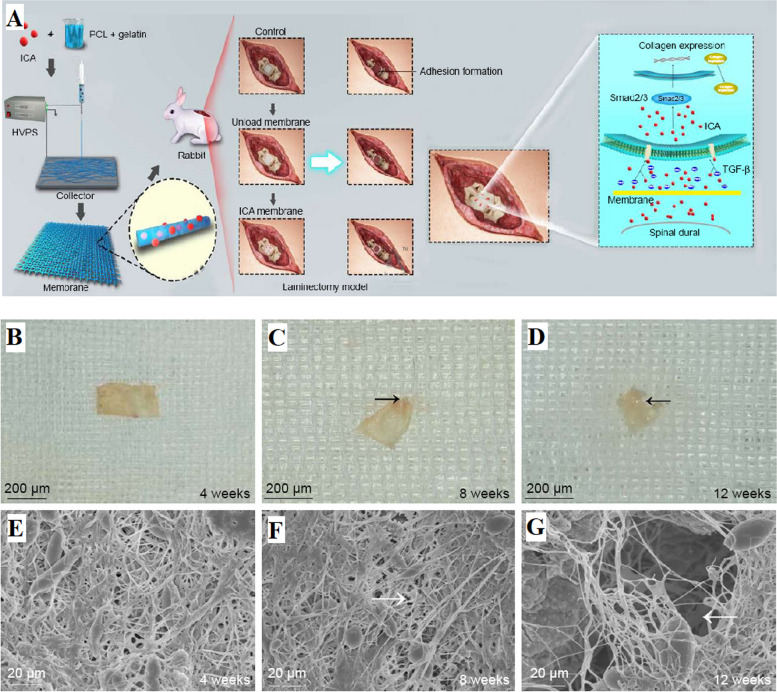
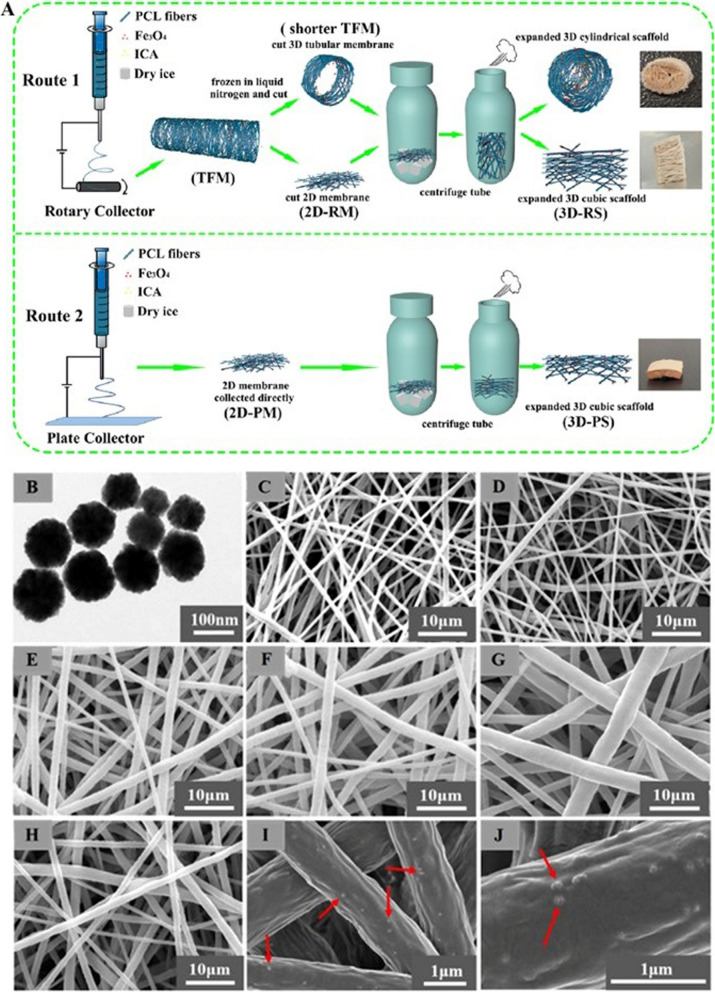
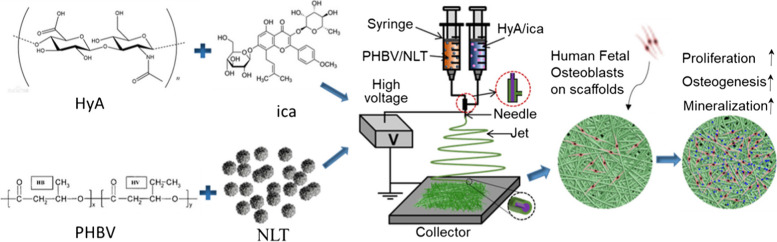
There is an increasing demand for innovative strategies that effectively promote osteogenesis and enhance bone regeneration. The critical process of bone regeneration involves the transformation of mesenchymal stromal cells into osteoblasts and the subsequent mineralization of the extracellular matrix, making up the complex mechanism of osteogenesis. Icariin's diverse pharmacological properties, such as anti-inflammatory, anti-oxidant, and osteogenic effects, have attracted considerable attention in biomedical research. Icariin, known for its ability to stimulate bone formation, has been found to encourage the transformation of mesenchymal stromal cells into osteoblasts and improve the subsequent process of mineralization. Several studies have demonstrated the osteogenic effects of icariin, which can be attributed to its hormone-like function. It has been found to induce the expression of BMP-2 and BMP-4 mRNAs in osteoblasts and significantly upregulate Osx at low doses. Additionally, icariin promotes bone formation by stimulating the expression of pre-osteoblastic genes like Osx, RUNX2, and collagen type I. However, icariin needs to be effectively delivered to bone to perform such promising functions.Encapsulating icariin within nanoplatforms holds significant promise for promoting osteogenesis and bone regeneration through a range of intricate biological effects. When encapsulated in nanofibers or nanoparticles, icariin exerts its effects directly at the cellular level. Recalling that inflammation is a critical factor influencing bone regeneration, icariin's anti-inflammatory effects can be harnessed and amplified when encapsulated in nanoplatforms. Also, while cell adhesion and cell migration are pivotal stages of tissue regeneration, icariin-loaded nanoplatforms contribute to these processes by providing a supportive matrix for cellular attachment and movement. This review comprehensively discusses icariin-loaded nanoplatforms used for bone regeneration and osteogenesis, further presenting where the field needs to go before icariin can be used clinically.

Keywords: Bone regeneration; Icariin; Nanofibers; Nanoparticles; Nanoplatforms; Osteogenesis.


Conflict of interest statement

The authors declare no competing interests.

Figures

Fig. 1
Fig. 1
A The chemical structure of ICA (C33 H40 O15; molecular weight=676.67). Reprinted with permission from [41], B Various species of epimedium as sources of ICA and its derivatives. Reprinted with permission from [42], C Chemical structures of ICA derivatives. Reprinted with permission from [43]
Fig 2
Fig 2
Morphological enhancement of fibrous membranes for BTE. PLLA: poly(l-lactide), PDA: polydopamine, ICA: Icariin. Reprinted with permission from [89]
Fig. 3
Fig. 3
A Diagram depicting the creation of the PCL-gelatin membrane and its application in a laminectomy model for adhesion prevention. Additionally, a representation highlighting potential modes of inhibiting TGF-β and Smad pathways using ICA, B-D Morphological characterization of ICA-loaded PCL-gelatin membrane, E–G SEM images of membrane surfaces captured at various post-implantation time points. ICA: Icariin, HVPS: high voltage power supply. The black arrows indicate the absorbed margin, and the white arrows indicate the pores. Reprinted with permission from [90]
Fig. 4
Fig. 4
A The production processes of the PCL/Fe3O4/ICA 2D membrane and 3D scaffold. The tubular fibrous membrane obtained from the rotary device is denoted as TFM, while the 2D membrane directly collected from the flat plate is labeled as 2D-PM. Additionally, 2D-RM represents the 2D membrane cut from TFM collected using the rotary device. The scaffold derived from 2D-PM is termed 3D-PS, and the scaffold originating from 2D-RM is named 3D-RS. B-J The transmission electron microscopy (TEM) image shows Fe3O4 MNPs, while the scanning electron microscopy (SEM) images showcase various compositions of 2D-RMs collected by the rotary collector. These compositions include: B Fe3O4 MNPs; C PCL; D PCL/ICA; E PCL/Fe3O4-0.25%; F PCL/Fe3O4-0.5%; G PCL/Fe3O4-1%; and H-J PCL/Fe3O4/ICA. The highlighted rows indicate the presence of Fe3O4 MNPs. Reprinted with permission from [91]
Fig. 5
Fig. 5
SEM images of the fibrous scaffolds: A PLGA fibrous scaffold; B PLGA/0.01% ICA fibrous scaffold, C PLGA/0.1% ICA fibrous scaffold, and D PLGA/1% ICA fibrous scaffold. The scale bar corresponds to 10 µm. Reprinted with permission from [92]
Fig. 6
Fig. 6
Schematic representation outlining the process involved in creating a composite scaffold of collagen/PCL/hydroxyapatite/ICA. Col: Collagen, PCL: Polycaprolactone, HA: hydroxyapatite, Reprinted with permission from [94]
Fig 7
Fig 7
A SEM micrographs of the ICA-SF/PLCL nanofibrous membrane; B SEM micrographs of the SF/PLCL nanofibrous membrane; C TEM micrographs of the mentioned nanofibrous membrane (scale bars: A1: 10 μm; A2: 2 μm; B1 and B2: 5 μm; C1 and C2: 100 nm); D) μ-CT images of calvaria defects. Reprinted with permission from [99]
Fig. 8
Fig. 8
Innovative electrospinning techniques for controlling fiber composition and structure. This figure presents a schematic representation of: A blend electrospinning; B emulsion electrospinning; C coaxial electrospinning; D parallel electrospinning; and E triaxial electrospinning. F Emulsion electrospinning is further showcased through images of fabricated fibers, including optical and fluorescence images of polyurethane electrospun fibers containing PVA/EGF-AF488 and PVA/BSA-TR particles. The core-sheath structure achieved by coaxial electrospinning is displayed in a G TEM image; while H hollow fibers produced by combining coaxial electrospinning with core layer removal are depicted in an SEM image. Furthermore, I a Janus structural fiber from parallel electrospinning is shown in a TEM image; and J a fiber in tube structure resulting from triaxial electrospinning and middle layer removal is exhibited in an SEM image. All images are reprinted with permission from [102].
Fig. 9
Fig. 9
Histological staining evaluation of the newly formed bone at 4-12 weeks after implantation of CPH and CPHI scaffolds in rabbit bone defects: A utilizes hematoxylin and eosin (H&E) staining to showcase the new bone formation in both CPH and CPHI scaffolds; B on the other hand, employs Masson's trichrome staining to demonstrate the distribution of the matrix. The quantitative data from Panels A and B are displayed in C and D, respectively. These data represent the mean relative values obtained from three independent experiments (mean ± SD). Significance levels are indicated as *p < 0.05, **p < 0.01, and ***p < 0.001. The asterisk symbol (*) denotes significance compared to the defect control group, while the hashtag symbol (#) denotes significance compared to the CPH group. Moving on to E-G, micro-CT analysis is utilized to assess the new bone: E shows the micro-CT scan images indicating the level of regenerated bone tissue after 4-12 weeks, F represents the bone mineral density (BMD) of the regenerated bone tissue, while G illustrates the tissue connective density (Conn.Dn) of the regenerated bone tissue. Similar to C and D, the data in F and G are presented as mean relative values obtained from three independent experiments (mean ± SD). The significance levels are indicated as *p < 0.05, **p < 0.01, with the asterisk symbol (*) denoting significance compared to the defect control group, and the hashtag symbol (#) denoting significance compared to 8 weeks. The red dotted circles in the images represent the defect areas. Reprinted with permission from [160]
Fig. 10.
Fig. 10.
A Schematic illustrating the process for biomimetic fabrication of icariin-loaded nano hydroxyapatite reinforced bioactive porous scaffolds for bone regeneration. The accompanying table provides a detailed delineation of the component values within each respective sample; B SEM images at magnifications of 500×, 2000×, and 5000×; C μ-CT images of the front and top scanning of SD rats calvaria bone defects; D Giemsa and AO/EB staining of osteoblasts cultured with leaching liquors of S0, S1, S2, S3, and I-S1, I-S2, I-S3 scaffolds. AO/EB staining at 100× magnification for 1, 3, 5, and 7 days using an AO/EB staining kit. Osteoblasts cultured with DMEM/F-12 media with 10% FBS and 1% P/S served as the control group; E HE staining; F Masson's trichrome staining; G immunohistological staining of specific bone marker (Col, OCN, VEGF) analysis of SD rats calvaria bone defects at magnifications of 40× and 400× after 8 W and 12 W implantation of three different scaffolds: S0, S3, I-S3 scaffolds, and non-treated (control). The arrowheads indicate the boundary between nascent bone and host bone, and the FT, NB respectively indicate the fibrous tissue and nascent bone. All images are reprinted with permission from [166]
Fig. 11.
Fig. 11.
A Osteogenesis of BMSCs assessed by ALP staining (7 d) and Alizarin Red staining (21 d); B Immunofluorescence assays for OCN expression (14 d) with DAPI-stained nucleus (blue) and OCN staining (green). Reprinted with permission from [163]
Fig. 12
Fig. 12
A Micro-CT images depicting the response of critical-sized rat calvaria defects to a blank control, HBG/CS, and ICA/HBG/CS scaffolds over a 12-week period; B Histomorphological evaluation of the three groups using Masson's trichrome staining to assess the formation of newly generated bone (blue) and collagen components (red). Reprinted with permission from [184]
Fig. 13
Fig. 13
The fabrication process and application of PHBV/NLT-HyA/ICA coaxial nanofiber scaffold in BTE. Reprinted with permission from [186]
Fig. 14.
Fig. 14.
A Photographs illustrating the surgical implantation procedure of CPH and CPHI scaffolds in rabbit bone defects (A1 and A2). Additionally, (A3) shows the defect control group covered by connective tissue after 12 weeks. B The progression of new bone formation in the CPH and CPHI groups over 4, 8, and 12 weeks (B1-B6). C Present representative X-ray images evaluating the level of regenerated bone tissue after 4-12 weeks (C1-C9). D reconstruction images revealed the distinct reparative effects of the CPH and CPHI scaffolds after 4-12 weeks (D1-D9). Red arrows indicate bone density, red dotted circles highlight defect areas, and red arrows denote areas of dense bone regeneration. Reprinted with permission from [160]
Fig. 15.
Fig. 15.
A The visual representation of rabbit tibias after 8 weeks of treatment with VCS-L, VCS-H, and VCS-icariin; B 3D reconstruction illustrating the bone defects in the tibia of rabbits in the bone infection model group following 8 weeks of treatment with VCS-L, VCS-H, and VCS-icariin; C 3D reconstruction displaying the bone defect in the region of interest in the model, VCS-L, VCS-H, and VCS-icariin groups (C). Reprinted with permission from [191]
Fig. 16
Fig. 16
In vivo attenuation of osteoporosis following ICA stimulation. A Schematic representation of animal tests; B Representative 3D micro-CT images illustrating bone tissue, with magnified areas showing cross-sections in 2D and partial bone volume in 3D; C Quantitative assessment of bone tissue parameters (BV/TV, Tb⋅Th, Tb. N, Tb. Pf, and SMI) (n = 6); D TRAP staining of bone tissue across the groups; E Quantitative analysis of pathological slices (n = 6). *p < 0.05 vs. Sham, #p < 0.05 vs. OVX, &p < 0.05 vs. ICA, $p < 0.05 vs. 3-MA, **p < 0.01 vs. Sham, ##p < 0.01 vs. OVX, &&p < 0.01 vs. ICA, $$p < 0.01 vs. 3-MA. Reprinted with permission from [197]

Similar articles

Cited by

References

    1. Khiyali Z, et al. Smoking, alcohol consumption, drug abuse, and osteoporosis among older adults: a cross-sectional study on PERSIAN cohort study in Fasa. BMC Geriatr. 2024;24(1):80. doi: 10.1186/s12877-024-04678-y. - DOI - PMC - PubMed
    1. Boschitsch E, Durchschlag E, Dimai H. Age-related prevalence of osteoporosis and fragility fractures: real-world data from an Austrian Menopause and Osteoporosis Clinic. Climacteric. 2017;20:1–10. doi: 10.1080/13697137.2017.1282452. - DOI - PubMed
    1. Xu Y, et al. Unraveling of Advances in 3D-Printed Polymer-Based Bone Scaffolds. Polymers (Basel) 2022;14(3):566. doi: 10.3390/polym14030566. - DOI - PMC - PubMed
    1. El Demellawy D, et al. Brief Review on Metabolic Bone Disease. Acad Forensic Pathol. 2018;8(3):611–640. doi: 10.1177/1925362118797737. - DOI - PMC - PubMed
    1. Sözen T, Özışık L, Başaran N. An overview and management of osteoporosis. Eur J Rheumatol. 2017;4(1):46–56. doi: 10.5152/eurjrheum.2016.048. - DOI - PMC - PubMed

LinkOut - more resources