. 2024 Apr 22;25(1):105.
doi: 10.1186/s13059-024-03243-5.

Ki-67 is necessary during DNA replication for fork protection and genome stability

Affiliations

Ki-67 is necessary during DNA replication for fork protection and genome stability

Konstantinos Stamatiou et al. Genome Biol. .

Abstract

Background: The proliferation antigen Ki-67 has been widely used in clinical settings for cancer staging for many years, but investigations on its biological functions have lagged. Recently, Ki-67 has been shown to regulate both the composition of the chromosome periphery and chromosome behaviour in mitosis as well as to play a role in heterochromatin organisation and gene transcription. However, how the different roles for Ki-67 across the cell cycle are regulated and coordinated remain poorly understood. The progress towards understanding Ki-67 function have been limited by the tools available to deplete the protein, coupled to its abundance and fluctuation during the cell cycle.

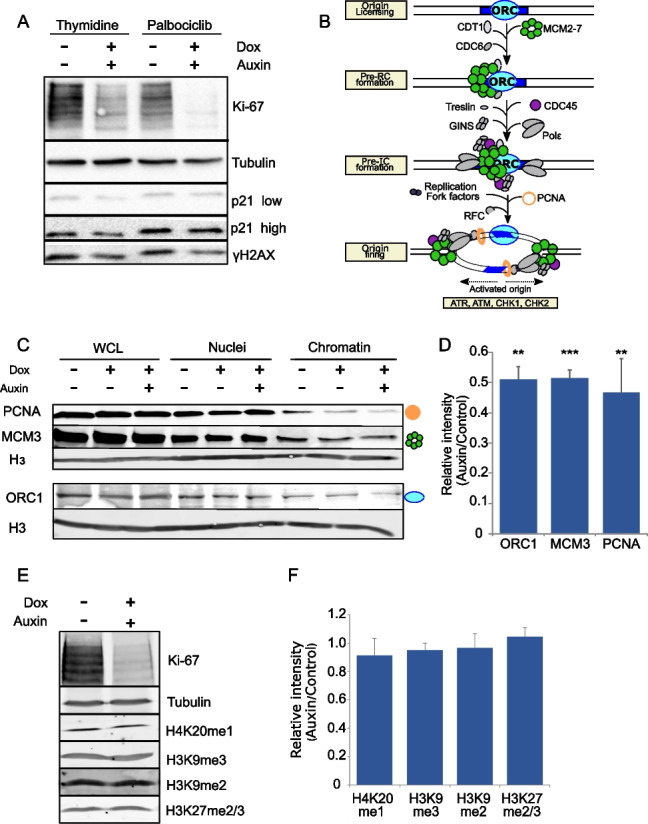
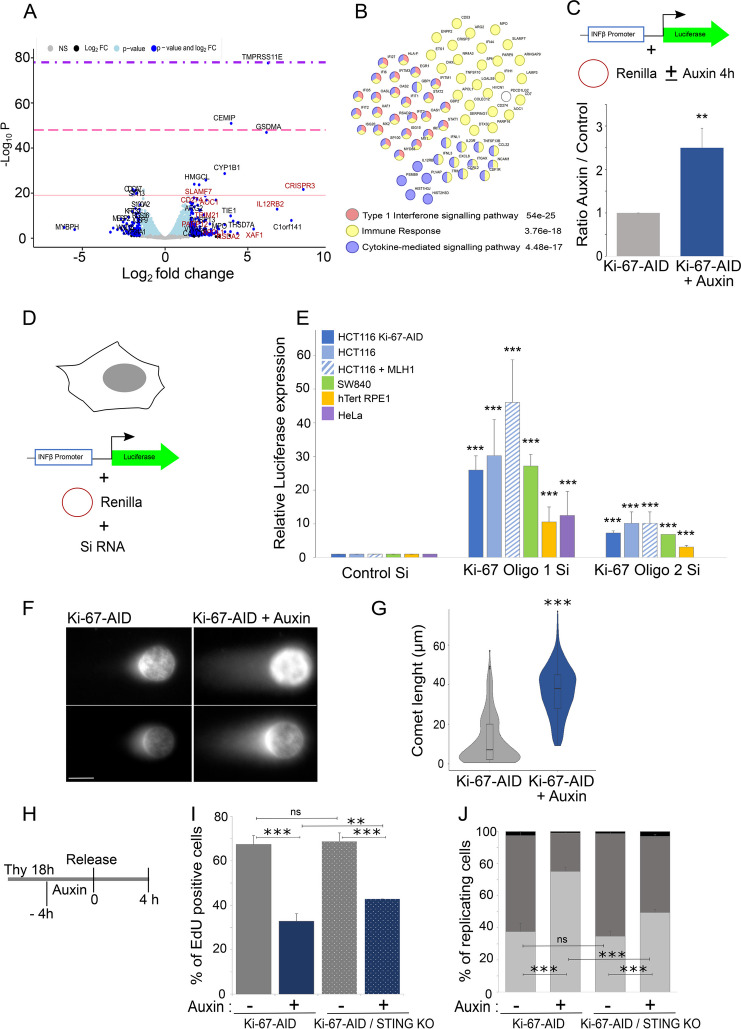
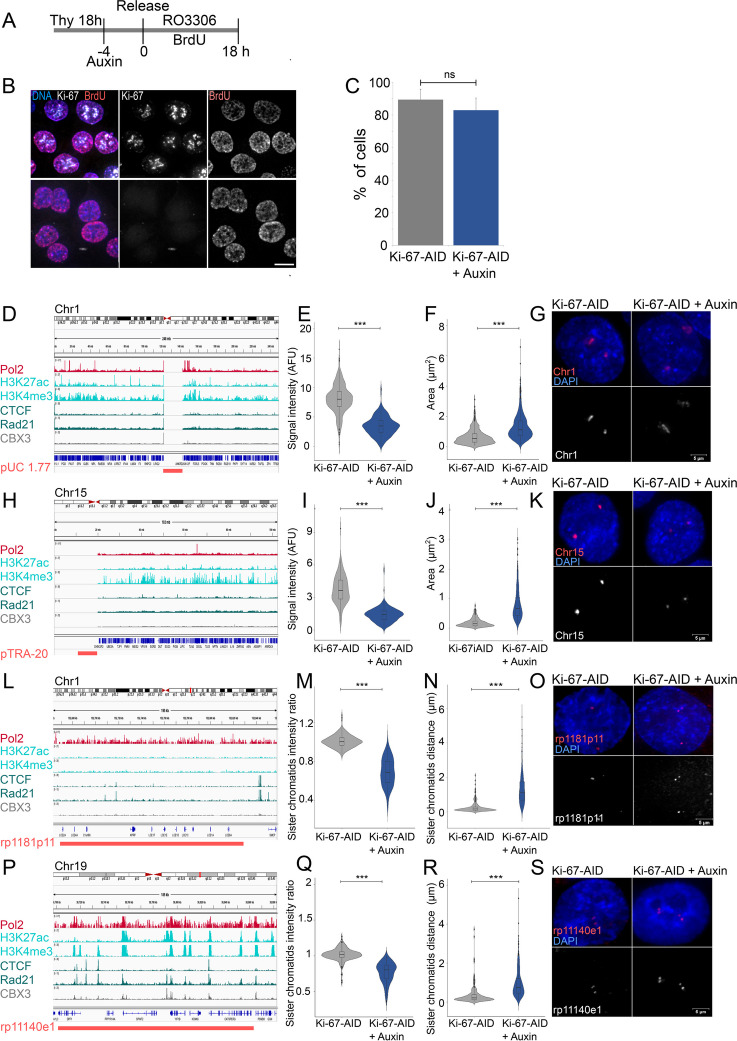
Results: Here, we use a doxycycline-inducible E3 ligase together with an auxin-inducible degron tag to achieve a rapid, acute and homogeneous degradation of Ki-67 in HCT116 cells. This system, coupled with APEX2 proteomics and phospho-proteomics approaches, allows us to show that Ki-67 plays a role during DNA replication. In its absence, DNA replication is severely delayed, the replication machinery is unloaded, causing DNA damage that is not sensed by the canonical pathways and dependent on HUWE1 ligase. This leads to defects in replication and sister chromatids cohesion, but it also triggers an interferon response mediated by the cGAS/STING pathway in all the cell lines tested.

Conclusions: We unveil a new function of Ki-67 in DNA replication and genome maintenance that is independent of its previously known role in mitosis and gene regulation.

Keywords: AID tag; APEX2; DNA damage; DNA replication; HUWE1; Interferon response; Ki-67; Sister chromatid cohesion.


Conflict of interest statement

The authors declare that they have no competing interests.

Figures

Fig. 1
Fig. 1
Ki-67 degradation delays S phase progression. A Scheme of Ki-67 protein structure and domains (Ki-67 wt) and the endogenously tagged version (Ki-67-AID) generated in the HCT116 cell line. B Representative image of the HCT116:Ki-67-AID cell line without (top panels) and with (bottom panels) auxin. Ki-67 is in green and DNA in blue. Scale bar 10 μm. C Growth curves of the HCTT116 parental (Ki-67 wt) and degron tagged HCT116:Ki-67-AID (Ki-67-AID) cell lines without and with (+ auxin) doxycycline and auxin. The values represent the average of 4 independent experiments. The error bars represent the standard deviations. D Flowcytometry profiles of the HCT116:Ki-67-AID cell line grown with (auxin—right) and without (control—left) auxin. The numbers represent the percentage of cells in each stage: green G1; yellow S; cyan G2/M. E Scheme of the experiment for (F-H). EdU was added 30′ before each time point. Thy = thymidine. F The graph represents the percentage of cells EdU positive at the different time points. The values are the average of 5 biological replicas and the error bars represent the standard deviations. Sample sizes: control 3 h = 723, 4 h = 922, 6 h = 847; auxin: 3 h = 1207, 4 h = 1108, 6 h = 1037. The data were statistically analysed with a chi-squared test (control vs auxin). ***p < 0.001. G Representative images of EdU patterns for early (bottom panel), middle (middle panel) and late (top panel). H Distribution of the replicating cells according to the patterns shown in (G) from the experiment in (FH). I Scheme of the experiment for (JK). EdU was added 30′ before each time point. Thy = thymidine. J The graph represents the percentage of EdU positive cells at the different time points. The values are the average of 3 biological replicas and the error bars represent the standard deviations. Samples size: control: 6 h = 570, 8 h = 758; auxin: 6 h = 945, 8 h = 813. The data were statistically analysed with a chi-squared test (control vs auxin). ***p < 0.001. K Distribution of the replicating cells according to the patterns shown in (G) from the experiment in (JK)
Fig. 2
Fig. 2
Ki-67 degradation leads to collapse of the replication machinery. A Western blot of HCT116:Ki-67-AID cell line blocked with either thymidine or palbociclib 18 h and then treated with or without auxin for 4 h. The blots were probed with antibodies against Ki-67 (first panel), alpha-tubulin (second panel), p21 (third and fourth panels) and γH2AX (fifth panel). B Scheme of how the replisome sequentially assembles and activates. C Representative Western blot of cell fractions (WCL = whole cell lysate, nuclei, and chromatin) of HCT116:Ki-67-AID cell line blocked with thymidine for 18 h and then treated with or without auxin for 4 h. The blots were probed with antibodies against PCNA (first panel), MCM3 (second panel), histone H3 (third and fifth panels) and ORC1 (fourth panel). The images were acquired with a LICOR instrument in the linear range for quantification purposes. The graphic symbol on the right represents the different proteins depicted in the scheme in (B). D Quantification of the blot in (C). The values represent the average of 3 independent replicas and the error bars the standard deviations. The experiments were analysed by Student’s t-test. **p < 0.01, ***p < 0.001. E Representative Western blot of WCL of the HCT116:Ki-67-AID cell line blocked with thymidine 18 h and then treated with or without auxin for 4 h. The blots were probed with antibodies against Ki-67 (first panel), alpha-tubulin (second panel), H3K20me1 (third panel), H3K9me3 (fourth panel), H3k9me2 (fifth panel) and H3k27me2/3 (sixth panel). The images were acquired with a LICOR instrument in the linear range for quantification purposes. F Quantification of the blot in (E). The values represent the average of 3 independent replicas and the error bars the standard deviations. The experiments were analysed by Student’s t-test and did not display any statistically significant changes (ns)
Fig. 3
Fig. 3
Ki-67 degradation activates the interferon response pathway. A Volcano plot of the differentially expressed genes obtained by RNA-seq of the HCT116:Ki-67-AID cell line blocked with thymidine for 18 h and then treated with or without auxin for 4 h. In red are indicated genes that belong to the interferon response. The pink line represents p-value < 10e−20, the hot pink line p-value = 10e−20–10e−30 and the purple line p-value = 10e−20–10e−60. B STRING analyses of the upregulated genes. The numbers next to the categories represent the false discovery rate. C HCT116:Ki-67-AID cells were transfected with a plasmid carrying the luciferase gene under the control of the Interferon β promoter together with a plasmid carrying Renilla. Cells were treated with thymidine for 18 h, then with auxin for 4 h, and released in RO3306 for 18 h. The graph represents the luciferase activation normalised to Renilla in cells untreated (Ki-67-AID) or treated with auxin for 4 h (Ki-67-AID auxin). The values represent the average of 3 independent experiments, and the error bars are the standard deviations. The experiments were analysed by Student’s t-test. **p < 0.01. D Scheme for the transfection set-up used for the experiments in (E). E Quantification of the luciferase essays performed as in (D) at 72 h post-transfection for the different cell lines. Oligo 1 and oligo 2 are two independent oligos against Ki-67. The values represent the average of 3 independent replicas, and the error bars are the standard deviations. The experiments were analysed by Student’s t-test. ***p < 0.001. F Representative images of the comet essay of the HCT116:Ki-67-AID cell line blocked with thymidine 18 h and then treated with or without auxin for 4 h. G Quantification of the comet length. The violin plots represent the distribution of the comet tail length in μm. The box inside the violin represents the 75th and 25th percentile, whiskers are the upper and lower adjacent values and the line is the median. A Wilcoxon test was conducted for comparing the experiments and ***p < 0.001. Sample size: control = 234, auxin = 225. H Scheme of the experiment in (I) and (J). I The graph represents the percentage of EdU positive cells for HCT116:Ki-67-AID wt without (−) and with (+) auxin and HCT116:Ki-67-AID STING KO without (−) and with (+) auxin. The values are the average of 2 biological replicas, and the error bars represent the standard deviations. Samples size: HCT116:Ki-67-AID (−)auxin = 224, (+)auxin = 243, HCT116:Ki-67-AID STING KO (−)auxin = 290, (+)auxin = 236. The data were statistically analysed with a chi-squared test. **p < 0.01, ***p < 0.001. J Distribution of the replicating cells according to the patterns shown in (Fig. 1G) from the experiment in (HI). The data were statistically analysed with a chi-squared test. ***p < 0.001, ns = not significant
Fig. 4
Fig. 4
Ki-67 is in proximity of the replication machinery during S phase. A Scheme of Ki-67-APEX2 tagged protein. B Representative images of the HCT116:Ki-67-APEX2 cell line treated with biotin for 30 min and then with or without H2O2 for 1 min. The cells were fixed and stained with RFP-streptavidin and DAPI. Scale bars 5 μm. C Scheme of the SILAC experiment. Drawing made with BioRender. D STRING analyses of the APEX proteome from the experiment in C. E Reactome pathway enrichment analyses of the Ki-67 interacting proteins form the experiment in (C). F Western blot of HCT116 (C) or HCT116:Ki-67-APEX2 (APEX2) probed with antibodies against MCM3 (top panels) and PCNA (bottom panels). G Violin plot of the quantification of the experiment in (H). The box inside the violin represents the 75th and 25th percentile, whiskers are the upper and lower adjacent values and the line is the median. Sample size: control = 114, auxin = 99. A Wilcoxon test was conducted for comparing the experiments and ***p < 0.001. H Representative images of the proximity ligation assay (PLA) using anti-MCM3 and anti-GFP antibodies on HCT116:Ki-67-AID cell line without (left) of with (right) auxin. Scale bar 5 μm. I Scheme of the experiment for (J) and (K). J Representative images of HCT116:Ki-67-AID cell line at different time points from the thymidine block release. The numbers represent the percentage of cells showing Ki-67 appearing as foci at the nuclear periphery. Cells were stained with DAPI. The yellow arrows indicate the foci. Scale bar 5 μm. K Representative images of HCT116:Ki-67-AID cell line at early (top panels), middle (middle panels) and late (bottom panels) replication stages and stained with anti-BrdU antibodies and DAPI. Scale bar 5 μm. 1 and 2 boxed regions in the left panels represent the enlarged images on the right. The frame colour of the enlargements indicates the specific channel
Fig. 5
Fig. 5
Ki-67 degradation leads to Huwe1 activation. A STRING analyses of proteins form the APEX2 proteome that are linked to DNA replication (circled in blue). B STRING representation of known HUWE1 interactors. C Scheme of the experiment for (D) and (E). D Quantification of the experiment in (E). The values represent the average of 5 independent biological replicas for the MG132 experiment and 2 independent biological replicas for the BI8626 experiment; the error bars show the standard deviations. The experiments were analysed by chi-squared test. ***p < 0.001. E Representative images of the experiments as indicated in (C). The cells were fixed and stained for H2AX (red) and counterstained with DAPI (blue). Sample size: control = 560, control (MG132) = 620, control (BI8626) = 240, auxin = 578, auxin (MG132) = 531, auxin (BI8626) = 234. Scale bar 5 μm. FH Representative Western blot analyses of HCT116:Ki-67-AID cell line of the experiment as indicated in C (top). The blots were probed with anti-alpha tubulin or anti-GAPDH antibodies and with anti-H2AX (F), p53 (G) and CHK1 (H). The images were acquired with a LICOR machine in the linear range for quantification purposes. The graphs at the top represent the quantification of the blots. The values represent the average of 3 independent replicas, and the error bars are the standard deviations. The experiments were analysed by Student’s t-test. *p < 0.05 **p < 0.01. I Expression levels of the indicated genes obtained from the RNA seq experiments described in Fig. 3A. The values represent the average of the 3 independent replicas, and the error bars are the standard deviations. The experiments were analysed by Student’s t-test. ns = not significant. J Representative Western blot analyses of HCT116:Ki-67-AID cell line blocked with thymidine for 18 h then untreated (Ki-67-AID) or treated with auxin for 4 h (Ki-67 AID auxin) in the presence (+) or absence (−) of BI8626. The blots were probed with anti-GAPDH and anti-p53 antibodies. The images were acquired with a LICOR instrument in the linear range for quantification purposes. The graph at the top represents the quantification of the blots. The values represent the average of 3 independent replicas, and the error bars are the standard deviations. The experiments were analysed by Student’s t-test test. **p < 0.01 ***p < 0.001
Fig. 6
Fig. 6
Changes in the phosphoproteome upon Ki-67 degradation at the G1/S boundary. A Scheme of the experiment. B Graphs representing the log2 ratio between heavy and light peptides and their normalised intensity. On the right are represented the proteins that were only found phosphorylated in the light sample (HCT116:Ki-67-AID + auxin). C Representations of the different protein groups enriched in the HCT116:Ki-67-AID + auxin phosphoproteome. The different colours relate to the named categories and the numbers represent the false discovery rate. The red and the blue circles highlight the DNA damage-related proteins and cohesin/regulator proteins respectively. DF List of the proteins and their phosphosites enriched in the HCT116:Ki-67-AID (control) and HCT116:Ki-67-AID + auxin (auxin) samples
Fig. 7
Fig. 7
Ki-67 degradation in S phase causes replication and sister chromatid cohesion defects. A Scheme of the experiment. B Representative images of the experiment in (A). Cells were fixed at the end of the experiment and stained with anti-BrdU antibodies. Sample size: control = 326, auxin = 345. Scale bar 5 μm. C Quantification of the experiment in (B). The data were analysed with a chi-squared test. ns = not significant. D, H, L, P IGV tracks of the regions selected for FISH analyses showing the chromosome position, Pol2, H3K27ac, H3K4me3, CTCF, Rad21 and CBX3 ChIP seq profiles form Encode and obtained from experiments in HCT116 cells. Magenta lines at the bottom represent the location of the probe selected for the satellite of chromosome 1 (D), satellite of chromosome 15 (H), single-copy low-expression region on chromosome 1 (L) and single-copy high-expression region on chromosome 19 (P). E, I Quantification of the intensity of the FISH signals in the HCT116:Ki-67-AID and HCT116:Ki-67-AID + auxin samples for the probes in D (E) and H (I). Sample size: E control = 279, auxin = 285, and I control = 309, auxin = 274. F, J Quantification of the area occupied by the FISH signals in the HCT116:Ki-67 AID and HCT116:Ki-67 AID + auxin samples for the probes in D (F) and H (J). M, Q Ratio of the FISH signals intensity between the two sister chromatids in the HCT116:Ki-67 AID and HCT116:Ki-67 AID + auxin samples for the probes in L (M) and P (Q). Sample size: M control = 214, auxin = 205, and Q control = 214, auxin = 237. N, R Distance of FISH signals between the two sister chromatids in the HCT116:Ki-67 AID and HCT116:Ki-67 AID + auxin samples for the probes in L (N) and P (R). Sample size: N control = 2, auxin = 246, and R control = 207, auxin = 220. All the data presented in the violin plots were statistically analysed with a Wilcoxon test. ***p < 0.001. The box inside the violin represents the 75th and 25th percentile, whiskers are the upper and lower adjacent values and the line is the median. G, K, O, S Representative images of the FISH signals obtained in HCT116:Ki-67-AID and HCT116:Ki-67-AID + auxin samples for the probes in D (G), H (K), L (O) and P (S). FISH signals in magenta and DNA in blue. Scale bar 5 μm

Similar articles

Cited by

References

    1. Gerdes J, Schwab U, Lemke H, Stein H. Production of a mouse monoclonal antibody reactive with a human nuclear antigen associated with cell proliferation. Int J Cancer. 1983;31:13–20. doi: 10.1002/ijc.2910310104. - DOI - PubMed
    1. Dowsett M, Nielsen TO, A'Hern R, Bartlett J, Coombes RC, Cuzick J, Ellis M, Henry NL, Hugh JC, Lively T, et al. Assessment of Ki67 in breast cancer: recommendations from the International Ki67 in Breast Cancer working group. J Natl Cancer Inst. 2011;103:1656–1664. doi: 10.1093/jnci/djr393. - DOI - PMC - PubMed
    1. Duregon E, Bertero L, Pittaro A, Soffietti R, Ruda R, Trevisan M, Papotti M, Ventura L, Senetta R, Cassoni P. Ki-67 proliferation index but not mitotic thresholds integrates the molecular prognostic stratification of lower grade gliomas. Oncotarget. 2016;7:21190–21198. doi: 10.18632/oncotarget.8498. - DOI - PMC - PubMed
    1. van Velthuysen ML, Groen EJ, van der Noort V, van de Pol A, Tesselaar ME, Korse CM. Grading of neuroendocrine neoplasms: mitoses and Ki-67 are both essential. Neuroendocrinology. 2014;100:221–227. doi: 10.1159/000369275. - DOI - PubMed
    1. de Andrade BA, Leon JE, Carlos R, Delgado-Azanero W, Mosqueda-Taylor A, de Almeida OP. Expression of minichromosome maintenance 2, Ki-67, and geminin in oral nevi and melanoma. Ann Diagn Pathol. 2013;17:32–36. doi: 10.1016/j.anndiagpath.2012.05.001. - DOI - PubMed

Publication types