

Spatial transcriptomics reveals segregation of tumor cell states in glioblastoma and marked immunosuppression within the perinecrotic niche
- PMID: 38650010
- PMCID: PMC11036705
- DOI: 10.1186/s40478-024-01769-0
Spatial transcriptomics reveals segregation of tumor cell states in glioblastoma and marked immunosuppression within the perinecrotic niche
Abstract
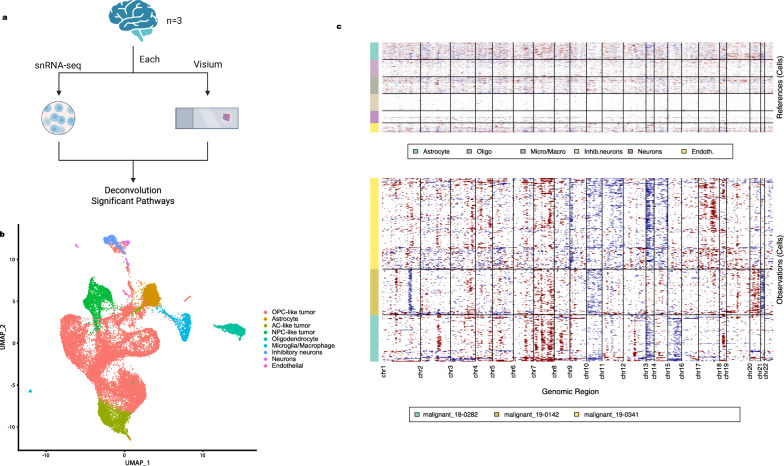
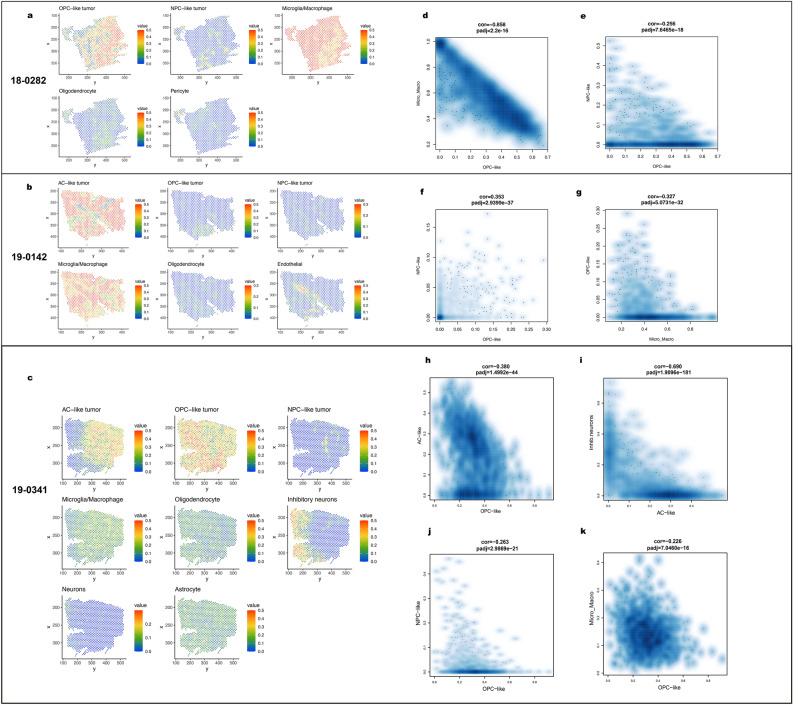
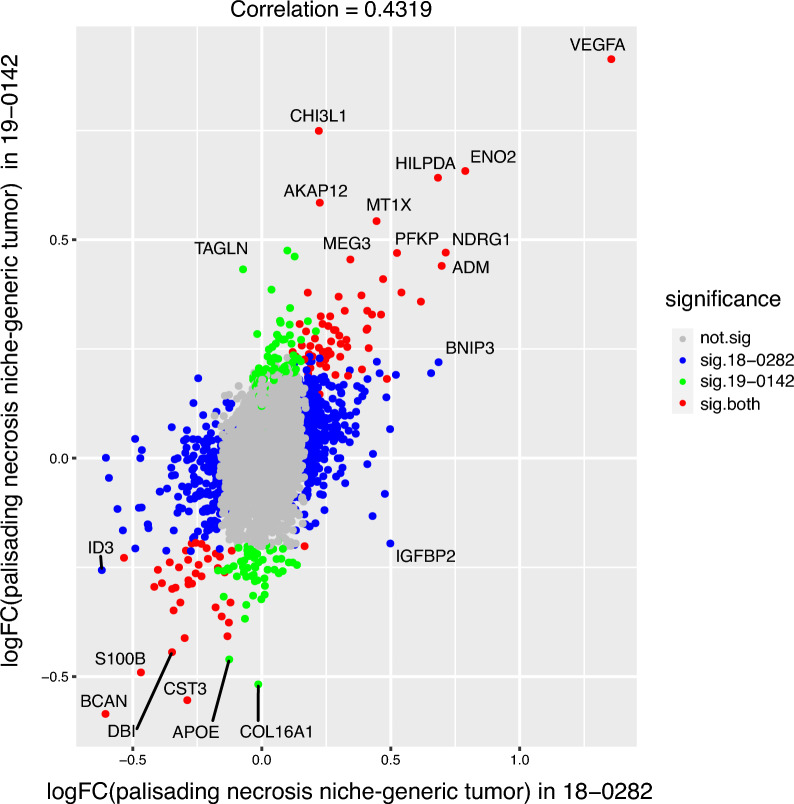
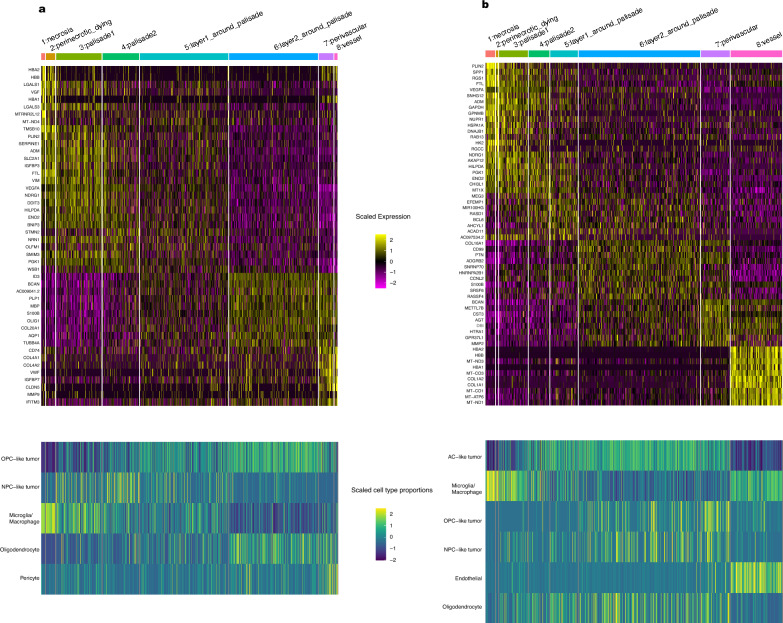
Glioblastoma (GBM) remains an untreatable malignant tumor with poor patient outcomes, characterized by palisading necrosis and microvascular proliferation. While single-cell technology made it possible to characterize different lineage of glioma cells into neural progenitor-like (NPC-like), oligodendrocyte-progenitor-like (OPC-like), astrocyte-like (AC-like) and mesenchymal like (MES-like) states, it does not capture the spatial localization of these tumor cell states. Spatial transcriptomics empowers the study of the spatial organization of different cell types and tumor cell states and allows for the selection of regions of interest to investigate region-specific and cell-type-specific pathways. Here, we obtained paired 10x Chromium single-nuclei RNA-sequencing (snRNA-seq) and 10x Visium spatial transcriptomics data from three GBM patients to interrogate the GBM microenvironment. Integration of the snRNA-seq and spatial transcriptomics data reveals patterns of segregation of tumor cell states. For instance, OPC-like tumor and NPC-like tumor significantly segregate in two of the three samples. Our differentially expressed gene and pathway analyses uncovered significant pathways in functionally relevant niches. Specifically, perinecrotic regions were more immunosuppressive than the endogenous GBM microenvironment, and perivascular regions were more pro-inflammatory. Our gradient analysis suggests that OPC-like tumor cells tend to reside in areas closer to the tumor vasculature compared to tumor necrosis, which may reflect increased oxygen requirements for OPC-like cells. In summary, we characterized the localization of cell types and tumor cell states, the gene expression patterns, and pathways in different niches within the GBM microenvironment. Our results provide further evidence of the segregation of tumor cell states and highlight the immunosuppressive nature of the necrotic and perinecrotic niches in GBM.
Keywords: Glioblastoma; Perinecrotic niche; Perivascular niche; Single-cell sequencing; Spatial transcriptomics; Tumor microenvironment.
© 2024. The Author(s).
Conflict of interest statement
APP is a consultant for and has an equity interest in Sygnomics, and APP and GYL are consultants for Servier Pharmaceuticals; these are unrelated to the research presented herein. The remaining authors have no relevant competing interests to declare.
Figures
References
-
- Board WC of TE (2021) WHO Classification of tumours of the central nervous system. International Agency for Research on Cancer, Lyon, France
-
- Controlling the False Discovery Rate: A Practical and Powerful Approach to Multiple Testing-Benjamini-1995-Journal of the Royal Statistical Society: Series B (Methodological) - Wiley Online Library. https://rss.onlinelibrary.wiley.com/doi/abs/10.1111/j.2517-6161.1995.tb0.... Accessed 11 Oct 2023
Publication types
MeSH terms
Grants and funding
LinkOut - more resources
Full Text Sources
Medical
Miscellaneous
