. 2024 Aug;18(8):2020-2041.
doi: 10.1002/1878-0261.13625. Epub 2024 Apr 22.

Kinase activities in pancreatic ductal adenocarcinoma with prognostic and therapeutic avenues

Affiliations

Kinase activities in pancreatic ductal adenocarcinoma with prognostic and therapeutic avenues

Andrea Vallés-Martí et al. Mol Oncol. 2024 Aug.

Abstract

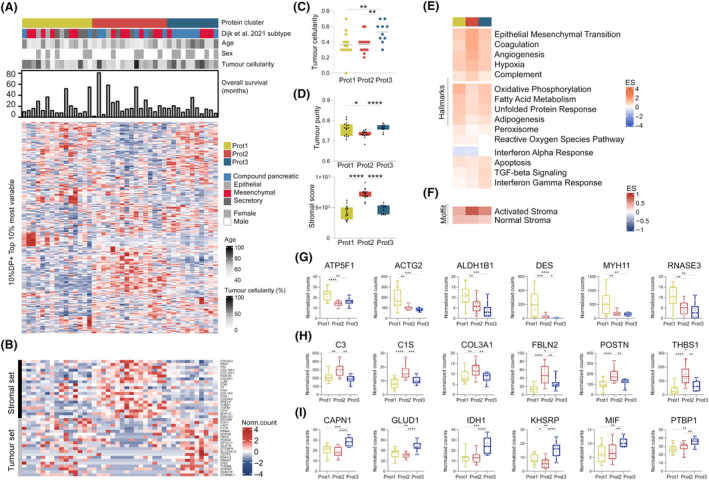
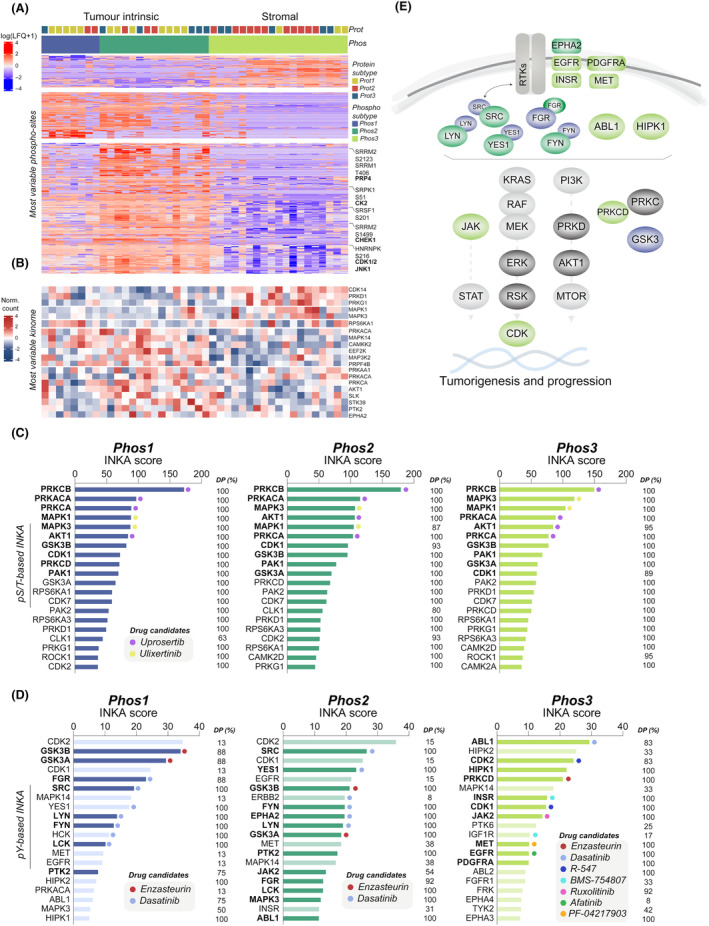
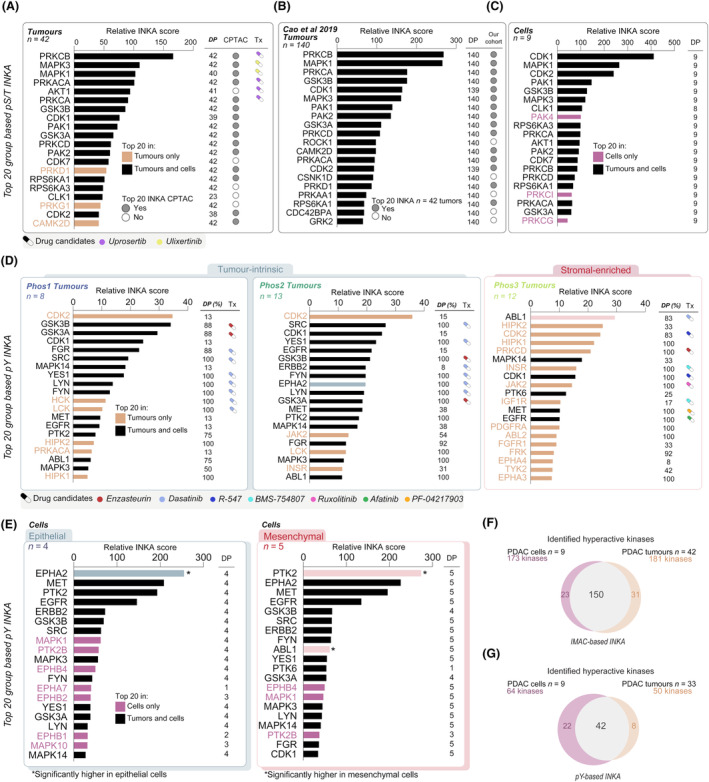
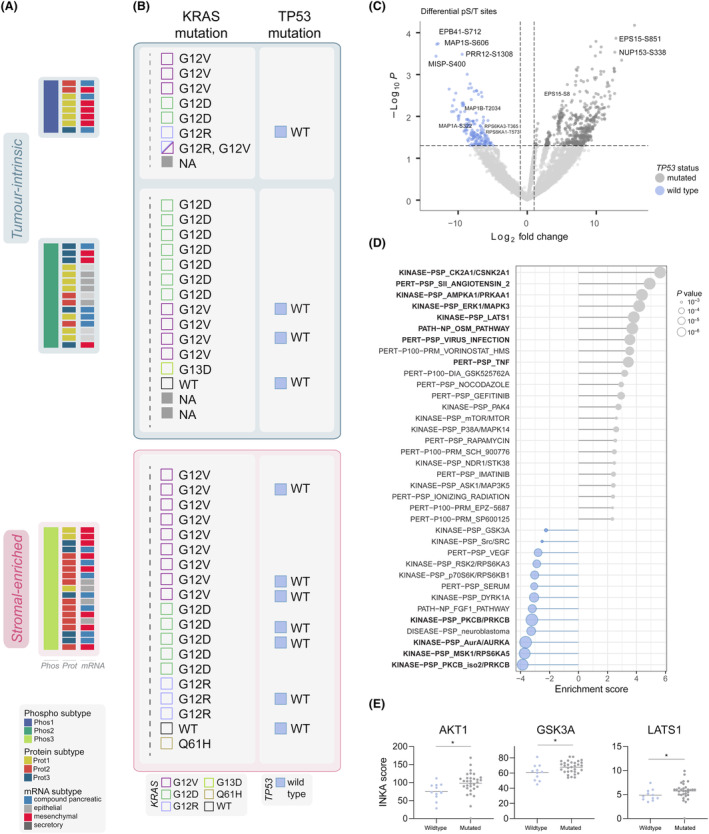
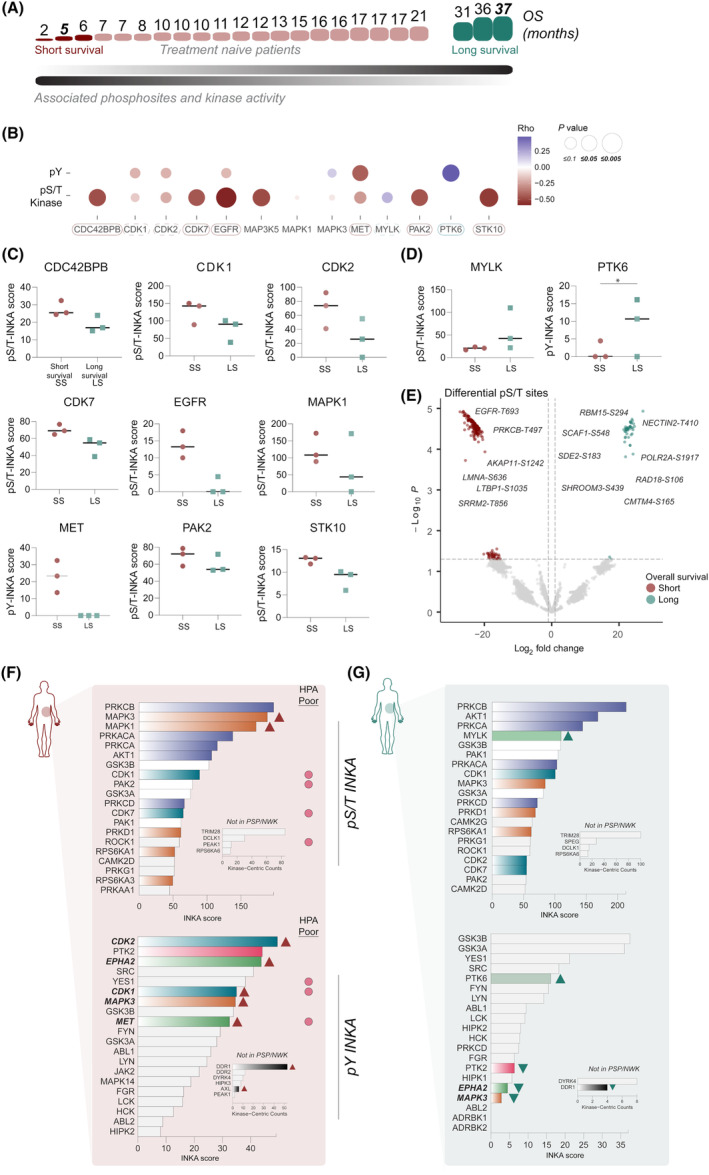
Pancreatic ductal adenocarcinoma (PDAC) is a devastating disease with a limited number of known driver mutations but considerable cancer cell heterogeneity. Phosphoproteomics provides a direct read-out of aberrant signaling and the resultant clinically relevant phenotype. Mass spectrometry (MS)-based proteomics and phosphoproteomics were applied to 42 PDAC tumors. Data encompassed over 19 936 phosphoserine or phosphothreonine (pS/T; in 5412 phosphoproteins) and 1208 phosphotyrosine (pY; in 501 phosphoproteins) sites and a total of 3756 proteins. Proteome data identified three distinct subtypes with tumor intrinsic and stromal features. Subsequently, three phospho-subtypes were apparent: two tumor intrinsic (Phos1/2) and one stromal (Phos3), resembling known PDAC molecular subtypes. Kinase activity was analyzed by the Integrative iNferred Kinase Activity (INKA) scoring. Phospho-subtypes displayed differential phosphorylation signals and kinase activity, such as FGR and GSK3 activation in Phos1, SRC kinase family and EPHA2 in Phos2, and EGFR, INSR, MET, ABL1, HIPK1, JAK, and PRKCD in Phos3. Kinase activity analysis of an external PDAC cohort supported our findings and underscored the importance of PI3K/AKT and ERK pathways, among others. Interestingly, unfavorable patient prognosis correlated with higher RTK, PAK2, STK10, and CDK7 activity and high proliferation, whereas long survival was associated with MYLK and PTK6 activity, which was previously unknown. Subtype-associated activity profiles can guide therapeutic combination approaches in tumor and stroma-enriched tissues, and emphasize the critical role of parallel signaling pathways. In addition, kinase activity profiling identifies potential disease markers with prognostic significance.

Keywords: kinase activity; pancreatic ductal adenocarcinoma; personalized medicine; phosphoproteome.


Conflict of interest statement

MFB has received research funding from Celgene, Frame Therapeutics, and Lead Pharma. He has acted as a consultant to Servier. None of these were involved in the design of the study or the drafting of this manuscript.

Figures

Fig. 1
Fig. 1
Proteome subtyping of PDAC tumor tissues. (A) Proteome subtypes generated by consensus clustering (see Fig. S5). Hierarchical clustering was built with the normalized protein counts after a 10% DP and top 10% most variable by median absolute deviation (MAD) filtering. Corresponding age, sex, tumor cellularity, overall survival in months, mRNA [28] and protein subtypes were annotated. (B) Enriched stromal and tumor markers from microdissected pancreatic ductal adenocarcinoma (PDAC) proteome by Le Large et al. [46]. (C) Tumor cellularity assessed by a pathologist per protein cluster, significantly different by Kruskal–Wallis test, P = 0.0072. Two group comparisons tested by Mann–Whitney t‐test. (D) ESTIMATE‐based tumor purity per protein cluster, significantly different by Kruskal–Wallis test, P = 0.0257, and ESTIMATE‐based stromal content per protein cluster, significantly different by Kruskal–Wallis test, P < 0.0001. Two group comparisons tested by Mann–Whitney test. (E, F) Single‐sample gene set enrichment analysis (ssGSEA) averaged enrichment score (ES) of signatures Hallmarks and Moffit activated and normal stroma [43]. (G–I) Example of proteins differentially expressed with P ≤ 0.05 in Prot1 cluster, Prot2 cluster, and Prot3 cluster. Significance was performed using non‐parametric Kruskal–Wallis test (three group comparison) and Mann–Whitney test (two group comparison). See also Figs S4 and S5, and Table S2. *P < 0.05, **P < 0.01, ***P < 0.001, ****P < 0.0001.
Fig. 2
Fig. 2
Phosphoproteome analysis of PDAC tumor tissues. (A) Hierarchical clustering of label free quantitation (LFQ) intensities of differentially phosphorylated serine and threonine (pS/T) sites between phosphoproteome subtypes (three group comparison, n = 973, FDR ≤ 0.05, Table S3), obtained by consensus clustering (see Fig. S5). (B) Phospho‐kinase abundance of most variable kinome subset (top 20%) based on pS/T phosphoproteomics. (C, D) Kinase activity profiles based on Integrative iNferred Kinase Activity (INKA) scores in Phos1‐3 at (C) pS/T level (Table S4) and (D) phosphotyrosine (pY) level (Table S5). Significantly different pY‐kinase activities between subtypes (using Mann–Whitney test, see Fig. S8 for P values) are annotated by a darker color and a bold font. DP across tumor samples is annotated in percentage. Drug candidates were selected based on drug‐kinase relationships and target inhibition efficacy [118]. (E) Mapped kinase signaling from pS/T and pY INKA profiles enriched in Phos1‐3 pancreatic ductal adenocarcinoma (PDAC) subtypes (only significant from Fig. S8 were annotated).
Fig. 3
Fig. 3
Overlapping kinase activity profiling in SPACIOUS and CPTAC tumor cohorts and PDAC cell lines. (A) Phosphorylated serine and threonine (pS/T) Integrative iNferred Kinase Activity (INKA) group‐based profiles of pancreatic ductal adenocarcinoma (PDAC) tumors of SPACIOUS cohort (n = 42), (B) of CPTAC cohort [23] (n = 140) and (C) of a PDAC cell panel (n = 9) [26]. Top 20 INKA kinase presence in tumors and cells is annotated by orange and magenta colors, respectively. Drug candidates are annotated in relation to Fig. 2. (D) Phosphotyrosine (pY) INKA group‐based profiles of PDAC tumors of Phos1, Phos2 and Phos3 from the SPACIOUS cohort (n = 33). Target candidates vary per Phos subtype related to Fig. 2 and Fig. S8. (E) pY INKA group‐based profiles of a PDAC cell panel (n = 9), containing four epithelial cell lines and five mesenchymal cell lines. Significance of differential kinase activities (EPHA2 P = 0.0124, PTK2 P = 0.049) by Mann–Whitney test was annotated with an asterisk (*) from previous study [26]. Kinases EPHA2 and ABL1, associated to tumor intrinsic and to stromal subtypes, were annotated in green and salmon shade, respectively. (F, G) Overlapping INKA kinases between PDAC cell lines and tumors at (F) pS/T level and (G) pY level.
Fig. 4
Fig. 4
Association of KRAS and TP53 gene mutations with phosphoproteome signatures. (A) Phosphoproteome and proteome subtypes annotated with transcriptomics Dijk et al. subtypes [28]. (B) KRAS mutation status and allele variants and TP53 mutation status (see Table S6). (C) Differentially phosphorylated serine and threonine (pS/T) sites (n = 710) in TP53 mutated (n = 31) and TP53 wild type (n = 11) tumors with a fold change cut off of two and P ≤ 0.05. Two‐group comparison was performed using unpaired t‐test in limma statistics. Differential sites were involved in EGFR internalization (i.e., ANKRD13D‐T556, REPS1‐S174, EPS15‐S851), microtubule dynamics and mitotic regulators (i.e., MAP1B‐T2034, MISP‐S400, EPB41‐S712, MAP1S‐S606), cytoskeleton and EMT (FLNA‐S968, VCAN‐T2115) and downstream ERK signaling (RPS6KA3‐T365, RPS6KA1‐T573, NUP153‐S338). See also Table S9. (D) Global post‐translational modification signature enrichment (PTM‐SEA) analysis between TP53 mutated and TP53 wild type samples. In bold, significant signatures by adjusted P ≤ 0.05. (E) Integrative iNferred Kinase Activity (INKA) of phosphorylated serine and threonine (pS/T) kinases significantly enriched in TP53 mutated tumors. Significance, annotated with an asterisk, was performed using Mann–Whitney test.
Fig. 5
Fig. 5
Kinase activity in short and long survival (treatment naïve) patients. (A) Spearman correlation of phosphorylated serine and threonine (pS/T)‐based Integrative iNferred Kinase Activity (INKA) kinases. (B) Overview of Spearman correlation coefficients and P values between INKA kinases at phosphotyrosine (pY) and pS/T level and overall survival in treatment naïve patient subset. Boxes suggest kinase relevance in prognosis outcomes. (C) Elevated INKA scores of pS/T and pY‐based kinases in short survival (SS) patients. Short and long survival groups were defined with patients with opposing outcomes. (D) Elevated INKA scores of pS/T and pY‐based kinases in long survival (LS) patients. *P = 0.0406, significance performed using Mann–Whitney test. (E) Volcano plot representing differential pS/T sites between poor and better survival patients (3 vs 3) with fold change two and P ≤ 0.05. Two‐group comparison was performed using unpaired t‐test in limma statistics. See also Table S10. (F) pS/T and pY‐based INKA profile of poor survival patient (overall survival, OS = 5 months). Significant poor prognostic markers by Human Protein Atlas (HPA) were annotated. (G) pS/T and pY‐based INKA profile of long survival patient (OS = 37 months). For both patients, kinase‐centric counts of kinases with no kinase‐substrate relations in PSP/NWK are also displayed. INKA kinases were colored to pinpoint common members of signaling pathways and to highlight the differences between patients.

Similar articles

References

    1. Mizrahi JD, Surana R, Valle JW, Shroff RT. Pancreatic cancer. Lancet. 2020;395:2008–2020. - PubMed
    1. Rahib L, Smith BD, Aizenberg R, Rosenzweig AB, Fleshman JM, Matrisian LM. Projecting cancer incidence and deaths to 2030: the unexpected burden of thyroid, liver, and pancreas cancers in the United States. Cancer Res. 2014;74(11):2913–2921. - PubMed
    1. Strobel O, Lorenz P, Hinz U, Gaida M, König AK, Hank T, et al. Actual five‐year survival after upfront resection for pancreatic ductal adenocarcinoma: who beats the odds? Ann Surg. 2022;275(5):962–971. - PubMed
    1. Springfeld C, Ferrone CR, Katz MHG, Philip PA, Hong TS, Hackert T, et al. Neoadjuvant therapy for pancreatic cancer. Nat Rev Clin Oncol. 2023;20(5):318–337. - PubMed
    1. Collisson EA, Bailey P, Chang DK, Biankin AV. Molecular subtypes of pancreatic cancer. Nat Rev Gastroenterol Hepatol. 2019;16(4):207–220. - PubMed