

Review
doi: 10.1021/acs.analchem.4c01510.
Epub 2024 Apr 22.
Lab on a Particle Technologies
Affiliations
- PMID: 38650433
- PMCID: PMC11112544
- DOI: 10.1021/acs.analchem.4c01510
Item in Clipboard
Review
Lab on a Particle Technologies
Anal Chem.
.
No abstract available
Conflict of interest statement
The authors declare the following competing financial interest(s): D.D. and the Regents of the University of California have financial interests in Partillion Bioscience which is commercializing Lab on a Particle technology.
Figures
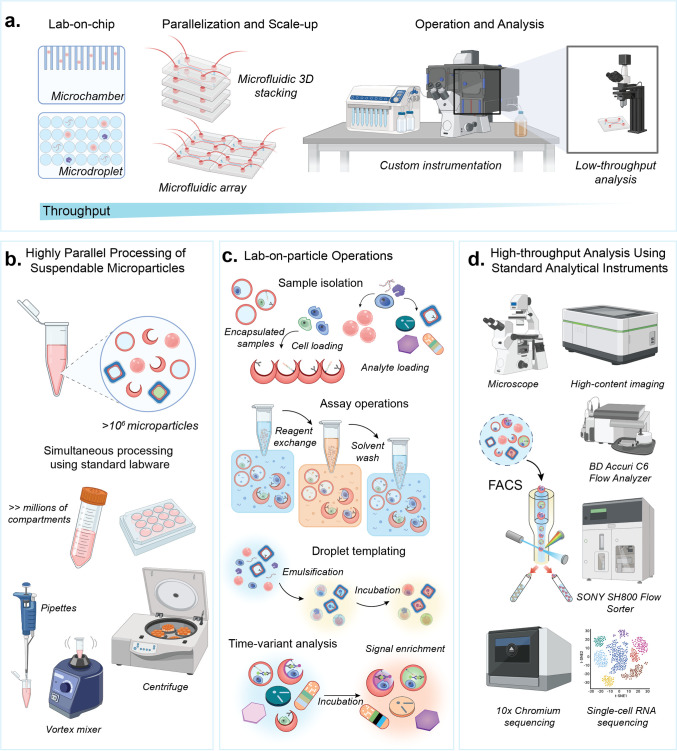
From lab
on a chip to lab on a particle. (a) Lab on a chip technology
uses microchambers or droplets to confine reactions, enabling the
analysis of target cells or molecules with high precision. Parallelization
and scale-up rely on the 2D surfaces of chips and custom instrumentation,
which often lead to reduced analysis throughput. (b) Lab on a particle
technology enables millions of microparticle-based compartments to
be scaled in 3D in standard tubes, where fluidic operations are performed
using standard laboratory equipment. (c) Operations on particles include
cell loading and encapsulation, analyte binding, reagent exchange
and washing, and templating of water-in-oil emulsions. Signal enrichment
can occur on particles through reactions that are either confined
or locally bound. Microparticles are barcoded by shape, size, pattern,
color, or other means to enable time-variant analysis as reactions
or cell behavior progresses over time. (d) Microparticles are analyzed
using standard analytical instruments compatible with cells, such
as microscopes, flow cytometers, fluorescence activated cell sorters
and single-cell sequencing instruments.
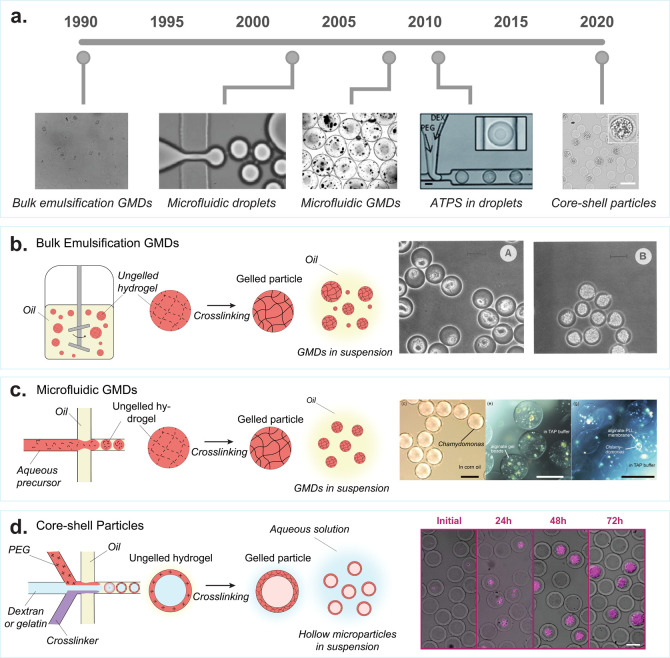
Evolution of cell encapsulation in hydrogel drops for single-cell
analysis. (a) Some of the first hydrogel microparticles for cell and
protein screening were made using bulk emulsification methods, producing
polydisperse agarose particles called gel microdrops (GMDs). [Reprinted
with permission from Macmillan Publishers Ltd.: Nature, Weaver, J.
C., et al. Nat Biotechnol1988, 6 (9), 1084–1089 (ref (41)) Copyright 1988.] Droplet microfluidics became
popular in the early 2000s [Reprinted with permission from ref (42). Anna, S. L., et al. Applied Physics Letters2003, 82 (3), 364–366, 2003 licensed under a Creative Common Attribution
(CC BY) license], which was later used to encapsulate cells in uniform
GMDs [Reproduced from On-Chip Alginate Microencapsulation of Functional
Cells Workman, V, et al. Macromol. Rapid Commun.2008, 29 (2), 165–170 (ref (43)) Copyright 2008 Wiley].
The first studies of aqueous two-phase systems in microfluidic droplets
started in the early 2010s. Scale bar is 50 μm. [Reproduced
from Vijayakumar, K., et al. Chemical Science2010, 1 (4), 447–452 (ref (44)) with permission from
The Royal Society of Chemistry.] This led to the development of hollow
hydrogel microparticles that form around encapsulated cells. Scale
bar is 50 μm. [Reproduced from Leonaviciene, G., et al. Lab Chip2020, 20 (21), 4052–4062
(ref (45)) with permission
from The Royal Society of Chemistry.] (b) Bulk emulsion GMDs: Formation
of polydisperse GMDs by vigorously mixing an ungelled polymer solution
in oil, to create water-in-oil emulsions. These emulsions, once stabilized,
are gelled to form nonuniform GMDs. The oil is removed, and the GMDs
are transferred to an aqueous solution. Scale bar is 20 μm.
[Reprinted with permission from ref (46). Copyright, 1990 American Society for Microbiology.]
(c) Microfluidic GMDs: A microfluidic droplet generator is used to
create monodisperse water-in-oil droplet emulsions consisting of ungelled
polymer precursors. Subsequently, the solution undergoes gelation
to form uniform GMDs. After gelation, the oil is removed, and the
GMDs are transferred into an aqueous solution. Scale bar is 100 μm.
[Reproduced from Morimoto, Y., et al. Lab Chip2009, 9 (15), 2217–2223 (ref (47)) with permission from
The Royal Society of Chemistry.] (d) Core–shell particles:
An aqueous two-phase system is employed within a microfluidic droplet
generator to produce core–shell microparticles featuring a
hollow inner cavity. Polyethylene glycol (PEG), dextran, and a cross-linker
are combined to form a water-in-oil emulsion using the microfluidic
droplet generator. PEG and dextran undergo phase separation; dextran
moves toward the center, while PEG aligns at the surface of the emulsion.
Subsequently, the PEG-rich phase is cross-linked to create a solid
outer shell. Afterward, the particle is transitioned from oil to water.
During this transfer, the inert dextran escapes through the pores
of the outer shell, resulting in a hollow interior. Scale bar is 50
μm. [Reproduced with permission from Proceedings of the National
Academy of Sciences USA van Zee, M, et al. Proc. Natl. Acad.
Sci. U.S.A.2022, 119 (4),
e2109430119 (ref (48)).]
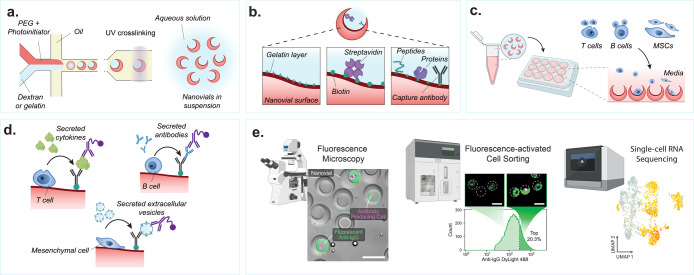
Nanovial fabrication and experimental workflow. (a) An aqueous
phase consisting of reactive PEG precursor and photoinitiator is coflowed
with a second aqueous phase consisting of gelatin or dextran solution
in a microfluidics droplet generator resulting in uniform monodispersed
aqueous two-phase water-in-oil droplets. The phase-separated droplets
are exposed to UV light downstream to polymerize the PEG phase. The
dextran or gelatin sacrificial phase is removed during washing steps
resulting in an open cavity and final crescent-shaped cross-sectional
morphology. (b) If fabricated with gelatin, the nanovials will have
a localized gelatin layer at the cavity surface. The gelatin or PEG
surface can be functionalized with biotin and streptavidin moieties
to attach peptides, proteins, or antibodies to localize cells and
their secretions to individual nanovials. (c) Various cell types with
a wide diversity of secreted products can be loaded onto and analyzed
on nanovials. Cells are loaded onto nanovials in tubes or well plates
in bulk, and unbound cells can be filtered out. (d) Fluorescent and/or
oligo-barcode labeled detection antibodies are incubated with cells
on nanovials to detect their secretions. (e) Single-cell secretion
analysis is performed with microscopy, FACS, and/or single-cell sequencing
techniques. Scale bar is 100 μm. [First two images reproduced
from de Rutte, J., et al. Suspendable Hydrogel Nanovials for Massively
Parallel Single-Cell Functional Analysis and Sorting. ACS
Nano2022, 16 (5), 7242–7257
(ref (11)) Copyright
2022 American Chemical Society. Last image reprinted with permission
from Macmillan Publishers Ltd.: Nature, Udani, S., et al. Nat. Nanotechnol. (ref (9)) Copyright 2023.]
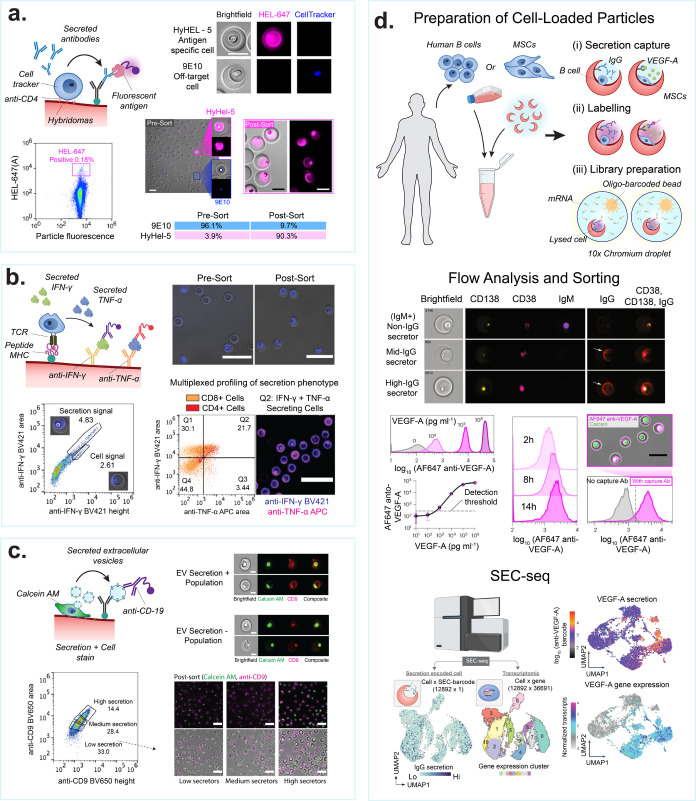
Screening secreted cellular products on nanovials.
(a) Antibody
secretions can be captured from hybridoma lines, producer cell lines,
and primary antibody-secreting B cells. Schematic shows cells are
captured, e.g., with antibodies specific to cell
surface markers, and secreted antibodies are captured onto antigens
or antibodies on the nanovial surface. Images show antigen-specific
IgG bound on nanovials (magenta) secreted by HyHEL-5 cells, while
9E10 cells secreting an off-target IgG (blue) do not have corresponding
signal on nanovials. Flow scatter plot highlighting the gate used
to sort antigen-specific IgG secretors. Presort and postsort microscopy
images are shown. The table shows sort enrichment of spiked HyHEL-5
cells. Scale bars are 100 μm. [Reproduced from de Rutte, J.,
et al. Suspendable Hydrogel Nanovials for Massively Parallel Single-Cell
Functional Analysis and Sorting. ACS Nano2022, 16 (5), 7242–7257 (ref (11)). Copyright 2022 American
Chemical Society.] (b) Schematic showing multiple cytokines can be
captured in parallel from activated T cells that are engaged through
TCR interactions with peptides loaded onto class I major histocompatibility
complex (p-MHC). Images and FACS plots show T cells captured using
p-MHC and screened for IFNγ and TNFα production. Fluorescence
peak area vs height scatter plots showing gates used to differentiate
nanovial staining vs cell staining of permeabilized cells. Scale bars
are 100 μm. [Reprinted with permission from ref (95). Copyright, 2022 D. Koo.]
(c) MSCs are captured based on binding to gelatin on nanovials and
screened based on extracellular vesicle secretion. Scale bars are
20 μm (top) and 100 μm (bottom). [Reprinted with permission
from ref (27). Copyright,
2023 D. Koo.] Imaging flow cytometry of MSCs and captured EVs, stained
with an antibody against the tetraspanin, CD9 (red), showing EV secretion
positive and negative populations. The viability dye, calcein AM,
is used to stain live cells (green). Bottom panel images show calcein
AM-stained MSCs (green) on nanovials stained with anti-CD9 (magenta)
following FACS sorting based on EV-specific secretion signal gates
(low, medium, high secretors). (d) Secretion is associated with single-cell
RNA sequencing data (SEC-seq) by using oligo-barcoded detection antibodies
and droplet single-cell barcoding of cDNA libraries. Imaging flow
cytometry of nonsecreting and IgG-secreting cells. Flow cytometry
histograms of VEGF-A signal on nanovials from a VEGF-A concentration
sweep or signal from secreting cells over time. Signal is dependent
on the presence of a VEGF-A capture antibody. Scale bar is 50 μm.
[Reprinted with permission from Macmillan Publishers Ltd.: Nature,
Udani, S., et al. Nat. Nanotechnol. (ref (9)). Copyright 2023.] SEC-seq
data shows transcriptome-based clustering of single-cell expression
profiles and corresponding IgG or VEGF-A secretion signal. [Reprinted
with permission from Macmillan Publishers Ltd.: Nature, Cheng, R.,
et al. Nat. Commun. (ref (26)) Copyright 2023.]
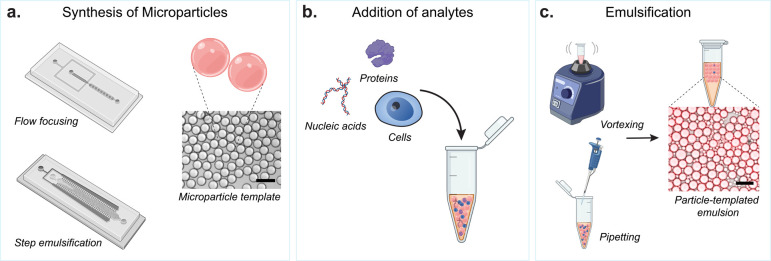
Schematic of spherical particle-templated
assays. (a) Particle
fabrication methods using microfluidic devices for creating spherical
hydrogel microparticles. Commonly used designs include flow focusing
and step emulsification devices. Brightfield image of example microparticles
produced. (b) Analytes used in particle-templated assays including
nucleic acids, proteins, and single cells. (c) Methods for creating
particle-templated emulsions using readily available lab instruments,
which include vortexing and pipetting, resulting in uniform emulsification.
Brightfield image with fluorescent overlay of an example particle-templated
emulsion. Scale bars are 100 μm.
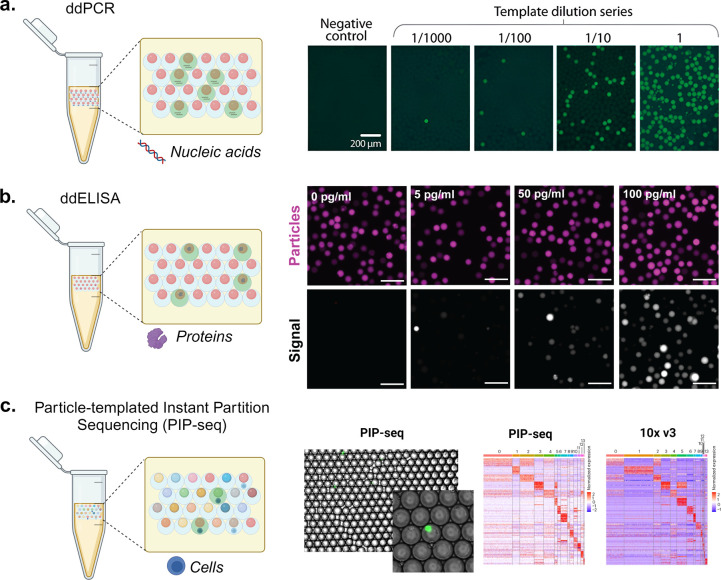
Molecular and cellular assays using particle-templated
emulsions.
(a) Using PTEs to perform droplet digital PCR (ddPCR). The schematic
shows droplets positive (green fluorescence) and negative (no fluorescence)
for nucleic acid amplification using ddPCR. The fluorescence microscopy
images show the amplification of yeast genomic DNA at varying dilutions
in a digital regime where the fractions of positive droplets (with
fluorescence) correspond with the DNA concentration. Scale bars are
200 μm. [Reproduced from Hatori, M., et al. Particle-Templated
Emulsification for Microfluidics-Free Digital Biology. Anal.
Chem.2018, 90 (16), 9813–9820
(ref (28)) Copyright
2018 American Chemical Society.] (b) Using PTE to perform ddELISA.
The schematic shows droplets positive (green fluorescence) and negative
(no fluorescence) for analyte binding and enzymatic amplification
using ddELISA. The fluorescence microscopy images illustrate particles
(magenta) and fluorescence signal from enzymatic turnover (grayscale)
where an increasing fraction of positive droplets corresponds with
an increasing concentration of a heart failure protein biomarker.
Scale bars are 100 μm. [Reprinted with permission from ref (119). Copyright, 2023 V. Shah.]
(c) Using PTE to perform single-cell RNA sequencing. The schematic
illustrates coencapsulation of particles and cells in droplets, where
color indicates different oligonucleotide barcodes on particles. Similar
cell clustering and marker genes are observed for PIP-seq compared
to 10X Chromium V3 workflows for cells from healthy breast tissue.
[Reprinted with permission from Macmillan Publishers Ltd.: Nature,
Clark, I. C., et al. Nat Biotechnol.2023, 41 (11), 1557–1566 (ref (31)). Copyright 2023.]
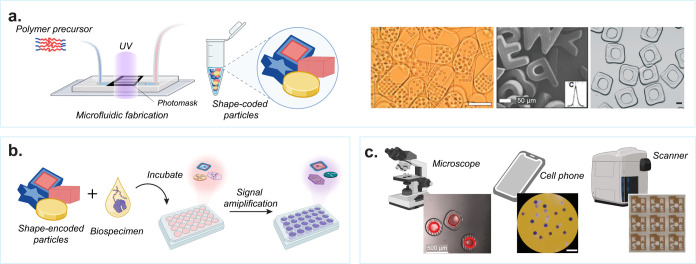
Workflow
for the fabrication and use of shaped particles. (a) Fabrication
of shaped microparticles in microfluidic devices using photomasks
and UV polymerization. Representative shape-encoded particles used
for biomolecular detection. [From Pregibon, D. C., et al. Multifunctional
Encoded Particles for High-Throughput Biomolecule Analysis. Science2007, 315 (5817),
1393–1396 (ref (30)) reprinted with permission from AAAS; Kim, L. N., et al. Chem. Commun.2015, 51 (60),
12130–12133 (ref (133)) with permission from The Royal Society of Chemistry; and
Destgeer, G., et al. Lab Chip2020, 20 (19), 3503–3514 (ref (22)) with permission from The Royal Society of Chemistry.]
(b) Schematic representation of assay workflow using shaped microparticles
including incubation and signal amplification steps. (c) Readout of
assay results on individual microparticles using standard instrumentation
such as microscopes, cell phones, or scanners. [Reproduced from Destgeer,
G., et al. Lab Chip2020, 20 (19), 3503–3514 (ref (22)) with permission from The Royal Society of Chemistry; Derveaux,
S., et al. Anal. Bioanal. Chem.2008, 391 (7), 2453–2467 (ref (135)) with permission from
The Royal Society of Chemistry; and Svedberg, G., et al. Lab
Chip2017, 17 (3), 549–556
(ref (134)) with permission
from The Royal Society of Chemistry.]
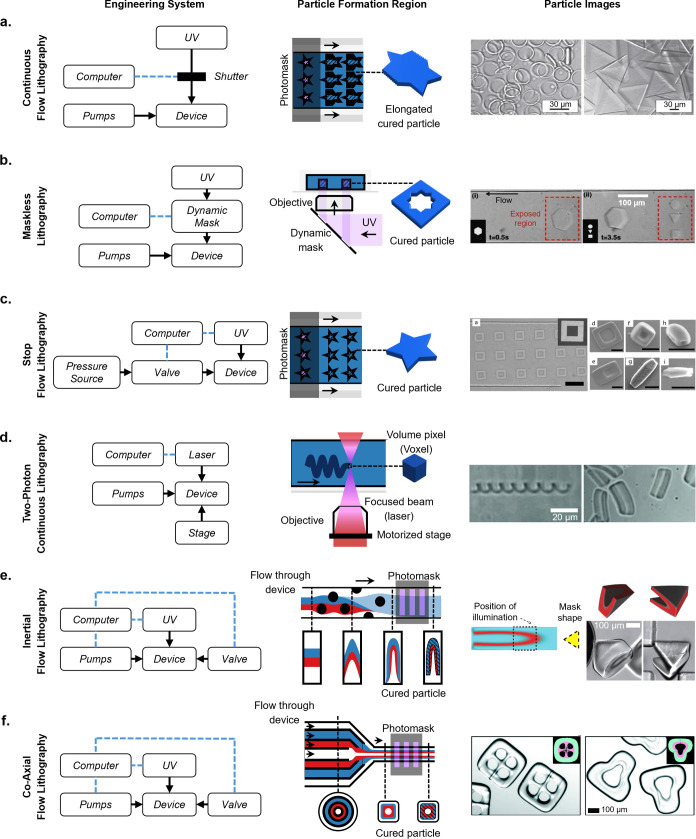
Shaped particle fabrication methods by flow-lithography
from oldest
to newest. (a) Continuous flow lithography particles. The fabrication
system requires a computer-controlled shutter and continuous flowing
pumps. Scale bar is 30 μm. [Reprinted with permission from Macmillan
Publishers Ltd.: Nature, Dendukuri, D., et al. Nature Mater.2006, 5 (5), 365–369 (ref (10)) Copyright 2006.] (b)
Maskless lithography particles. The shutter is replaced with a dynamic
mask. Scale bar is 100 μm. [Reprinted with permission from ref (143). Anna, S. L., et al. Applied Physics Letters2003, 82 (3), 364–366 licensed under a Creative Common Attribution
(CC BY) license.] (c) Stop flow lithography particles. A computer-controlled
valve is introduced to control flow, resulting in higher resolution
particles. Scale bar is 30 μm. [Reproduced from Chung, S. E.,
et al. Applied Physics Letters2007, 91 (4), 041106 (ref (144)) with permission from The Royal Society of Chemistry.]
(d) Two-photon continuous lithography particles. This fabrication
system requires both a focused laser and a motorized stage. Scale
bar is 20 μm. [Reproduced from Stop-Flow Lithography in a Microfluidic
Device. Dendukuri, D., et al. Lab Chip20127 (7), 818–828 (ref (145)) Copyright 2012 Wiley.]
(e) Inertial flow lithography particles. Before fabrication, the device
used to shape flow and the necessary photomask is predesigned using
uFlow. Pillars in the device create complex flow geometries, and a
shaped photomask produces particles of the desired shape. Scale bar
is 100 μm. [Reproduced from Two-Photon Continuous Flow Lithography, Advanced Materials201524 (10), 1304–1308 (ref (146)) Copyright 2015 Wiley.] (f) Coaxial flow lithography particles.
A 3D-printed device shapes the coaxial flow. Scale bar is 100 μm.
[Reproduced from Destgeer, G., et al. Lab Chip2020, 20 (19), 3503–3514 (ref (22)) with permission from
The Royal Society of Chemistry.] Engineering systems and close-up
views of particle fabrication region adapted from Lewis, C. L., et
al. Anal. Chem.2010, 82 (13), 5851–5858 (ref (142)) with permission from The Royal Society of Chemistry.
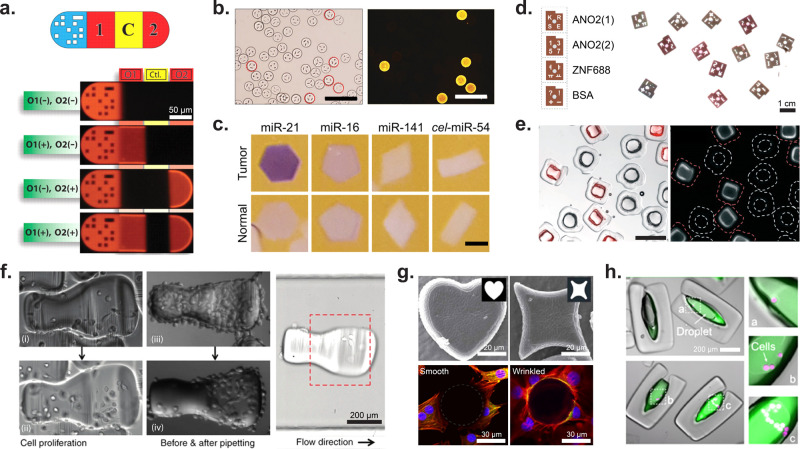
Application
of shaped microparticles for multiplexed and cellular
assays. (a) DNA detection on barcoded particles. The particle is subdivided
as follows: graphical barcode portion, detection section for DNA oligomer
1, control (should always be dark), detection for DNA oligomer 2.
Particles are approximately 90 μm in width and 180–270
μm in length. [From Pregibon, D. C., et al. Multifunctional
Encoded Particles for High-Throughput Biomolecule Analysis. Science2007, 315 (5817),
1393–1396 (ref (30)) reprinted with permission from AAAS.] (b) HPV DNA mutant detection
where each differently shaped particle is conjugated to probes for
a unique HPV DNA mutant. Images of positive particles corresponding
to the barcode for HPV mutant 33. Scale bars are 200 μm. [Reproduced
from Kim, L. N., et al. Chem. Commun.2015, 51 (60), 12130–12133 (ref (133)) with permission from
The Royal Society of Chemistry.] (c) Images showing miRNA detection
(purple) from normal and tumor cells. The oncogenic miRNA, miR-21,
is seen in higher concentrations in the particles incubated with tumor
lysate. Slightly elevated levels of miR-16, an endogenous standard
in miRNA analysis of colon cancer, was seen in the particles incubated
with tumor lysate. miR-141 is a marker of poor prognosis associated
with advanced colon cancer. The probe cel-miR-54
was used as a negative control. Scale bars are 200 μm. [Reproduced
from Derveaux, S., et al. Anal. Bioanal Chem.2008, 391 (7), 2453–2467 (ref (135)) with permission from
The Royal Society of Chemistry.] (d) ELISA read out on optical scanner
for the detection of autoantibodies from multiple sclerosis patients.
ANO2 (1) serves as a positive control for MS autoantibodies, ANO2
(2) serves as negative control, and ZFN688 is a secondary negative
control. Particles have a diameter of 900 μm and a thickness
of 150 μm. [Reproduced from Svedberg, G., et al. Lab
Chip2017, 17 (3), 549–556
(ref (134)) with permission
from The Royal Society of Chemistry.] (e) Enzyme-linked assay in particle-templated
drops where the fluorescent product within a droplet supported by
square particles accumulates while no fluorescent product accumulated
in negative control circular particles. Particles range in size from
340–400 μm with cavity dimensions of 100–200 μm.
Scale bar is 500 μm. [Reproduced from Destgeer, G., et al. Lab Chip2020, 20 (19), 3503–3514
(ref (22)) with permission
from The Royal Society of Chemistry.] (f) MDA-MB-231GFP cells on collagen
patterned microcarriers. The first column shows cell proliferation
on a microcarrier over time; the second column shows how cells on
the nonshelter region were removed via pipetting while cells in the
shelter area were protected from pipetting shear forces. The third
image shows how the microcarrier orients in flow. Scale bar is 200
μm. [Reprinted with permission from Macmillan Publishers Ltd.:
Nature, Wu, C., et al. Microsyst. Nanoeng.2018, 4 (1), 21 (ref (157)) Copyright 2018.] (g)
Wrinkled, nonspherical particles. The top row shows two different
wrinkled particle shapes, while the bottom row shows cell adhesion
differences between a spherical nonwrinkled particle (left) and a
wrinkled particle (right). Scale bar is 20 μm (top) and 30 μm
(bottom). [Reprinted with permission from Macmillan Publishers Ltd.:
Nature, Li, M., et al. Sci. Rep.2016, 6 (1) 30463 (ref (159)) Copyright 2016.] (h) LNCaP cells (magenta)
encapsulated in amphiphilic particles. The fluorescence intensity
of MMP-cleavable fluorogenic substrate (green) increases with increasing
number of encapsulated cells. Scale bar is 200 μm. [From Wu,
C., et al. Monodisperse Drops Templated by 3D-Structured Microparticles. Science Advances2020, 6 (45),
eabb9023 (ref (12))
reprinted with permission from AAAS.]
Similar articles
-
Flow lithography for structured microparticles: fundamentals, methods and applications.Lab Chip. 2022 Oct 25;22(21):4007-4042. doi: 10.1039/d2lc00421f. Lab Chip. 2022. PMID: 35920614 Review.
-
Recent advances in particle and droplet manipulation for lab-on-a-chip devices based on surface acoustic waves.Lab Chip. 2011 Apr 7;11(7):1280-5. doi: 10.1039/c0lc00527d. Epub 2011 Feb 8. Lab Chip. 2011. PMID: 21301739 Review.
-
Integrated lab-on-chip biosensing systems based on magnetic particle actuation--a comprehensive review.Lab Chip. 2014 Jun 21;14(12):1966-86. doi: 10.1039/c3lc51454d. Epub 2014 May 7. Lab Chip. 2014. PMID: 24806093 Review.
-
Operando investigation of particle re-entrainment mechanism in electrostatic capture process on the lab-on-a-chip.J Environ Sci (China). 2024 Feb;136:337-347. doi: 10.1016/j.jes.2022.12.013. Epub 2022 Dec 20. J Environ Sci (China). 2024. PMID: 37923443
-
Measurement of Aerosol Particles from Vibrated Lab Coats.Toxics. 2024 Aug 2;12(8):565. doi: 10.3390/toxics12080565. Toxics. 2024. PMID: 39195667 Free PMC article.
Cited by
-
Sealable capped nanovials for high-throughput screening of cell growth and function.bioRxiv [Preprint]. 2025 Jul 3:2025.06.29.662236. doi: 10.1101/2025.06.29.662236. bioRxiv. 2025. PMID: 40631199 Free PMC article. Preprint.
-
From specialization to broad adoption: Key trends in droplet microfluidic innovations enhancing accessibility to non-experts.Biomicrofluidics. 2025 Mar 3;19(2):021302. doi: 10.1063/5.0242599. eCollection 2025 Mar. Biomicrofluidics. 2025. PMID: 40046719 Free PMC article.
-
Construction of Multiplexed Assays on Single Anisotropic Particles Using Microfluidics.ACS Cent Sci. 2025 Jan 15;11(2):294-301. doi: 10.1021/acscentsci.4c02009. eCollection 2025 Feb 26. ACS Cent Sci. 2025. PMID: 40028365 Free PMC article.
-
Evaluation of industrial and consumer 3-D resin printer fabrication of microdevices for quality management of genetic resources in aquatic species.Micro Nano Eng. 2024 Sep;24:100277. doi: 10.1016/j.mne.2024.100277. Epub 2024 Jul 25. Micro Nano Eng. 2024. PMID: 39157761 Free PMC article.
-
Linking single-cell transcriptomes with secretion using SEC-seq.Nat Protoc. 2025 Jul;20(7):2034-2055. doi: 10.1038/s41596-024-01112-w. Epub 2025 Feb 20. Nat Protoc. 2025. PMID: 39979460 Review.
References
Publication types
Grants and funding
LinkOut - more resources
Full Text Sources
Miscellaneous
