. 2024 Apr 22;6(2):fcae110.
doi: 10.1093/braincomms/fcae110. eCollection 2024.

γ-Aminobutyric acid transporter and GABAA receptor mechanisms in Slc6a1+/A288V and Slc6a1+/S295L mice associated with developmental and epileptic encephalopathies

Affiliations

γ-Aminobutyric acid transporter and GABAA receptor mechanisms in Slc6a1+/A288V and Slc6a1+/S295L mice associated with developmental and epileptic encephalopathies

Wangzhen Shen et al. Brain Commun. .

Abstract

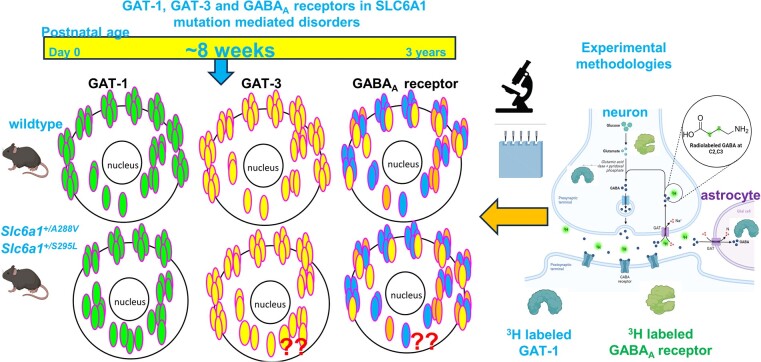
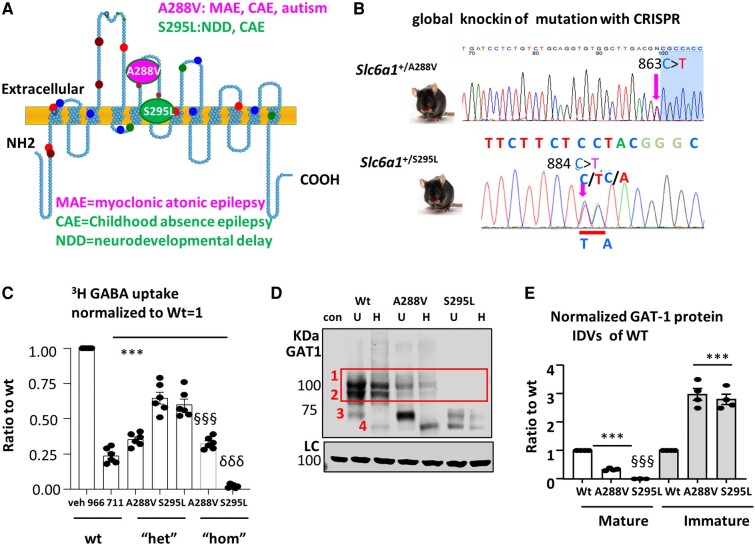
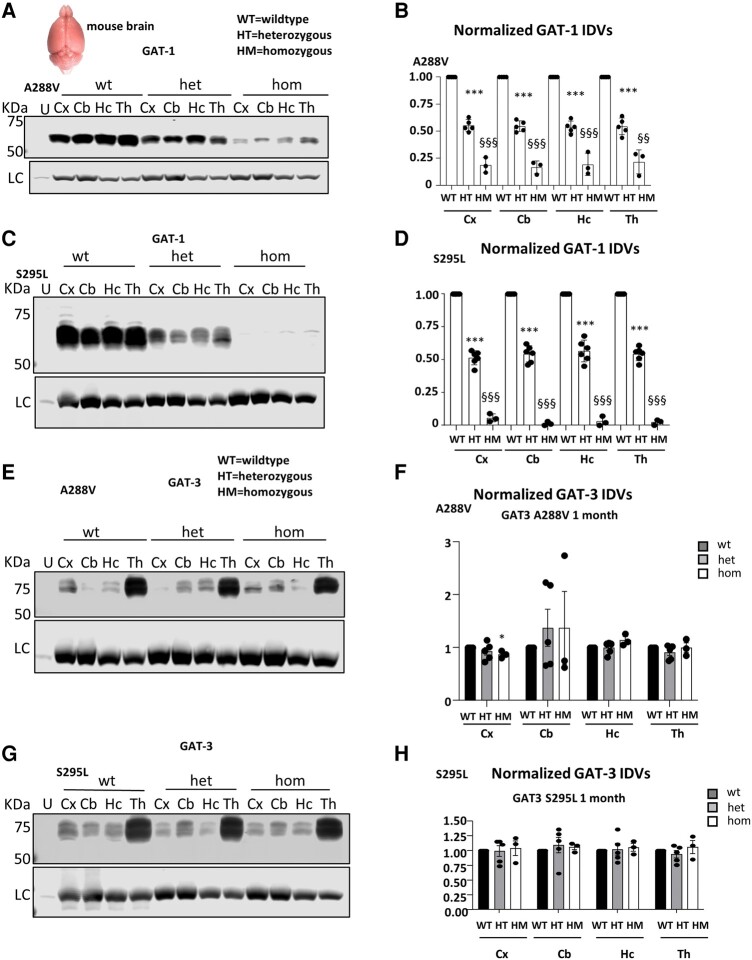
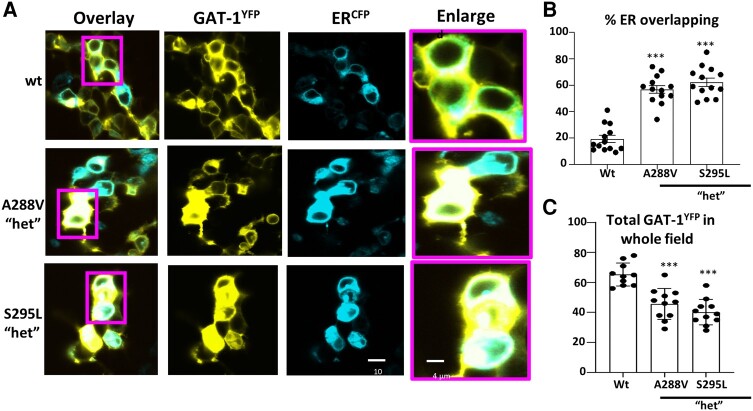
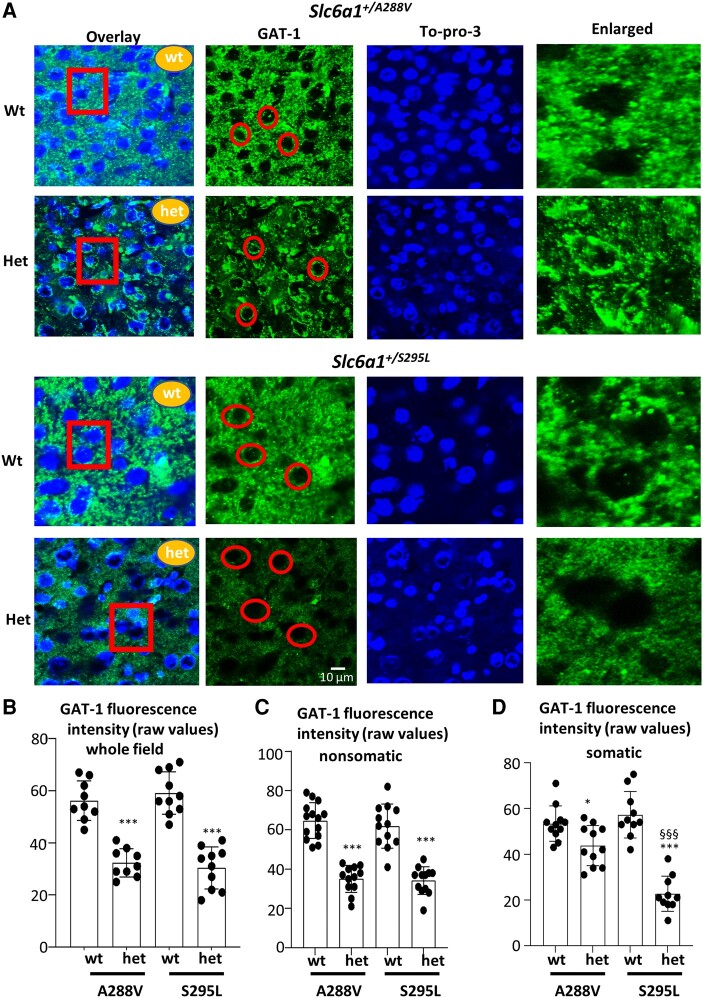
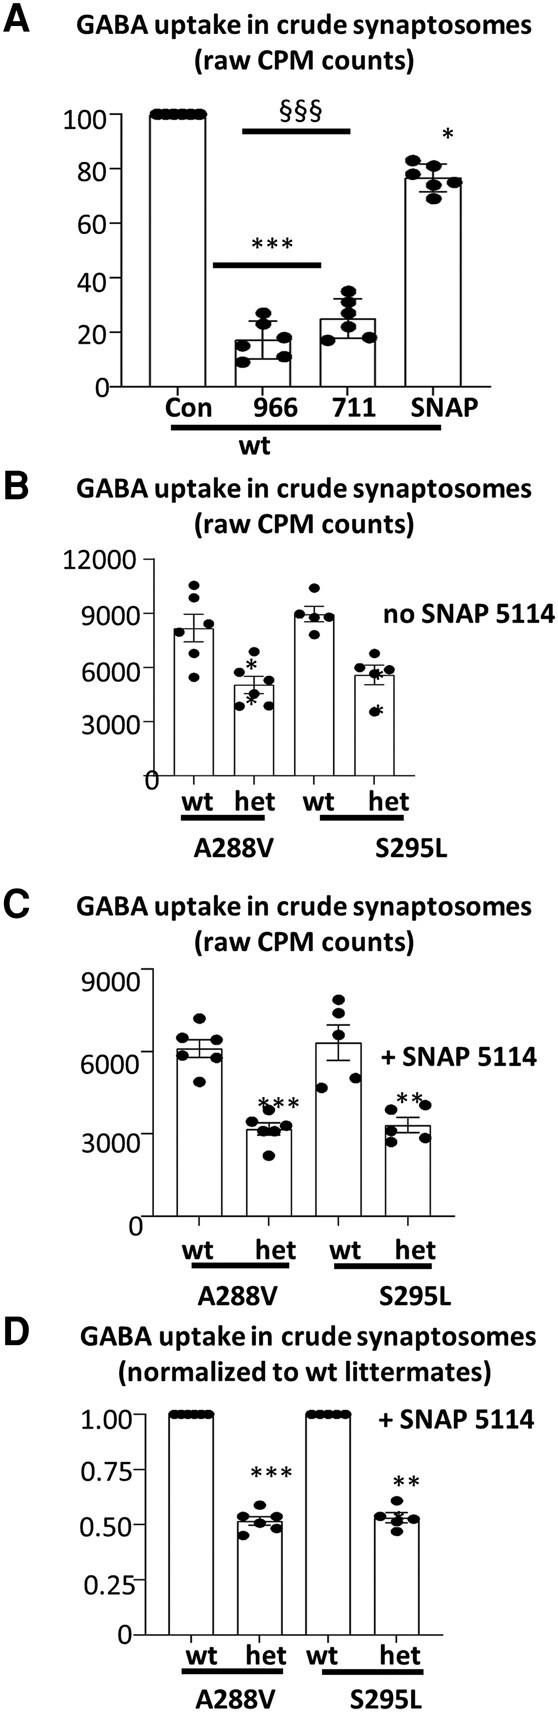
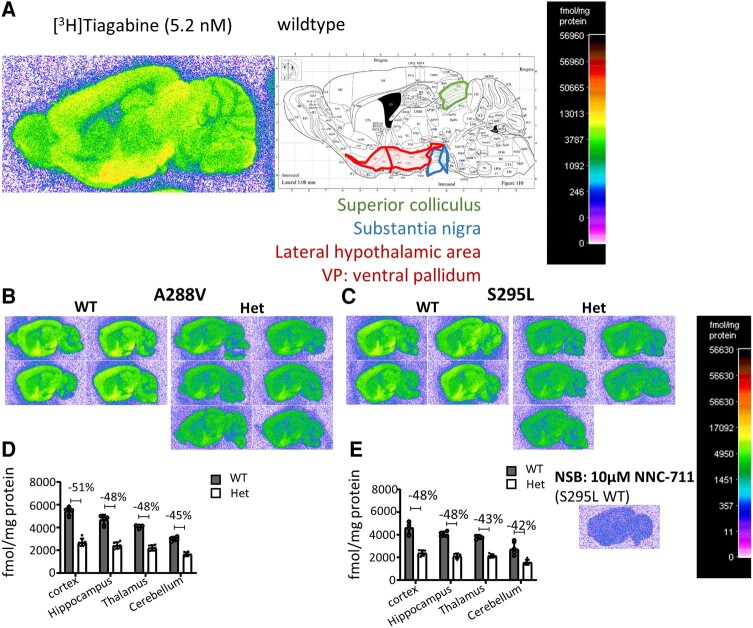
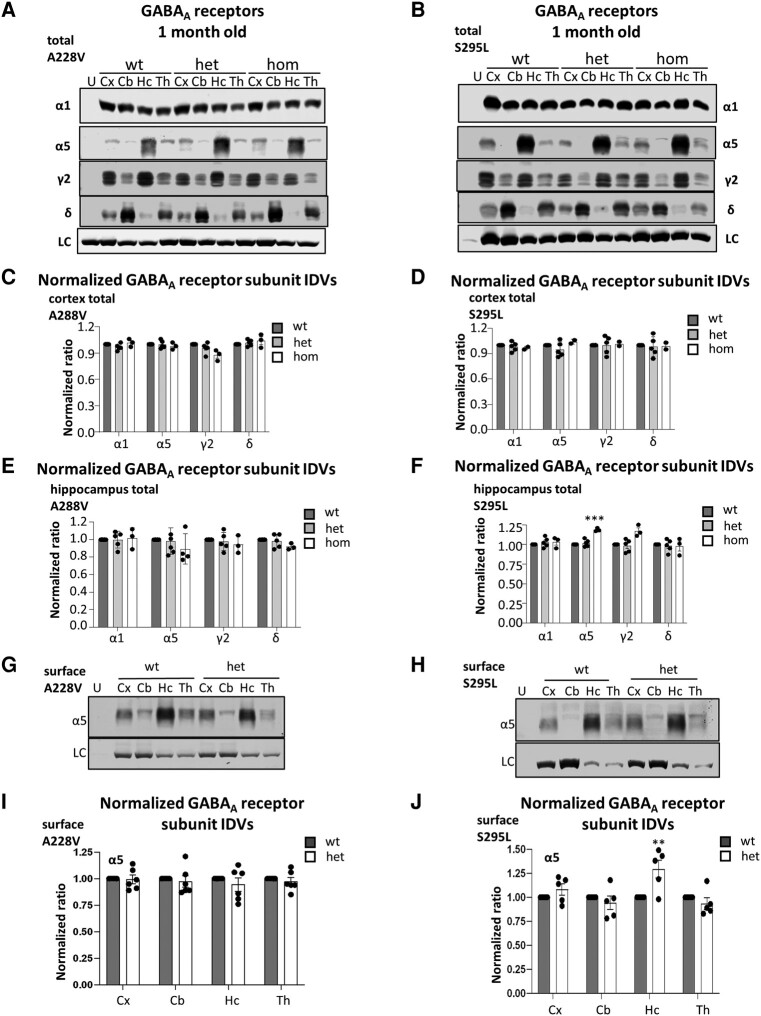
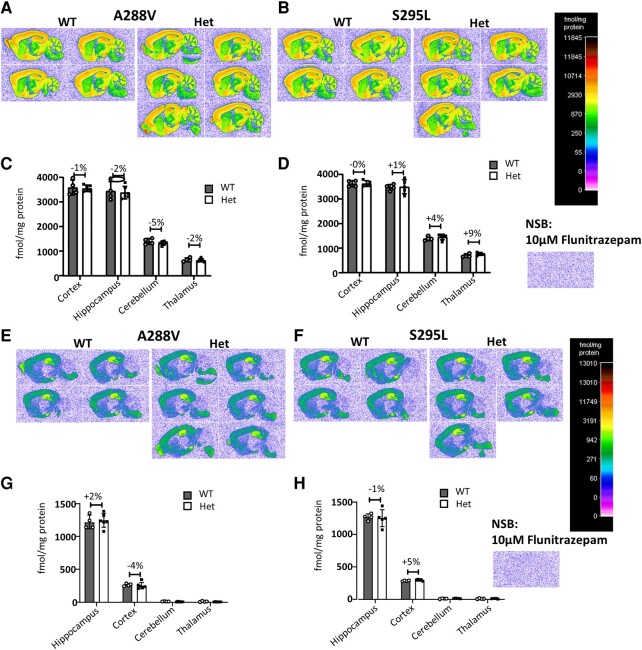
We have previously characterized the molecular mechanisms for variants in γ-aminobutyric acid transporter 1-encoding solute carrier family 6-member 1 (SLC6A1) in vitro and concluded that a partial or complete loss of γ-aminobutyric acid uptake due to impaired protein trafficking is the primary aetiology. Impairment of γ-aminobutyric acid transporter 1 function could cause compensatory changes in the expression of γ-aminobutyric acid receptors, which, in turn, modify disease pathophysiology and phenotype. Here we used different approaches including radioactive 3H γ-aminobutyric acid uptake in cells and synaptosomes, immunohistochemistry and confocal microscopy as well as brain slice surface protein biotinylation to characterize Slc6a1+/A288V and Slc6a1+/S295L mice, representative of a partial or a complete loss of function of SLC6A1 mutations, respectively. We employed the γ-aminobutyric acid transporter 1-specific inhibitor [3H]tiagabine binding and GABAA receptor subunit-specific radioligand binding to profile the γ-aminobutyric acid transporter 1 and GABAA receptor expression in major brain regions such as cortex, cerebellum, hippocampus and thalamus. We also determined the total and surface expression of γ-aminobutyric acid transporter 1, γ-aminobutyric acid transporter 3 and expression of GABAA receptor in the major brain regions in the knockin mice. We found that γ-aminobutyric acid transporter 1 protein was markedly reduced in cortex, hippocampus, thalamus and cerebellum in both mutant mouse lines. Consistent with the findings of reduced γ-aminobutyric acid uptake for both γ-aminobutyric acid transporter 1(A288V) and γ-aminobutyric acid transporter 1(S295L), both the total and the γ-aminobutyric acid transporter 1-mediated 3H γ-aminobutyric acid reuptake was reduced. We found that γ-aminobutyric acid transporter 3 is only abundantly expressed in the thalamus and there was no compensatory increase of γ-aminobutyric acid transporter 3 in either of the mutant mouse lines. γ-Aminobutyric acid transporter 1 was reduced in both somatic regions and nonsomatic regions in both mouse models, in which a ring-like structure was identified only in the Slc6a1+/A288V mouse, suggesting more γ-aminobutyric acid transporter 1 retention inside endoplasmic reticulum in the Slc6a1+/A288V mouse. The [3H]tiagabine binding was similar in both mouse models despite the difference in γ-aminobutyric acid uptake function and γ-aminobutyric acid transporter 1 protein expression for both mutations. There were no differences in GABAA receptor subtype expression, except for a small increase in the expression of α5 subunits of GABAA receptor in the hippocampus of Slc6a1S295L homozygous mice, suggesting a potential interaction between the expression of this GABAA receptor subtype and the mutant γ-aminobutyric acid transporter 1. The study provides the first comprehensive characterization of the SLC6A1 mutations in vivo in two representative mouse models. Because both γ-aminobutyric acid transporter 1 and GABAA receptors are targets for anti-seizure medications, the findings from this study can help guide tailored treatment options based on the expression and function of γ-aminobutyric acid transporter 1 and GABAA receptor in SLC6A1 mutation-mediated neurodevelopmental and epileptic encephalopathies.

Keywords: GABA transporter 1 (GAT-1); GABAA receptors (GABAARs); endoplasmic reticulum retention; epilepsy; neurodevelopmental delay.


Conflict of interest statement

The authors report no competing interests.

Figures

Graphical abstract
Graphical abstract
Figure 1
Figure 1
SLC6A1(A288V) is a partial loss-of-function, while SLC6A1(S295L) is a complete loss-of-function variant due to trafficking defect. (A) Schematic presentation of mutant GAT-1 protein topology and locations of representative variants in human SLC6A1. SLC6A1(A288V) is associated with various epilepsy syndromes, autism and neurodevelopmental delay, while SLC6A1(S295L) is associated with the absence of epilepsy and neurodevelopmental delay. There are many variants that have been reported, and these are distributed in various locations and domains of the encoded GAT-1 protein peptide as represented by the coloured dots. (B) Sequencing showing the variant nucleotide in Slc6a1+/A288V and Slc6a1+/S295L mouse models created by CRISPR/CAS9 strategy. (C) HEK293T cells expressing the wild-type or the ‘heterozygous’ mutant GAT-1YFP were transfected with the wild-type alone, a mixture of the wild-type and the mutant cDNA at 1:1 ratio or the mutant GAT-1YFP cDNAs alone for 48 h. The graph represents the GABA uptake function measured by the high-throughput 3H radio-labelling GABA uptake assay on a liquid scintillator with QuantaSmart. 966 stands for the wild-type treated with GAT-1 inhibitor Cl-966 (50 µM) and NNC-711 for the wild-type treated with NNC-711 (35 µM) for 30 min before preincubation. (D) The total lysates of HEK293T cells expressing the wild-type or variant GAT-1 were undigested (U) or digested with Endo-H (H) and then analysed by sodium dodecyl-sulfate polyacrylamide gel electrophoresis (SDS-PAGE). The membrane was immunoblotted with a rabbit anti-GAT-1. The red-boxed region represents the mature form of GAT-1 in cells. Control (con) stands for untransfected cell lysate from Chinese hamster ovary cells. Chinese hamster ovary cells were used as a control because of the low level of endogenous GAT-1 expression. The uncropped blots or separate channel images are shown in Supplementary Fig. 1. (E) The graph represents the normalized integrated protein density values of the mature or immature form of GAT-1 defined by being Endo-H resistant normalized to the wild-type mature form of GAT-1 (Bands 1 + 2) or immature form (Bands 3 and 4, which was absent in undigested wild-type). ***P < 0.001 versus wt, §§§P < 0.001 versus A288V, one-way analysis of variance and Newman–Keuls test. Values were expressed as mean ± SEM.
Figure 2
Figure 2
Slc6a1+/A288V and Slc6a1+/S295L mouse lines had reduced total GAT-1 expression in cortex, cerebellum, hippocampus and thalamus assessed by a biochemical assay. (A, B, C, D) Lysates from different brain regions (cortex (Cx), cerebellum (Cb)], hippocampus (Hc) and thalamus (Th) from the wild-type (wt), heterozygous (het) and homozygous (hom) mice of either Slc6a1+/A288V (A, C) and Slc6a1+/S295L (B, D) mouse lines at 1–2 months old were subjected to SDS-PAGE, immunoblotted with anti-GAT-1 antibody and then quantified. Integrated density values for total GAT-1 from wt, het and hom mice of either Slc6a1+/A288V (A, C) and Slc6a1+/S295L (B, D) mouse lines were normalized to the Na+/K+ ATPase in each specific brain region and plotted. In B, N = 5 for wild-type and heterozygous gender-matched littermates and N = 3 for homozygous mice. In D, N = 6 for wild-type and heterozygous gender-matched littermates and N = 3 for homozygous mice. (E, F, G, H) Lysates from different brain regions were subjected to SDS-PAGE, immunoblotted with anti-GAT-3 antibody and then quantified. (F, H) Normalized GAT-3 IDVs. In A, B, E and G, U stands for lysates from untreated Chinese hamster ovary cells, which were used as a negative control. In F and H, N = 5 for wild-type and heterozygous gender-matched littermates and N = 3 for homozygous mice. In A, C, E and G, the uncropped blots or separate channel images are shown in Supplementary Fig. 1. (B, D, F, H) Values were expressed as mean ± SEM. Two-way analysis of variance with post hoc Newman–Keuls test for multiple comparisons. In B and D, ***P < 0.001 versus wt, §§§P < 0.001 versus het.
Figure 3
Figure 3
Both GAT-1(A288V) and GAT-1(S295L) had increased retention of the mutant protein in the ER in live cells. (A) HEK293T cells were transfected with wild-type GAT-1 alone or the ‘heterozygous’ condition by mixing the wild-type or the mutant GAT-1(A288V) or GAT-1(S295L) with the enhanced cyan fluorescent protein-ER marker (ERCFP) at 1:1 ratio (1 µg for GAT-1YFP:1 µg of ERCFP cDNAs) for 48 h. For the ‘heterozygous’ mutant conditions, wild-type and mutant cDNAs were added at a ratio of 1:1 to make the total amount of 1 µg. Live cells were examined under a confocal microscopy with excitation at 458 nm for cyan fluorescent protein and 514 nm for YFP. All images were single confocal sections averaged from eight times to reduce noise, except when otherwise specified. (B) The GAT-1YFP fluorescence overlapping with ERCFP fluorescence was quantified by Metamorph with colocalization percentage. (C) The total GAT-1YFP fluorescence in the whole field was measured. Cells were identified in the differential interference contrast channel, while the area without cells was not included. One-way analysis of variance with post hoc Newman–Keuls test for multiple comparisons, ***P < 0.001 versus wt, N = 10–11 different dishes from four different transfections.
Figure 4
Figure 4
Slc6a1+/A288V and Slc6a1+/S295L mice had reduced GAT-1 puncta and total GAT-1 in the cortex. (A) The brains from 1-month-old wild-type and heterozygous (het) littermates were blocked, short-fixed with 4% paraformaldehyde for 30 min and immersed in 30% sucrose overnight. The brain tissues were sectioned by cryostat at 30 µm and stained with rabbit anti-GAT-1 antibody (green) and cellular nucleus marker To-pro-3 (blue). The presented images were from cortex layers V–VI. Enlarged images from the image of overlay red boxed regions were used to illustrate the quantification of the fluorescent intensity values in somatic regions with ImageJ. The red circle in A GAT-1 panel represents an exemplary somatic region. The enlarged images for the red boxed regions for A are shown in Supplementary Fig. 2. (B, C, D) The fluorescent intensities of the whole field (B), non-somatic (C) or somatic (D) regions were measured. Values were expressed as mean ± SEM. Two-way analysis with post hoc Newman–Keuls test for multiple comparisons, ***P < 0.001 versus wt, N = 9–11 sections from four pairs of mice in each group.
Figure 5
Figure 5
Slc6a1+/A288V and Slc6a1+/S295L mice had reduced GABA uptake in the live synaptosomes. (A) The crude synaptosomes were isolated from forebrains of wild-type mice between 1 and 2 months old with discontinuous sucrose gradient subcellular fractionation. The crude live synaptosomes were incubated with preincubation solutions containing 3H GABA without or with Cl-966 (50 µM), NNC-711 (35 µM) or SNAP5114 (30 µM) for 30 min before being counted on a liquid scintillator with QuantaSmart. (B) The live crude synaptosomes forebrains from either Slc6a1+/A288V or Slc6a1+/S295L mouse littermates at 1–2 months were isolated with discontinuous sucrose gradient subcellular fractionation. The crude live synaptosomes were measured with radioactive GABA uptake assay. (C) SNAP 5114 (30 µM) was applied to ensure that only GAT-1 activity was measured. The CPM of samples from each genotype were measured. (D) The GABA uptake in the heterozygous mice was normalized to its own gender-matched littermates. Both male and female mice were included. Values were expressed as mean ± SEM. One-way analysis of variance with post hoc Newman–Keuls test for multiple comparisons for A and unpaired t-test for B and C. One-sample t-test was used for D. In A, *P < 0.05 ***P < 0.001 versus con, N = 6 wild-type pooled from both mouse lines. (B, C, D) N = 6 pairs for Slc6a1+/A288V mouse line and five pairs from Slc6a1+/S295L mouse line.
Figure 6
Figure 6
Slc6a1+/A288V and Slc6a1+/S295Lmouse lines showed reduced binding of a GAT-1 radioligand in autoradiography. (A) Sagittal section of a wild-type brain showing the profile of [3H]tiagabine binding. The mouse brain atlas link (http://labs.gaidi.ca/mouse-brain-atlas/? ml = 1.08&ap=&dv=). Ten µm thick cryo-sections of fresh frozen brains from wild-type (wt) and heterozygous (het) mice (age 1–2 months) of the Slc6a1+/A288V (B) and Slc6a1+/S295L (C) lines were incubated with [3H]tiagabine (5.2 nM) to quantify TB to GAT-1. (D, E) NSB was defined by co-incubation with 10 µM NNC-711 and all values were expressed as SB per mg protein (SB = TB − NSB). Regions of interest were delineated for cortex, hippocampus, thalamus and cerebellum. In all brain regions, binding was reduced by 42–51% in Het animals compared with wt controls. N = 4 wt, N = 5 het Slc6a1+/A288V mice and N = 6 het Slc6a1+/S295L mice.
Figure 7
Figure 7
Slc6a1+/A288V and Slc6a1+/S295L mouse lines had unaltered GABAAR expression. (A, B) Lysates from different brain regions (cortex [Cx], cerebellum [Cb], hippocampus [Hc] and thalamus [Th]) from the wild-type (wt), heterozygous (het) and homozygous (hom) mice of either Slc6a1+/A288V and Slc6a1+/S295L mouse lines at 1–2 months old were subjected to SDS-PAGE and immunoblotted with anti-α1, α5, γ2 or δ subunit antibodies of GABAARs. (C, D, E, F) Integrated density values for total GABAAR subunits from the somatosensory cortex (S1) (C, D) or hippocampus (E, F) wt, het and hom mice of either Slc6a1+/A288V (C, E) and Slc6a1+/S295L (D, F) mouse lines were normalized to the Na+/K+ ATPase or anti-glyceraldehyde-3-phosphate dehydrogenase loading control in each specific brain region and plotted. N = 4 from four pairs of mice. (G, H, I, J) The cell surface protein from live brain slices of selected regions in Slc6a1+/A288V (G) or Slc6a1+/S295L (H) mouse lines at 1–2 months old was isolated and probed with anti-α5 antibody. (I, J) Integrated density values for the GABAAR α5 subunits were normalized to Na+/K+ ATPase or anti-glyceraldehyde-3-phosphate dehydrogenase loading control in each specific brain region and plotted. N = 5–6 from five to six pairs of mice. For A, B, G and H, the uncropped blots are in Supplementary  Fig. 4. Values were expressed as mean ± SEM. Two-way analysis of variance with post hoc Newman–Keuls test for multiple comparisons. **P < 0.001 ***P < 0.001 versus wt in Hc. Supplementary Fig. 3 shows Slc6a1+/A288V and Slc6a1+/S295L mouse lines that had unaltered GABAAR expression in the thalamus and cerebellum, associated with Fig. 7.
Figure 8
Figure 8
Slc6a1+/A288V and Slc6a1+/S295Lmouse lines showed unaltered radioligand binding to γ2-subunit and α5-subunit containing GABAARs. (A, B) Ten µm thick cryo-sections of fresh frozen brains from wild-type (WT) and heterozygous (Het) mice (age 1–2 months) of the Slc6a1+/A288V (A) and Slc6a1+/S295L (B) lines were incubated with either [3H]flumazenil (1 nM). (C, D) The relative intensity of [3H]flumazenil radioligand binding to GABAAγ2 in each brain region was quantified. (E, F) Ten µm thick cryo-sections of fresh frozen brains from WT and Het mice (age 1–2 months) of the Slc6a1+/A288V (E) and Slc6a1+/S295L (F) lines were incubated with [3H]L-655 708 (2 nM) to quantify TB to GABAAα5 receptor populations. (G, H) The relative intensity of [3H]L-655 708 radioligand binding to GABAAα5 receptor in each brain region was quantified. In C, D, G and H, NSB was defined by co-incubation with 10 µM Flunitrazepam and all values were expressed as SB per mg protein (SB = TB − NSB). Regions of interest were delineated for cortex, hippocampus, thalamus and cerebellum. In all brain regions, binding of both radioligands was unchanged in heterozygous animals compared with wild-type controls. N = 4 wild-type mice of Slc6a1+/A288V and Slc6a1+/S295L mouse line, N = 5 Slc6a1+/A288V heterozygous mice and N = 6 Slc6a1+/S295L heterozygous mice. Values were expressed as mean ± SEM. Two-way analysis of variance with post hoc Newman–Keuls test for multiple comparisons.

Similar articles

Cited by

References

    1. Carvill GL, McMahon JM, Schneider A, et al. Mutations in the GABA transporter SLC6A1 cause epilepsy with myoclonic-atonic seizures. Am J Hum Genet. 2015;96(5):808–815. - PMC - PubMed
    1. Mattison KA, Butler KM, Inglis GAS, et al. SLC6A1 variants identified in epilepsy patients reduce γ-aminobutyric acid transport. Epilepsia. 2018;59(9):e135–e141. - PubMed
    1. Johannesen KM, Gardella E, Linnankivi T, et al. Defining the phenotypic spectrum of SLC6A1 mutations. Epilepsia. 2018;59(2):389–402. - PMC - PubMed
    1. Mermer F, Poliquin S, Zhou S, et al. Astrocytic GABA transporter 1 deficit in novel SLC6A1 variants mediated epilepsy: Connected from protein destabilization to seizures in mice and humans. Neurobiol Dis. 2022;172:105810. - PMC - PubMed
    1. Wang J, Poliquin S, Mermer F, et al. Endoplasmic reticulum retention and degradation of a mutation in SLC6A1 associated with epilepsy and autism. Mol Brain. 2020;13(1):76. - PMC - PubMed

LinkOut - more resources