Case Reports
. 2024 Apr 8:15:1369295.
doi: 10.3389/fimmu.2024.1369295. eCollection 2024.

Longitudinal cytokine and multi-modal health data of an extremely severe ME/CFS patient with HSD reveals insights into immunopathology, and disease severity

Affiliations
Case Reports

Longitudinal cytokine and multi-modal health data of an extremely severe ME/CFS patient with HSD reveals insights into immunopathology, and disease severity

Fereshteh Jahanbani et al. Front Immunol. .

Abstract

Introduction: Myalgic Encephalomyelitis/Chronic Fatigue Syndrome (ME/CFS) presents substantial challenges in patient care due to its intricate multisystem nature, comorbidities, and global prevalence. The heterogeneity among patient populations, coupled with the absence of FDA-approved diagnostics and therapeutics, further complicates research into disease etiology and patient managment. Integrating longitudinal multi-omics data with clinical, health,textual, pharmaceutical, and nutraceutical data offers a promising avenue to address these complexities, aiding in the identification of underlying causes and providing insights into effective therapeutics and diagnostic strategies.

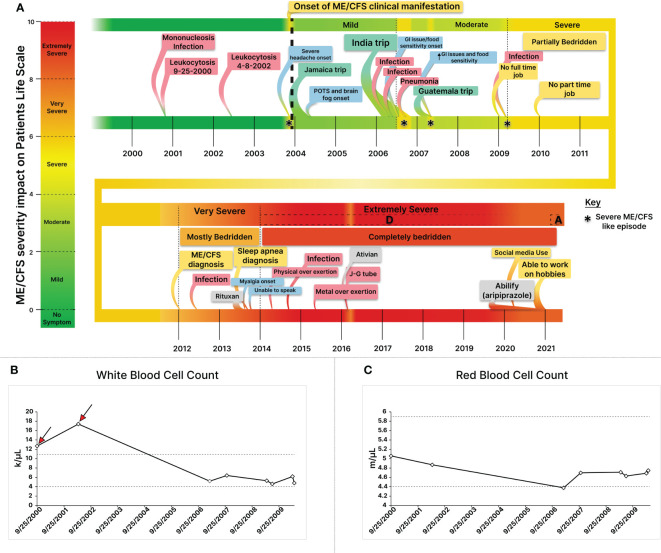
Methods: This study focused on an exceptionally severe ME/CFS patient with hypermobility spectrum disorder (HSD) during a period of marginal symptom improvements. Longitudinal cytokine profiling was conducted alongside the collection of extensive multi-modal health data to explore the dynamic nature of symptoms, severity, triggers, and modifying factors. Additionally, an updated severity assessment platform and two applications, ME-CFSTrackerApp and LexiTime, were introduced to facilitate real-time symptom tracking and enhance patient-physician/researcher communication, and evaluate response to medical intervention.

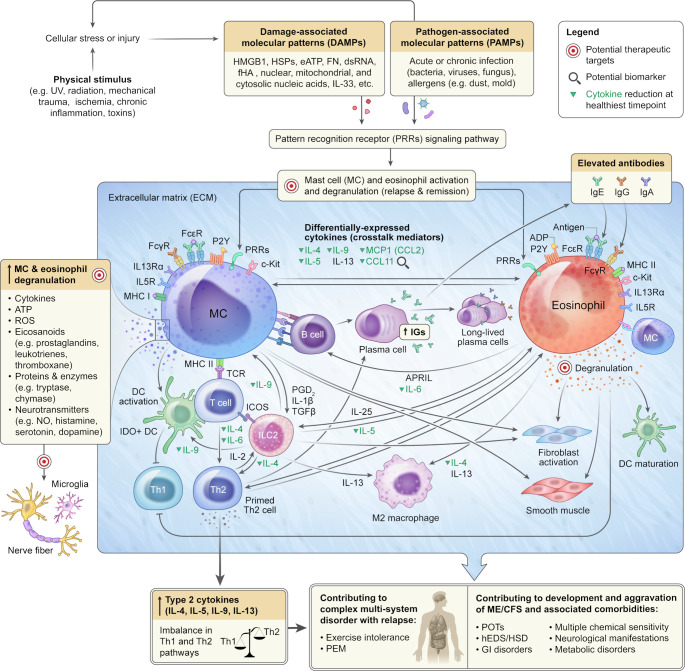
Results: Longitudinal cytokine profiling revealed the significance of Th2-type cytokines and highlighted synergistic activities between mast cells and eosinophils, skewing Th1 toward Th2 immune responses in ME/CFS pathogenesis, particularly in cognitive impairment and sensorial intolerance. This suggests a potentially shared underlying mechanism with major ME/CFS comorbidities such as HSD, Mast cell activation syndrome, postural orthostatic tachycardia syndrome (POTS), and small fiber neuropathy. Additionally, the data identified potential roles of BCL6 and TP53 pathways in ME/CFS etiology and emphasized the importance of investigating adverse reactions to medication and supplements and drug interactions in ME/CFS severity and progression.

Discussion: Our study advocates for the integration of longitudinal multi-omics with multi-modal health data and artificial intelligence (AI) techniques to better understand ME/CFS and its major comorbidities. These findings highlight the significance of dysregulated Th2-type cytokines in patient stratification and precision medicine strategies. Additionally, our results suggest exploring the use of low-dose drugs with partial agonist activity as a potential avenue for ME/CFS treatment. This comprehensive approach emphasizes the importance of adopting a patient-centered care approach to improve ME/CFS healthcare management, disease severity assessment, and personalized medicine. Overall, these findings contribute to our understanding of ME/CFS and offer avenues for future research and clinical practice.

Keywords: EDS/hEDS/HSD; MCAS; MCS; ME/CFS; POTS; Th2-cytokines; complex chronic condition; longitudinal omics.


Conflict of interest statement

The authors declare that the research was conducted in the absence of any commercial or financial relationships that could be construed as a potential conflict of interest.

Figures

Figure 1
Figure 1
Pedigree Structure of the Family with ME/CFS, EDS Type III, and HSD History. The depicted pedigree illustrates an ME/CFS patient of Caucasian descent. The patient presents with the comorbidity of Hypermobility Spectrum Disorder (HSD) and shares a family history of Ehlers-Danlos Syndrome (EDS) Type III. The sister with confirmed EDS Type III is highlighted in green.
Figure 2
Figure 2
Constructing a Comprehensive Disease Timeline through the Integration of Longitudinal Health and Clinical Data for An Extremely Severe ME/CFS Patient. (A) Integrating health and clinical data illustrates dynamic severity changes, triggers, contributing factors, and new symptom onsets. Infections like mononucleosis and stressors such as infections, medications, and trauma modulate severity. (B) Retrospective analysis of Longitudinal Complete Blood Count (CBC) data from the extremely severe ME/CFS patient during the first decade of his illness revealed two episodes of leukocytosis (red arrows) prior to the onset of health symptom, suggesting infection-derived immune dysregulation as a potential trigger for his ME/CFS. (C) Leukocytosis was followed by a lasting red blood cell count reduction. While white blood cell counts normalized, RBC levels declined, remaining low. * Depicts a Severe ME/CFS-like episode.
Figure 3
Figure 3
Proposed Framework for Personalized Severity Assessment in ME/CFS to Capture Variation in ME/CFS Severity and Life Impairment across Patients and Time. (A) Illustrates the dynamic range of the ME/CFS severity scale based on the disease’s impact on all aspects of the patient’s life, including occupational, educational, social, and personal spheres. (B) Depicts the impact of mild to severe ME/CFS on the patient’s life. Mild: maintained about 80% of pre-ME/CFS functional capacity, as well as full-time employment with limitations due to post-exertional malaise (PEM). Moderate: pre-ME/CFS functional capacity, unable to hold part-time work, with increased limitations in activity, progressing to severe: inability to hold any job, primarily house and bedbound. (C) Shows the patient’s functioning ability significantly degrading from extremely severe A to D, highlighting ME/CFS’s profound impact at this level. Severe nutritional deficiencies led to Gastrostomy tube (G-tube) and Peripherally inserted central catheter (PICC Line) Line use. Sensory intolerance intensified, making it impossible for the patient to tolerate others in his room. At stage D, communication loss and internet access loss intensified social isolation.
Figure 4
Figure 4
Longitudinal Multiplex Cytokine Profiling. (A) Distribution of log2-transformed cytokine MFI values per sample: Each boxplot represents a time point (run in 3 cytokine panels). The boxplot is arranged chronologically. (B) Hierarchical Clustering of Samples: This panel reveals groupings of similar time points and illustrates relationships between the samples based on clustering of log2-transformed cytokine intensities. (C) Volcano Plot of Differentially Expressed Cytokines: Plot illustrates cytokines based on the z-score derived from the last time point (Jan. 21), corresponding to the patient’s improved severity to ‘extremely severe A,’ in comparison to the average of the preceding nine time points. The x-axis represents z-scores, while the y-axis line represents -log (p-value). Black and blue dots marked cytokines with z-score values within -1 and 1, and p-value<0.05, respectively. (D) Heatmap of Top Differentially Expressed Cytokines: Columns (sample time points) and rows (cytokines) are clustered using euclidean distance and ward.D2 clustering. Most cytokines are reduced in the healthiest time point (marked in purple) except MIF, HGF, and LEP. Dark blue signifies the lowest z-scores, dark red the highest. (E) Log2 intensity levels of top 5 differentially expressed cytokines over time demonstrates cytokines that share similar trends. (F) Pearson correlation of cytokines in relation to the health state of the patient at the 9 different timepoints. The red dashed line indicates a 5% p-value cutoff.
Figure 5
Figure 5
Ingenuity Pathway Analysis of Longitudinal Cytokine Profiling During Health Improvement from Extremely Severe Stage D to A. (A) Top significant canonical pathways with an absolute z-score value of 0.8 and B-H p-value ≤ 0.05 are shown. Orange and blue bars represent positive or negative z-scores, indicating predicted pathway activation or inhibition, respectively. (B) Upstream regulator analysis indicates the activation of BCL6 and TP53 at the healthiest time point. (C) IPA diseases and function analyses predict the inhibition of mast cells and eosinophils functions. Green represents cytokines with reduced plasma levels at the healthiest time points, and red indicates increased cytokines. Orange and blue indicate predicted to be activated or inhibited, respectively.
Figure 6
Figure 6
Integrating Longitudinal Cytokine Profiling with Health, Textual, and Medication Data in Relation to Health Improvement. (A) Number of blog posts written monthly from 2017 up until the end of January 2021. For the first two months of 2020, the patient had assistance with writing blog posts for the months of January and February (blue bars). From May 2020 and onwards, the patient was feeling well enough to start writing the blog posts on his own (green bars). (B) Topic analysis word cloud for blog posts written from January 2020 until the end of January 2021, offering a visual representation of the most frequently occurring words from blog posts in this time frame, all under the topic umbrella of “Living with CFS and health challenges”. (C) Correlation analysis of the change in medication and health state over time. Changes in dosage for Skullcap, Buspar and Klonopin showed a strong correlation with improved health. (D) Medication usage over time is visualized for the 9 time points, which overlap with cytokine sample time points. To facilitate comparison, the dosage of each medication has been standardized over time using min-max scaling. This standardization is represented in a heatmap, gray squares represent no medication dosage recorded. List of medications are provided in bold to be distinguished from supplements. (E) Longitudinal monitoring of Clonazepam concentration in blood, which followed the reduction trend in his intake from 24 mg to 7 mg.
Figure 7
Figure 7
A Potential Mechanism Underlying ME/CFS Development, Aggravation and Comorbidities. Mast cells, present in nearly all human tissues, and eosinophils, found in the gastrointestinal tract, secondary lymphoid tissues, adipose tissue, thymus, mammary gland, and uterus, are tissue-resident cells. Aberrant DAMPs and PAMPs signaling cascades can lead to systemic overactivation and degranulation of mast cells and eosinophils, resulting in the release of over a hundred molecules, including potent inflammatory mediators, into the extracellular matrix of connective tissue. The synergistic activity of mast cells and eosinophils upon systemic activation can skew Th1/Th2 to Th2-immune responses, leading to tissue injuries, autoimmunity, impairment of multiple organs and biological systems as well as causing exercise intolerance and post-exertional malaise in predisposed individuals. Unresolved systemic mast cell and eosinophil overactivation could contribute to the development and aggravation of ME/CFS and related multisystem disorders and comorbidities. The schematic also depicts potential therapeutic targets and biomarkers.

References

    1. Raizen DM, Mullington J, Anaclet C, Clarke G, Critchley H, Dantzer R, et al. . Beyond the symptom: the biology of fatigue. Sleep. (2023), zsad069. doi: 10.1093/sleep/zsad069 - DOI - PMC - PubMed
    1. Holgate ST, Komaroff AL, Mangan D, Wessely S. Chronic fatigue syndrome: understanding a complex illness. Nat Rev Neurosci. (2011) 12:539–44. doi: 10.1038/nrn3087 - DOI - PubMed
    1. Missailidis D, Annesley SJ, Fisher PR. Pathological mechanisms underlying myalgic encephalomyelitis/chronic fatigue syndrome. Diagnostics (Basel). (2019) 9:80. doi: 10.3390/diagnostics9030080 - DOI - PMC - PubMed
    1. Symptoms of ME/CFS | Myalgic Encephalomyelitis/Chronic Fatigue Syndrome (ME/CFS). CDC. Available at: https://www.cdc.gov/me-cfs/symptoms-diagnosis/symptoms.html (Accessed 2 March 2024).
    1. Carruthers BM, van de Sande MI, De Meirleir KL, Klimas NG, Broderick G, Mitchell T, et al. . Myalgic encephalomyelitis: international consensus criteria. J Internal Med. (2011) 270:327–38. doi: 10.1111/j.1365-2796.2011.02428.x - DOI - PMC - PubMed

Publication types