. 2024 Apr 8:15:1328263.
doi: 10.3389/fimmu.2024.1328263. eCollection 2024.

Short-chain fatty acids induced lung tumor cell death and increased peripheral blood CD4+ T cells in NSCLC and control patients ex vivo

Affiliations

Short-chain fatty acids induced lung tumor cell death and increased peripheral blood CD4+ T cells in NSCLC and control patients ex vivo

Carolin D Thome et al. Front Immunol. .

Abstract

Background: Despite therapy advances, one of the leading causes of cancer deaths still remains lung cancer. To improve current treatments or prevent non-small cell lung cancer (NSCLC), the role of the nutrition in cancer onset and progression needs to be understood in more detail. While in colorectal cancer, the influence of local microbiota derived SCFAs have been well investigated, the influence of SCFA on lung cancer cells via peripheral blood immune system should be investigated more deeply. In this respect, nutrients absorbed via the gut might affect the tumor microenvironment (TME) and thus play an important role in tumor cell growth.

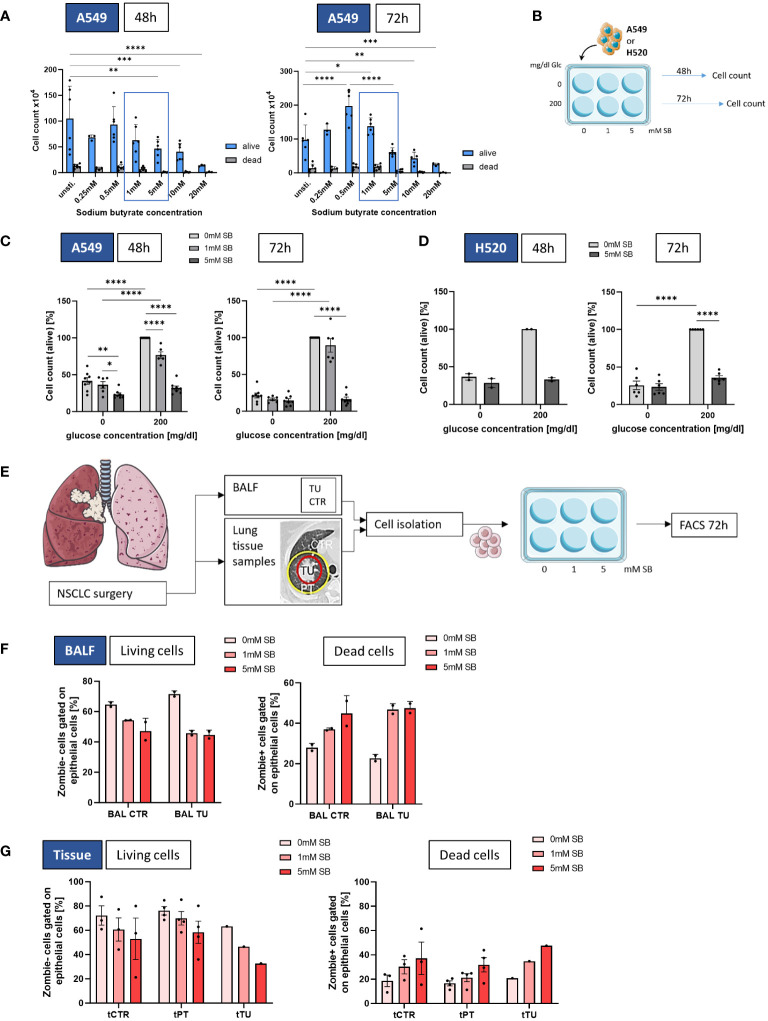
Objective: This study focuses on the impact of the short-chain fatty acid (SCFA) Sodium Butyrate (SB), on lung cancer cell survival. We previously described a pro-tumoral role of glucose on A549 lung adenocarcinoma cell line. In this study, we wanted to know if SB would counteract the effect of glucose and thus cultured A549 and H520 in vitro with and without SB in the presence or absence of glucose and investigated how the treatment with SB affects the survival of lung cancer cells and its influence on immune cells fighting against lung cancer.

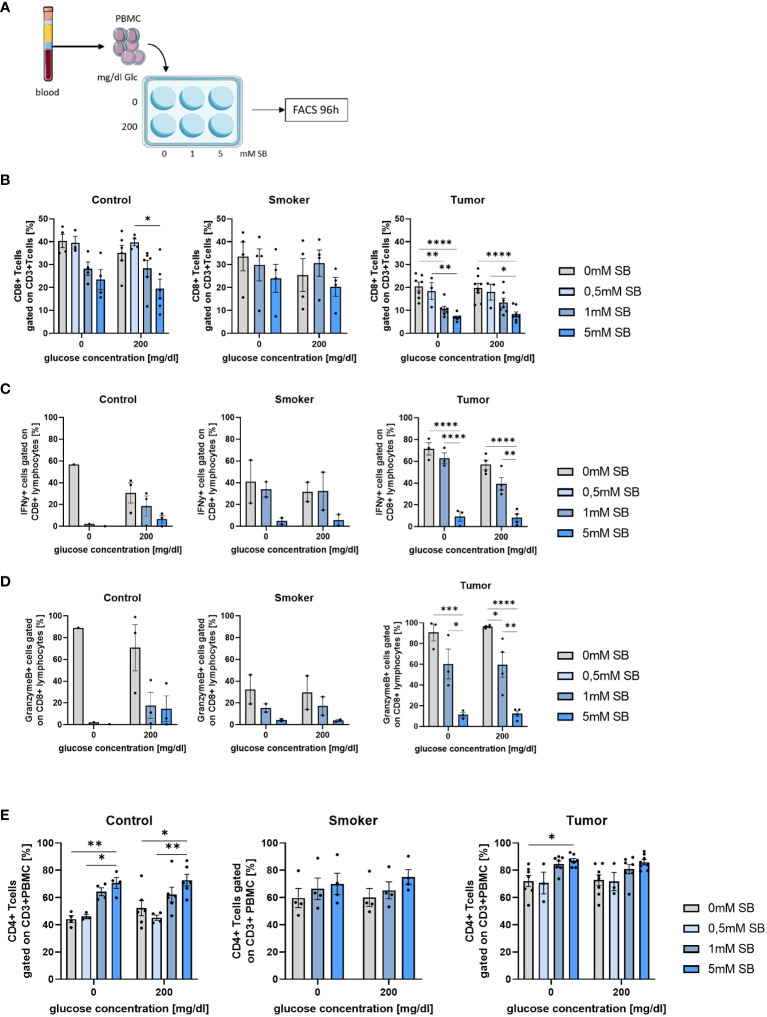
Methods: In this study, we performed cell culture experiments with A549, H520 and NSCLC-patient-derived epithelial cells under different SB levels. To investigate the influence on the immune system, we performed in vitro culture of peripheral mononuclear blood cells (PBMC) from control, smoker and lung cancer patients with increasing SB concentrations.

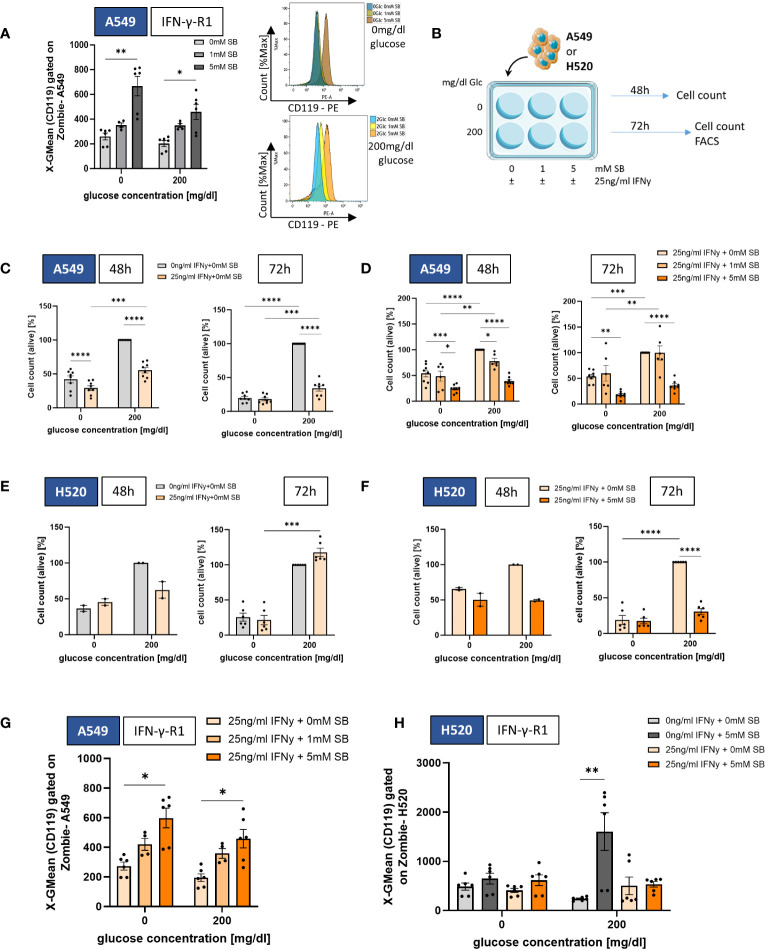
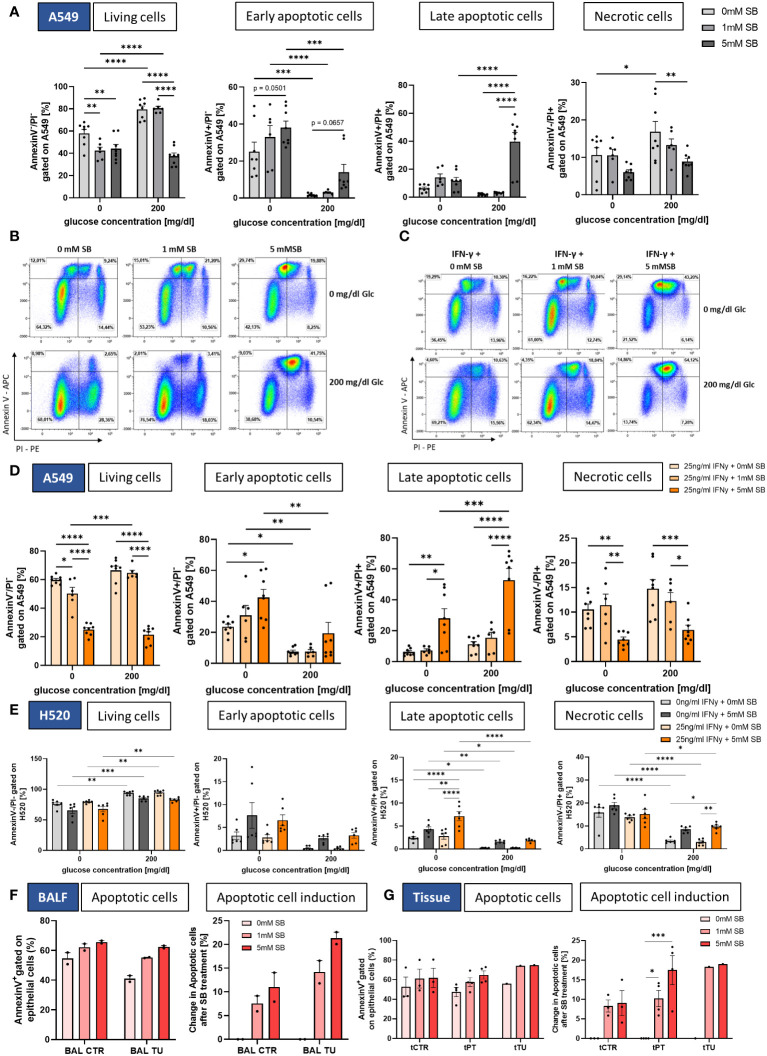
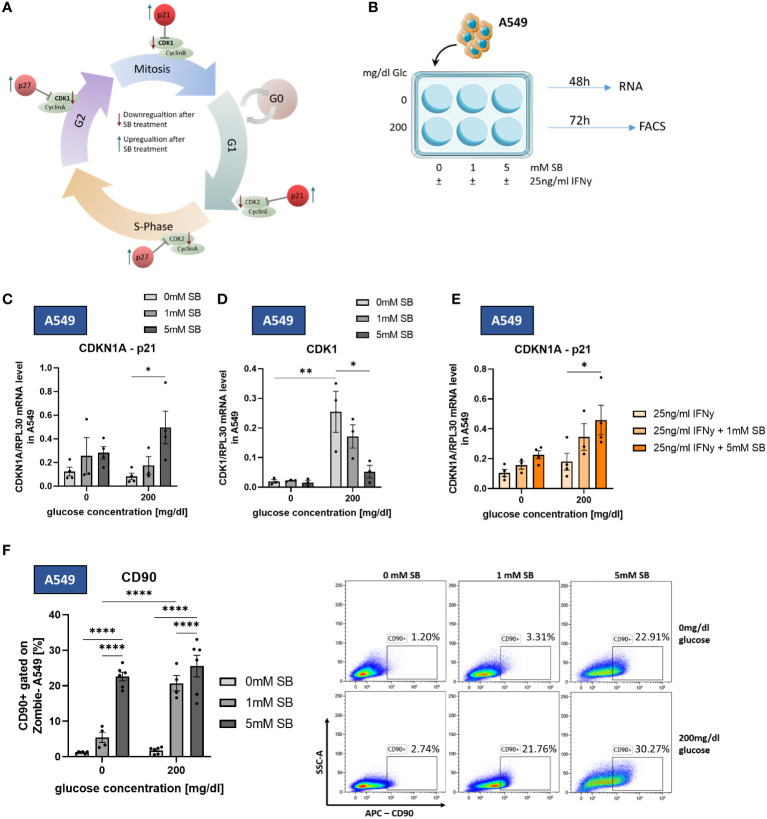
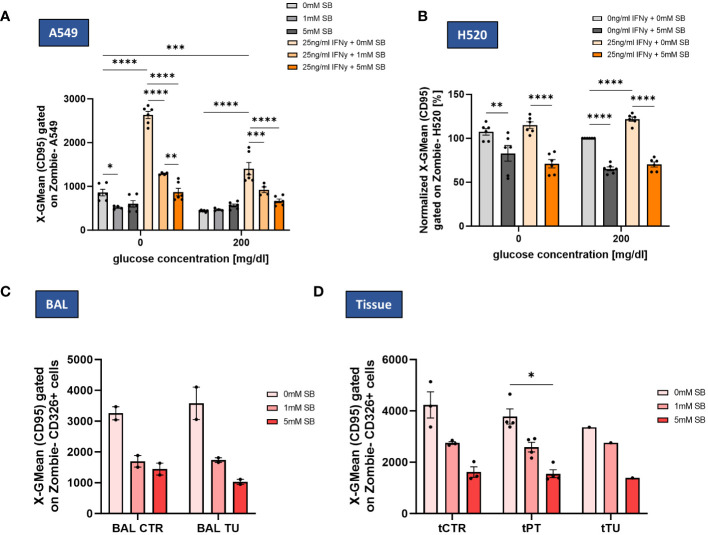
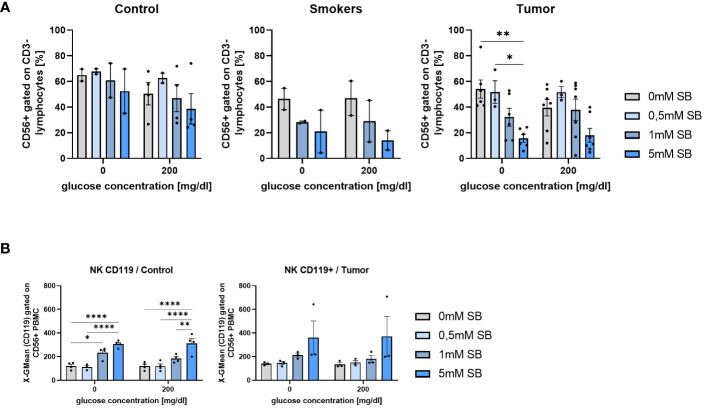
Results: To investigate the effect of SB on lung tumor cells, we first analyzed the effect of 6 different concentrations of SB on A549 cells at 48 and 72 hours cell culture. Here we found that, SB treatment reduced lung cancer cell survival in a concentration dependent manner. We next focused our deeper analysis on the two concentrations, which caused the maximal reduction in cell survival. Here, we observed that SB led to cell cycle arrest and induced early apoptosis in A549 lung cancer cells. The expression of cell cycle regulatory proteins and A549 lung cancer stem cell markers (CD90) was induced. Additionally, this study explored the role of interferon-gamma (IFN-γ) and its receptor (IFN-γ-R1) in combination with SB treatment, revealing that, although IFN-γ-R1 expression was increased, IFN-γ did not affect the efficacy of SB in reducing tumor cell viability. Furthermore, we examined the effects of SB on immune cells, specifically CD8+ T cells and natural killer (NK) cells from healthy individuals, smokers, and NSCLC patients. SB treatment resulted in a decreased production of IFN-γ and granzyme B in CD8+ T cells and NK cells. Moreover, SB induced IFN-γ-R1 in NK cells and CD4+ T cells in the absence of glucose both in PBMCs from controls and NSCLC subjects.

Conclusion: Overall, this study highlights the potential of SB in inhibiting lung cancer cell growth, triggering apoptosis, inducing cell cycle arrest, and modulating immune responses by activating peripheral blood CD4+ T cells while selectively inducing IFN-γ-R1 in NK cells in peripheral blood and inhibiting peripheral blood CD8+ T cells and NK cells. Thus, understanding the mechanisms of action of SB in the TME and its influence on the immune system provide valuable insights of potentially considering SB as a candidate for adjunctive therapies in NSCLC.

Keywords: A549; IFN-γ-receptor; NSCLC; T cells; glucose; lung cancer; short chain fatty acids (SCFA); sodium butyrate.


Conflict of interest statement

The authors declare that the research was conducted in the absence of any commercial or financial relationships that could be construed as a potential conflict of interest. The author(s) declared that they were an editorial board member of Frontiers, at the time of submission. This had no impact on the peer review process and the final decision.

Figures

Figure 1
Figure 1
SB reduced cell viability in lung cancer cell lines A549 and H520, as well as in NSCLC-patient derived epithelial cells. (A) Cell count of living and dead A549 cultured with different SB concentrations (0-20mM SB) after 48h (left panel) and 72h (right panel); (B) Schematic illustration of the experimental design. 5x10⁵ A549 or H520 cells per well were incubated for 48 or 72h with 200mg/dl glucose or without and SB concentrations increased from 0mM over 1mM to 5mM SB; (C) Percentages of the cell count of living A549 cells stained with trypan blue solution after 48h or 72h of SB treatment 48h in relation to the control population (200mg/dl glucose, 0mM SB, (n=8); (D) Percentages of the cell count of living H520 cells stained with trypan blue solution after 48h (n=2) or 72h (n=6) of SB treatment in relation to the control population (200mg/dl glucose, 0mM SB),; (E) Schematic illustration of the experimental design of the human study. BALF- or tissue-derived cells were cultured in collagen coated wells for 72h with increasing SB concentrations from 0mM over 1mM to 5mM SB and analyzed by FACS; (F) Percentages of Zombie- (living) CD326+ epithelial cells or Zombie + (dead) CD326+ epithelial cells cultured from BALF in control regions and tumor regions with different SB concentrations analyzed by flow cytometry, (ncontrol=2; ntumor=2); (G) Percentages of Zombie- (living) CD326+ epithelial cells or Zombie + (dead) CD326+ epithelial cells cultured from lung tissue samples in control, peritumoral and tumor regions with different SB concentrations analyzed by flow cytometry, (ncontrol=3, nperitumoral=4, ntumor=1); (*P < 0.05; **P < 0.01; *** P<0.001; ****P < 0.0001). Two-way ANOVA test was used for figure (A), one-way ANOVA test was used for figure (C, D, F, G left panel), Kruskal-Wallis test was used for figure (G right panel). All data are presented as mean values ± SEM.; Parts of the figure were drawn by using pictures from Servier Medical Art and is licensed under a Creative Commons Attribution 3.0 Unported License (https://creativecommons.org/licenses/by/3.0/).
Figure 2
Figure 2
SB induced IFN-γ-R1 surface expression and reduced cell viability in combined treatment with rhIFN-γ. (A) Geometric mean of CD119 expression on A549 cell surface after 72h cell culture with 0, 1 and 5mM SB treatment and corresponding histograms without glucose (top) and with 200mg/dl glucose (bottom), analyzed by flow cytometry, (n=6); (B) Schematic illustration of the experimental design. 5x10⁵ A549 or H520 cells per well were incubated for 48h or 72h with 200mg/dl glucose or without and SB concentrations increased from 0mM over 1mM to 5mM SB with additionally 25ng/ml rhIFN-γ; (C) Percentages of the cell count of living A549 cells stained with trypan blue solution after 48h or 72h of rhIFN-γ treatment in relation to the norm population (200mg/dl glucose, 0ng/ml rhIFN-γ, 0mM SB), (n=8); (D) Percentages of the cell count of living A549 cells stained with trypan blue solution after 48h or 72h of SB and rhIFN-γ treatment in relation to the norm population (200mg/dl glucose, 25ng/ml rhIFN-γ 0mM SB), (n=8); (E) Percentages of the cell count of living H520 cells stained with trypan blue solution after 48h (n=2) or 72h (n=6) of rhIFN-γ treatment in relation to the norm population (200mg/dl glucose, 0ng/ml rhIFN-γ 0mM SB); (F) Percentages of the cell count of living H520 cells stained with trypan blue solution after 48h (n=2) or 72h (n=6) of rhIFN-γ and SB treatment in relation to the norm population (200mg/dl glucose, 25ng/ml rhIFN-γ 0mM SB; (G) Geometric mean of CD119 expression on A549 cell surface after 72h cell culture, with 25ng/ml rhIFN-γ and additional 0, 1 and 5mM SB treatment and analyzed by flow cytometry, (n=6); (H) Geometric mean of CD119 expression on H520 cell surface after 72h cell culture (n=6). (*P < 0.05; **P < 0.01; ***P < 0.001; ****P < 0.0001). One-way ANOVA test was used for figure (C, D, F), Kruskal-Wallis test was used for figure (A, E, G, H) All data are presented as mean values ± SEM. Parts of the figure were drawn by using pictures from Servier Medical Art and is licensed under a Creative Commons Attribution 3.0 Unported License (https://creativecommons.org/licenses/by/3.0/).
Figure 3
Figure 3
SB induced apoptosis in lung cancer cell lines and NSCLC-patient-derived cells. (A) Percentages of Annexin V/PI FACS analysis of A549 cells: living cells (Annexin V- PI-), early apoptotic cells (Annexin V+ PI-), late apoptotic cells (Annexin V+ PI+) and necrotic cells (Annexin V- PI+), (n=8); (B) Dotplots of Annexin V/PI FACS analysis of A549 cells after treatment with SB; (C) Dotplots of Annexin V/PI FACS analysis of A549 cells after treatment with rhIFN-γ and SB; (D) Percentages of Annexin V/PI FACS analysis of living cells (Annexin V- PI-), early apoptotic cells (Annexin V+ PI-), late apoptotic cells (Annexin V+ PI+) and necrotic cells (Annexin V- PI+), (n=8); (E) Percentages of Annexin V/PI FACS analysis of H520 cells: living cells (Annexin V- PI-), early apoptotic cells (Annexin V+ PI-), late apoptotic cells (Annexin V+ PI+) and necrotic cells (Annexin V- PI+), (n=6); (F) Annexin V/PI FACS analysis of patient BALF derived epithelial cells, apoptotic cells (Annexin V+) and induction of apoptosis based on each patient with 0mM SB for control and tumor, (n=2); (G) Annexin V/PI FACS analysis of patient tissue derived epithelial cells, apoptotic cells (Annexin V+) and induction of apoptosis based on each patient with 0mM SB for control and tumor, (ncontrol=3, nperitumoral=4, ntumor=1); (*P < 0.05; **P < 0.01; ***P < 0.001; ****P < 0.0001). Two-way_ANOVA test was used for figure (A, D, E), one-way ANOVA test was used for figure (F, G right panel) Kruskal-Wallis test was used for figure (G left panel). All data are presented as mean values ± SEM.
Figure 4
Figure 4
SB induced cell cycle arrest trough upregulation of p21 and downregulation of CDK1. CD90 surface expression increased upon SB treatment. (A) Schematic representation of cell cycle regulating proteins influenced by SB. SB leads to a lower gene expression of the cyclin-dependent kinases (CDKs), which are required for the normal cell cycle (green). The counterpart of the CDKs are kinase inhibitors, like p21, p27 and p16 (red). These inhibitors stopping the cell cycle at each checkpoint and therefore the proliferation of the cell; (B) qPCR analysis of relative CDKN1A(p21)/RPL30 mRNA expression in SB treated A549, (n=4); (C) qPCR analysis of relative CDK1/RPL30 mRNA expression in SB treated A549, (n=4); (D) qPCR analysis of relative CDKN1A/RPL30 mRNA expression in SB treated A549, (n=4); (E) A549 cells treated with SB were stained with anti-CD90 antibody and analyzed with flow cytometry, (n=6); (*P < 0.05; **P < 0.01; ****P < 0.0001). One-way ANOVA test was used for figure (D, F), Kruskal-Wallis test was used for figure (C, E). All data are presented as mean values ± SEM.
Figure 5
Figure 5
SB decreased IFN-γ induced CD95 cell surface expression in lung cancer cell lines and NSCLC patient-derived cells. (A) SB reversed IFN-γ induced CD95 upregulation, geometric mean of CD95 expression on A549 cell surface after 72h analyzed by flow cytometry, (n=6); (B) Geometric mean of CD95 expression on H520 cell surface after 72h of cell culture normalized to the control population (200mg/dl glucose, 0mM SB, 0ng/ml IFN-γ), (n=6); (C) Geometric mean of CD95 surface expressing cells gated on CD326+ Zombie- BALF epithelial cells in control and tumor regions analyzed by flow cytometry (ncontrol=2; ntumor=2); (D) Geometric mean of CD95 surface expressing cells gated on CD326+ Zombie- tissue derived epithelial cells in control, peritumoral and tumor regions analyzed by flow cytometry, (ncontrol=3, nperitumoral=4, ntumor=1); (*P < 0.05; **P < 0.01; ***P < 0.001, ****P<0.0001). One-way ANOVA test was used for figure (A, B), Kruskal-Wallis test was used for figure (C, D) All data are presented as mean values ± SEM.
Figure 6
Figure 6
CD8+ T cells and their IFN-γ and Granzyme production decreased after 96h SB treatment in vitro with different glucose levels; Percentages of CD4+ T cells increased upon SB treatment in all populations (A) Schematic illustration of the experimental design. 5x10⁵ PBMC from human patients per well with 500µl medium were incubated for 96h with 200mg/dl glucose or without and SB concentrations increased from 0mM, 0.5mM over 1mM to 5mM SB; (B) Percentages of CD8+ T cells gated on CD3+ Zombie- lymphocytes in control, smoker and tumor patients, (ncontrol=6; nsmoker=4; ntumor=8); (C) Percentage of IFN-γ production in CD8+ T cells after treatment with 0, 1, 5mM SB and aCD3/28 stimulation for 96h analyzed by flow cytometry, (ncontrol=3; nsmoker=2; ntumor=4); (D) Percentages of granzymeB production in CD8+ T cells treated with 0,1, 5mM SB and aCD3/28 stimulation for 96h; analyzed by flow cytometry, (ncontrol=3; nsmoker=2; ntumor=4); (E) Percentages of CD4+ CD3+ T cells gated on lymphocytes, cultured for 96h as described in Figure 4A , analyzed by flow cytometry, (ncontrol=6; nsmoker=4; ntumor=8); (*P < 0.05; **P < 0.01; ***P < 0.001; ****P < 0.0001). One-way ANOVA test was used for figure (B middle and left panel, C–E) Kruskal-Wallis test was used for figure (B left panel). All data are presented as mean values ± SEM. Parts of the figure were drawn by using pictures from Servier Medical Art and is licensed under a Creative Commons Attribution 3.0 Unported License (https://creativecommons.org/licenses/by/3.0/).”.
Figure 7
Figure 7
SB treatment led to decreased NK cell proportion in cultured PBMC from lung cancer patients (A) CD56+CD3- % NK cells of PBMC from control, smoker and lung tumor patients, cultured as described in Figure 4A , (ncontrol=4; nsmoker=2; ntumor=7); (B) Geometric mean of CD119 expression on NK cell (CD56+CD3-) surface after 96h, cultured as described in Figure 4A , analyzed by flow cytometry, (ncontrol=4; ntumor=3); (*P < 0.05; **P < 0.01; ****P < 0.0001). One-way ANOVA test was used for figure (A right panel, B left panel) Kruskal-Wallis test was used for figure (A left panel, B right panel). All data are presented as mean values ± SEM.

References

    1. Siegel RL, Miller KD, Wagle NS, Jemal A. Cancer statistics, 2023. CA Cancer J Clin. (2023) 73:17–48. doi: 10.3322/caac.21763 - DOI - PubMed
    1. Herbst RS, Heymach JV, Lippman SM. Lung cancer. N Engl J Med. (2008) 359:1367–80. doi: 10.1056/NEJMra0802714 - DOI - PMC - PubMed
    1. Mielgo-Rubio X, Uribelarrea EA, Cortés LQ, Moyano MS. Immunotherapy in non-small cell lung cancer: Update and new insights. J Clin Transl Res. (2021) 7:1–21. doi: 10.18053/jctres.07.202101.001 - DOI - PMC - PubMed
    1. Warburg O, Wind F, Negelein E. THE METABOLISM OF TUMORS IN THE BODY. J Gen Physiol. (1927) 8:519–30. doi: 10.1085/jgp.8.6.519 - DOI - PMC - PubMed
    1. Dang AT, Marsland BJ. Microbes, metabolites, and the gut-lung axis. Mucosal Immunol. (2019) 12:843–50. doi: 10.1038/s41385-019-0160-6 - DOI - PubMed

Publication types

MeSH terms