. 2024 Sep;20(9):2055-2066.
doi: 10.1080/15548627.2024.2341588. Epub 2024 Apr 23.

The Wolfram-like variant WFS1E864K destabilizes MAM and compromises autophagy and mitophagy in human and mice

Affiliations

The Wolfram-like variant WFS1E864K destabilizes MAM and compromises autophagy and mitophagy in human and mice

Simone Patergnani et al. Autophagy. 2024 Sep.

Abstract

Dominant variants in WFS1 (wolframin ER transmembrane glycoprotein), the gene coding for a mitochondria-associated endoplasmic reticulum (ER) membrane (MAM) resident protein, have been associated with Wolfram-like syndrome (WLS). In vitro and in vivo, WFS1 loss results in reduced ER to mitochondria calcium (Ca2+) transfer, mitochondrial dysfunction, and enhanced macroautophagy/autophagy and mitophagy. However, in the WLS pathological context, whether the mutant protein triggers the same cellular processes is unknown. Here, we show that in human fibroblasts and murine neuronal cultures the WLS protein WFS1E864K leads to decreases in mitochondria bioenergetics and Ca2+ uptake, deregulation of the mitochondrial quality system mechanisms, and alteration of the autophagic flux. Moreover, in the Wfs1E864K mouse, these alterations are concomitant with a decrease of MAM number. These findings reveal pathophysiological similarities between WS and WLS, highlighting the importance of WFS1 for MAM's integrity and functionality. It may open new treatment perspectives for patients with WLS.Abbreviations: BafA1: bafilomycin A1; ER: endoplasmic reticulum; HSPA9/GRP75: heat shock protein family A (Hsp70) member 9; ITPR/IP3R: inositol 1,4,5-trisphosphate receptor; MAM: mitochondria-associated endoplasmic reticulum membrane; MCU: mitochondrial calcium uniporter; MFN2: mitofusin 2; OCR: oxygen consumption rate; ROS: reactive oxygen species; ROT/AA: rotenone+antimycin A; VDAC1: voltage dependent anion channel 1; WLS: Wolfram-like syndrome; WS: Wolfram syndrome; WT: wild-type.

Keywords: Autophagy; WFS1; Wolfram-like syndrome; mitochondria-associated endoplasmic reticulum membrane; mitophagy.


Conflict of interest statement

No potential conflict of interest was reported by the author(s).

Figures
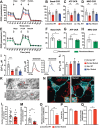
Figure 1.
Figure 1.
Wfs1E864K protein leads to decreased mitochondrial respiration in patients’ fibroblasts and Wfs1E864K mutant mice, as well as altered Ca2+ transfer and a decrease of ER-mitochondria contacts in mice. (A-D) Oxygen consumption rate (OCR) traces of wild-type and mutant cortex and hippocampus (Hip.) neuronal cultures, expressed as picomoles of O2 per minute, under basal conditions and after the injection of oligomycin (1.5 μM), FCCP (1 μM) and ROT/AA (1 μM). Quantification of basal (B), ATP-related (C) and maximal (D) respiration rates, calculated from OCR traces and expressed as means ± SD. (E-H) Oxygen consumption rate (OCR) traces of control (WT) and patient fibroblasts (Mutant), expressed as picomoles of O2 per minute, under basal conditions and after the injection of oligomycin (1.5 μM), FCCP (1 μM) and ROT/AA (1 μM). Quantifications of basal (F), ATP-related (G) and maximal (H) respiration rates, calculated from OCR traces and expressed as means ± SD. (I-J) Representative traces of aequorin-based measurements of neurons obtained from cortex and hippocampi of Wfs1 (WT, cortex: black line, hippocampus: gray line) and Wfs1E864K (Mutant, cortex: red line, hippocampus: blue line) mice. Mitochondrial Ca2+ (I) and cytosolic Ca2+ (J) uptake measured after 10 μM glutamate stimulation. Quantification of mitochondrial Ca2+ (I) and cytosolic Ca2+ uptake (J), expressed as means ± SD, for hippocampus and cortex neuronal cultures of Wfs1 and Wfs1E864K (mutant) mice. (K-M) Transmission electron micrographs of cortical neurons from three mutant and three WT mice. Contact between ER and outer membrane of a mitochondrion with a distance smaller than 30 nm is pointed by the red arrow. m: mitochondria, scale bar: 200 nm. Quantification of the number of mitochondria per neuron (L) and number of mitochondria in contact with ER (distance <30 nm) (M), data are expressed as means ± SEM. (N-O) Colocalization of mitochondria and lysosomes in cultured cortical neurons from mutant and WT mice. (N) Representative images of a 3D reconstructed picture of Wfs1 and Wfs1E864K (mutant) cortex neurons transfected with the ER marker SEC61B/Sec61 beta pAcGFP-C1 (GFP-SEC61B, cyan) and loaded with the mitochondrial marker MitoTracker (red), scale bar: 10 μm. The insets are a 2-fold magnification of the boxed areas. (O) Calculation of the colocalization rate between ER and mitochondria, using Pearson’s coefficient, data are expressed as means ± SEM. The total area (P) and the circularity of the mitochondria (Q) were also measured on the transmission electron micrographs of cortical neurons. Data are expressed as means ± SEM. All tested animals were at 33-days-old at the time of experimentation. Per group, n = 8–9 for (B-D), n = 5–6 for (F-H), n = 4 for (I), n = 8–9 for (J) n = 24 (8 technical replicates and 3 biological replicates) for (L), n = 16 (8 technical replicates and 2 biological replicates) for (M), n = 17 for (O), and n = 353 mitochondria for WT and n = 187 for mutant for (P) and (Q). Unpaired t-tests: * p < 0.05, ** p < 0.01, *** p < 0.001. Oligo, oligomycin; FCCP, carbonyl cyanide-4(trifluoromethoxy)phenylhydrazone; Rot/AA, rotenone+antimycin A.
Figure 2.
Figure 2.
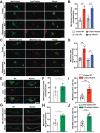
WFS1E864K protein alters mitophagy and is associated with an older mitochondrial population in fibroblasts from patient with WLS and neuronal cultures derived from WLS mouse model cortex and hippocampi. (A-B) Mitophagy activation assessment: (A) Confocal microscopy images of wild-type (WT) and mutant cortex and hippocampus (Hip.) neuronal cultures labeled with mitochondrial (MitoTracker, green) and lysosomal (LysoTracker, red) markers and quantification of the colocalization dots (B). (C-D) MitoTimer measurements of mitochondrial age WT and mutant cortex and hippocampus neuronal cultures: (C) Representative confocal fluorescent images of the green, the red channels, and the merge. (D) Quantification of the red:green intensities ratio. (E-F) Mitophagy activation assessment: (E) Confocal microscopy images of fibroblasts labeled with mitochondrial (MitoTracker, green) and lysosomal (LysoTracker, red) markers and quantification of the colocalization dots (F). (G-H) Mitochondria turnover assessment using MitoTimer measurements in fibroblasts: (G) Representative epifluorescent images of the green, the red channels, and the merge. (H) Quantification of the red:green intensities ratio. (I-J) Quantification of MitoSOX-positive cells in WT and mutant cortex neuronal cultures (I) and fibroblasts (J). Data are expressed as means ± SD. Each value is the mean of n = 6 per condition in (B), n = 8–13 in (D), n = 7 in (F), n = 8 in (H), n = 18 in (I) and (J). Scale bar: 10 μm for all panels in (A) and (C), 20 μm for all panels in (E) and (G). Unpaired t-tests: *p < 0.05, ***p < 0.001, ****p < 0.0001.
Figure 3.
Figure 3.
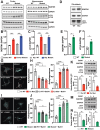
WFS1E864K protein induces an altered autophagy flux in mouse neurons and fibroblasts. (A-C) Autophagy in neuronal cultures derived from Wfs1E864K mice: (A) Representative immunoblot showing the increase of SQSTM1 and the autophagic form of LC3 (LC3-II) in neurons cultured from the cortex and hippocampus (Hip.) of Wfs1 (WT) and Wfs1E864K (mutant) mice. The purity of neuronal cultures was assessed with immunoblot against the neuronal marker TUBB3/β3-tubulin. GAPDH was used as loading control. Densitometry ratios of SQSTM1 and LC3-II over GAPDH are shown in (B) and (C). Data are expressed as means ± SD. (D-F) Autophagy in patient’s fibroblasts: (D) Representative immunoblot showing the increase of SQSTM1 and LC3 lipidation in fibroblasts from control (WT) and patient harboring the WFS1E864K variant (Mut). GAPDH was used as loading control. Densitometry ratios of SQSTM1 and LC3-II over GAPDH are shown in (E) and (F). Data are expressed as means ± SD. (G-H) Autophagy flux in neuronal cultures derived from Wfs1E864K mice: (G) Representative images of 3D reconstructed fluorescence microscopy acquisition of cortical neurons transfected with the LC3-tandem mCherry-GFP-LC3 plasmid. Autolysosomes are labeled in red (mCherry+; GFP) and autophagosomes in white (mCherry+; GFP+). To note, to enhance the visualization of the dots, GFP-positive cells are labeled in cyan. To mimic a blockage of the autophagic flux, 100 nM bafilomycin A1 (BafA1) was added for 2 h. (H) Quantification of autolysosomes (mCherry+; GFP cells) and autophagosomes (mCherry+; GFP+) per cortical neuron-derived cell, expressed as means ± SD. (I-J) Autophagy flux in patient’s fibroblasts: (I) Representative images of 3D reconstructed fluorescence microscopy acquisition of fibroblasts transfected with the LC3-tandem mCherry-GFP-LC3 plasmid. Autolysosomes are labeled in red (mCherry+; GFP) and autophagosomes in white (mCherry+; GFP+). To note, to enhance the visualization of the dots, GFP positive cells are labeled in cyan. To mimic a blockage of the autophagic flux, 100 nM bafilomycin A1 (BafA1) was added for 2 h. (J) Quantification of autolysosomes (mCherry+; GFP cells) and autophagosomes (mCherry+; GFP+) per fibroblast, expressed as means ± SD. (K) Representative immunoblots showing the increase of SQSTM1 and LC3-II after the inhibition of the autophagic flux using BafA1 in neuronal cultures derived from Wfs1E864K mice and their quantification (L). The intensities of SQSTM1 and LC3-II bands after BafA1 treatment (BafA1+) are expressed in fold increase of the intensity of these bands in resting conditions (BafA1). The intensity of each band was first normalized against the intensity of the GAPDH band (loading control). Data are expressed as means ± SD. (M) Representative immunoblots showing the increase of SQSTM1 and LC3-II after the inhibition of the autophagic flux using BafA1 in patient’s fibroblasts and their quantification. (N) The intensities of SQSTM1 and LC3-II bands after BafA1 treatment (BafA1+) are expressed in fold increase of the intensity of these bands in resting conditions (BafA1). The intensity of each band was first normalized against the intensity of the GAPDH band (loading control). Data are expressed as means ± SD. Each value is the mean of n = 4 per condition in (B, C), n = 3 in (E, F), n = 9 in (H, L) and n = 3 in (J, N). Scale bar: 10 μm. Unpaired t-tests for (B-C), (E-F), (L) and (M): *p < 0.05, **p < 0.01, ***p < 0.001. Two-way ANOVA followed by Tukey’s multiple comparisons test for (H) and (J): p < 0.0001 for the genotype, p < 0.0001 for the BafA1 treatment, ****p < 0.001 vs. WT, #p < 0.05, ##p < 0.01, ns = non-significant vs. mutant.

References

    1. Fonseca SG, Fukuma M, Lipson KL, et al. WFS1 is a novel component of the unfolded protein response and maintains homeostasis of the endoplasmic reticulum in pancreatic beta-cells. J Biol Chem. 2005;280:39609–39615. doi: 10.1074/jbc.M507426200 - DOI - PubMed
    1. Barrett TG, Bundey SE, Macleod AF.. Neurodegeneration and diabetes: UK nationwide study of Wolfram (DIDMOAD) syndrome. Lancet. 1995;346(8988):1458–1463. doi: 10.1016/S0140-6736(95)92473-6 - DOI - PubMed
    1. Rigoli L, Bramanti P, Di Bella C, et al. Genetic and clinical aspects of wolfram syndrome 1, a severe neurodegenerative disease. Pediatr Res. 2018;83(5):921–929. doi: 10.1038/pr.2018.17 - DOI - PubMed
    1. de Heredia ML, Clèries R, Nunes V, et al. Genotypic classification of patients with Wolfram syndrome: insights into the natural history of the disease and correlation with phenotype. Genet Med. 2013;15(7):497–506. doi: 10.1038/gim.2012.180 - DOI - PubMed
    1. de Muijnck C, Brink JBT, Bergen AA, et al. Delineating Wolfram-like syndrome: a systematic review and discussion of the WFS1-associated disease spectrum. Surv Ophthalmol. 2023;68(4):641–654. doi: 10.1016/j.survophthal.2023.01.012 - DOI - PubMed

Publication types