. 2025 Aug;34(15):e17334.
doi: 10.1111/mec.17334. Epub 2024 Apr 23.

The road less taken: Dihydroflavonol 4-reductase inactivation and delphinidin anthocyanin loss underpins a natural intraspecific flower colour variation

Affiliations

The road less taken: Dihydroflavonol 4-reductase inactivation and delphinidin anthocyanin loss underpins a natural intraspecific flower colour variation

Darren C J Wong et al. Mol Ecol. 2025 Aug.

Abstract

Visual cues are of critical importance for the attraction of animal pollinators, however, little is known about the molecular mechanisms underpinning intraspecific floral colour variation. Here, we combined comparative spectral analysis, targeted metabolite profiling, multi-tissue transcriptomics, differential gene expression, sequence analysis and functional analysis to investigate a bee-pollinated orchid species, Glossodia major with common purple- and infrequent white-flowered morphs. We found uncommon and previously unreported delphinidin-based anthocyanins responsible for the conspicuous and pollinator-perceivable colour of the purple morph and three genetic changes underpinning the loss of colour in the white morph - (1) a loss-of-function (LOF; frameshift) mutation affecting dihydroflavonol 4-reductase (DFR1) coding sequence due to a unique 4-bp insertion, (2) specific downregulation of functional DFR1 expression and (3) the unexpected discovery of chimeric Gypsy transposable element (TE)-gene (DFR) transcripts with potential consequences to the genomic stability and post-transcriptional or epigenetic regulation of DFR. This is one of few known cases where regulatory changes and LOF mutation in an anthocyanin structural gene, rather than transcription factors, are important. Furthermore, if TEs prove to be a frequent source of mutation, the interplay between environmental stress-induced TE evolution and pollinator-mediated selection for adaptive colour variation may be an overlooked mechanism maintaining floral colour polymorphism in nature.

Keywords: anthocyanin; dihydroflavonol 4‐reductase; flower; food deception; orchid; transposable element.


Conflict of interest statement

The authors declare that the research was conducted in the absence of any commercial or financial relationships that could be construed as a potential conflict of interest.

Figures

FIGURE 1
FIGURE 1
The visual signals Glossodia major flower colour in bee colour space. (a) Known bee pollinators of G. major include various members of the genus Lasioglossum (i—L. calophyllae, ii—L. gynochilum, iii—L. hemichalceum, iv—L. hilcatum and v—L. lanarium), Exoneura bicolor and vi—Homalictus urbanus (Kuiter, 2016). (b) Key floral structures of Glossodia major and associated spectral reflectance curves. (c) Honey bee (Apis mellifera) hexagon colour model (Chittka, 1992) for (i) purple morph purple petals (PPP) and (ii) purple morph white labellum (PWL), white morph white petal (WWP) and white morph white labellum (WWL). (d) Between‐ and within‐morph chromatic contrasts of key floral structures based on Euclidean distances in the hexagon colour space (as hexagon units). Dashed lines represent a practical threshold of colour discrimination by pollinators. Values >0.1 are deemed distinguishable by pollinators.
FIGURE 2
FIGURE 2
The anthocyanin chemistry of Glossodia major flower colour. (a) Comparison of morphs for flowers and stems. (b) Estimated content (μg/g FW) of individual and total anthocyanin content (average + SE) in the petal and stems of the purple morph. (c) Absorbance spectra at 520 nm annotated with putative anthocyanins A1–A6. (d) Putative anthocyanin chemical structures and (e) MS/MS fragmentation spectra of A1–A6 (see Table 1 for additional details). Dotted arrows indicate fragmentation patterns suggested by mass spectra. Note that the abundant 303 ion is the mass of delphinidin. Glc, glucosyl; Mal, malonyl.
FIGURE 3
FIGURE 3
Transcriptomic analysis of Glossodia major floral and vegetative tissues. (a) Representative gene space completeness of the merged multi‐tissue (floral, stem and leaf) transcriptomes of the purple morph. Benchmarking Universal Single‐Copy Orthologs (BUSCO) results of the full assembly (FA), redundancy resolved and accurate gene sets predicted transcriptome (FA + Evg) and representative primary transcripts of FA + Evg (FA + Evg(P)) are shown. (b) Shortcut coalescent species tree of the Orchidaceae (spanning 5 subfamilies, 13 tribes, 21 subtribes and 49 genera) and an outgroup Asparagales taxon. Purple asterisk indicates the placement of Glossodia major (white and purple morphs). Left inset indicate subfamily grouping and taxonomic representativeness of included orchid at the genera, tribal and subtribal level. Branch colours correspond to gene concordance factors (gCF) – the proportion of gene trees that decisively support the given bifurcation. Branch labels indicate local posterior probability scores <1. (c) Principal component analysis of the purple (colour‐filled) and white (empty) morph multi‐tissue transcriptomes based on a final set of 17,737 expressed genes. Circle, triangle and square denote petal, stem and leaf tissues respectively. (d) Volcano plot depicting the distribution of between‐morphs (i.e. purple vs. white) petal, stem and leaf tissue differentially expressed genes. Significant upregulation (FDR < 0.05, log2FC > 0.5) or downregulation (FDR < 0.05, log2FC < −0.5) in respective comparisons are indicated by purple and green colours, respectively while orange indicates no differential expression. Score indicates −log10FDR. (e) A summary of the total number of significantly up‐ and downregulated genes in (d). (f) Summary of Mapman BIN v4 functional categories describing generalised plant biological processes enriched (FDR < 0.01) in significantly up (red) and down (blue)‐regulated genes identified from between‐morphs tissue‐specific comparisons in (d). The size and opacity of circles indicate the number of genes annotated in the enriched category and its enrichment significance, respectively. Asterisks indicate functional categories that are consistently up−/down‐regulated in at least two comparisons.
FIGURE 4
FIGURE 4
Gene expression dynamics of anthocyanin and flavonol metabolic pathways in the purple and white morph Glossodia major. Box plot depicts the distribution of normalised expression values (FPKM) of corresponding anthocyanin (purple) biosynthetic (i.e. CHS, CHI, F3H, F3′H, F3′,5′H, DFR, ANS and arGST) and the key flavonol (grey) pathway (i.e. FLS) genes in the petal and stem tissues of respective morphs. Anthocyanin decoration‐related FGT and MAT gene homologues are depicted in light blue and pink borders respectively. Red asterisks denote significant upregulation (FDR < 0.05, log2FC > 0.5) in selected comparison (see Table S1 for descriptive statistical information). Inset depict floral and stem phenotypes of common purple and infrequent white morphs. ANS, leucoanthocyanidin dioxygenase; arGST, anthocyanin‐related glutathione transferases; CHI, chalcone isomerase; CHS, chalcone synthase; DFR, dihydroflavonol 4‐reductase; F3′5′H, flavonoid 3′,5′‐hydroxylase; F3′H, flavonoid 3′‐hydroxylase; F3H, flavanone 3‐hydroxylase; FGT, flavonoid/anthocyanin glucosyltransferase; FLS, flavonol synthase; Kae, kaempferol; MAT, flavonoid/anthocyanin malonyltransferase; Myr, myricetin; Que, quercetin.
FIGURE 5
FIGURE 5
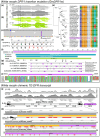
Putative dihydroflavonol 4‐reductase (DFR) loss‐of‐function variants characterise the white morph of Glossodia major. Representative read coverage (top) and collapsed alignment track (bottom) view of each white morph individual (i.e. white1 and white2) against full‐length purple morph DFR1 (GmDFR1p) sequence from the (a) petal and (b) stem tissues. (c) Representative view of pooled alignments from white morph individuals depicting a synonymous nucleotide substitution (T > C) and the exclusive presence of a 4 bp GACC insertion. (d) Multiple sequence alignment (MSA) of full‐length DFR‐encoding transcript and translated protein (bold, uppercase) sequence from the purple (GmDFR1p) morph, respectively. Only the region flanking the insertion event (red) that potentially results in a reading frameshift and a premature termination of translation (asterisks) is shown. (e) Phylogenetic tree of G. major DFR (GmDFR1p) and other functionally characterised plant DFRs and closely related reductases (e.g. anthocyanidin reductase) as outgroup. A representative MSA of the substrate specificity determining region of plant DFR is depicted. Branch length and labels indicate the total number of substitutions per site and ultrafast II bootstrap, respectively. Predicted (f) InterPro and (g) functional (e.g. NADP and substrate binding) domains of GmDFR1p. See Figures S4 and S5 for the full alignment, associated NCBI accessions, detailed results of InterPro and molecular docking results. (h) Predicted gene structure of GmDFR1p. Splice‐aware alignment of GmDFR1p onto the various orchid genome sequence. The chromosomal position, strand and associated NCBI accessions are indicated. Purple blocks (numbered) connected by arrow edges indicate putative order of exon and intron regions respectively. (i) Multiple sequence alignment of exon2 and its flanking intronic region (intron 1 and 3) of Arabidopsis thaliana (Ath), Dendrobium nobile (Dno), D. officinale (Doff), Phalaenopsis aphrodite (Pap) and Dactylorhiza incarnata (Din) alongside the putative homologous region from GmDFR1p and GmDFR1w coding sequence. The putative acceptor and donor splice site are indicated with red and green asterisks respectively. (j) A chimeric TE‐gene transcript containing partial DFR‐encoding regions (exons 4–6) in also present exclusively in the white morph (See Data S5). Supporting read coverage (white1 and white2) and representative collapsed alignment track (grey) view from petal tissues is depicted. The predicted DFR‐coding (pink rectangle) and TE‐related (white/red rectangle) sequence on the representative contig are depicted. The group‐specific antigen (GAG), protease (PROT), reverse transcriptase (RT), ribonuclease H (RH), integrase (INT) and chromodomain (CHD) protein‐coding motifs flanked by two long terminal repeat (LTR) indicative of a plant Gypsy long terminal repeat retrotransposons is depicted. (k) Alignment of the region between right LTR and putative exon4 within TE‐GmDFR1w against D. incarnata genome. Red asterisks depict putative acceptor splice site. Red (with nucleotides) and grey blocks depict mismatch and homology respectively.
FIGURE 6
FIGURE 6
Functional analysis of GmDFR1p and GmDFR1w in tobacco. (a) Representative tobacco floral colour phenotypes of wild‐type (untransformed) and transgenic 35S::GmDFR1p and 35S::GmDFR1w overexpression lines. Visible colour change from light pink (WT) to dark pink corolla colour was only observed in 35S::GmDFR1p lines. (b) Five 35S::GmDFR1p and 35S::GmDFR1w transgenic overexpression lines were obtained and verified for DNA insertion via PCR amplification of nptII. (c) Relative expression of GmDFR1p and GmDFR1w (normalised against endogenous NtTubA1) in selected 35S::GmDFR1p and 35S::GmDFR1w tobacco lines, respectively. (d) Total anthocyanin content in the flowers of selected 35S::GmDFR1p and 35S::GmDFR1w transgenic lines and WT tobacco. Blue, orange and pink colours indicate the different composition of anthocyanins represented by Del3R, delphinidin‐3‐rutinoside; Pel3R, Pelargonidin‐3‐rutinoside and Cy3R, Cyanidin‐3‐rutinoside respectively. (e) Relative expression profiles of select endogenous flavonoid biosynthetic pathway genes (i.e. CHI, Chalcone isomerase; F3H, Flavanone 3‐hydroxylase; F3′H, Flavonoid 3′‐hydroxylase; F3′5′H; ANS, Leucoanthocyanidin dioxygenase) in the WT and 35S::GmDFR1p and 35S::GmDFR1w tobacco lines. Asterisks in (d) and (e) indicate statistically significant difference between the WT and transgenic lines (*p < .05).
FIGURE 7
FIGURE 7
A graphical abstract showcasing the established (from this study) and predicted molecular mechanisms and selection forces (question marks) driving intraspecific floral colour variation of Glossodia major.

References

    1. Afendi, F. M. , Okada, T. , Yamazaki, M. , Hirai‐Morita, A. , Nakamura, Y. , Nakamura, K. , Ikeda, S. , Takahashi, H. , Altaf‐Ul‐Amin, M. , Darusman, L. K. , Saito, K. , & Kanaya, S. (2012). KNApSAcK family databases: Integrated metabolite‐plant species databases for multifaceted plant research. Plant and Cell Physiology, 53, 1–12. - PubMed
    1. Baduel, P. , & Quadrana, L. (2021). Jumpstarting evolution: How transposition can facilitate adaptation to rapid environmental changes. Current Opinion in Plant Biology, 61, 102043. - PubMed
    1. Bontpart, T. , Cheynier, V. , Ageorges, A. , & Terrier, N. (2015). BAHD or SCPL acyltransferase? What a dilemma for acylation in the world of plant phenolic compounds. New Phytologist, 208, 695–707. - PubMed
    1. Borghi, M. , Fernie, A. R. , Schiestl, F. P. , & Bouwmeester, H. J. (2017). The sexual advantage of looking, smelling, and tasting good: The metabolic network that produces signals for pollinators. Trends in Plant Science, 22, 338–350. - PubMed
    1. Buchfink, B. , Xie, C. , & Huson, D. H. (2014). Fast and sensitive protein alignment using DIAMOND. Nature Methods, 12, 59–60. - PubMed

LinkOut - more resources