. 2024 Apr 23:12:RP92819.
doi: 10.7554/eLife.92819.

Endogenous tagging using split mNeonGreen in human iPSCs for live imaging studies

Affiliations

Endogenous tagging using split mNeonGreen in human iPSCs for live imaging studies

Mathieu C Husser et al. Elife. .

Abstract

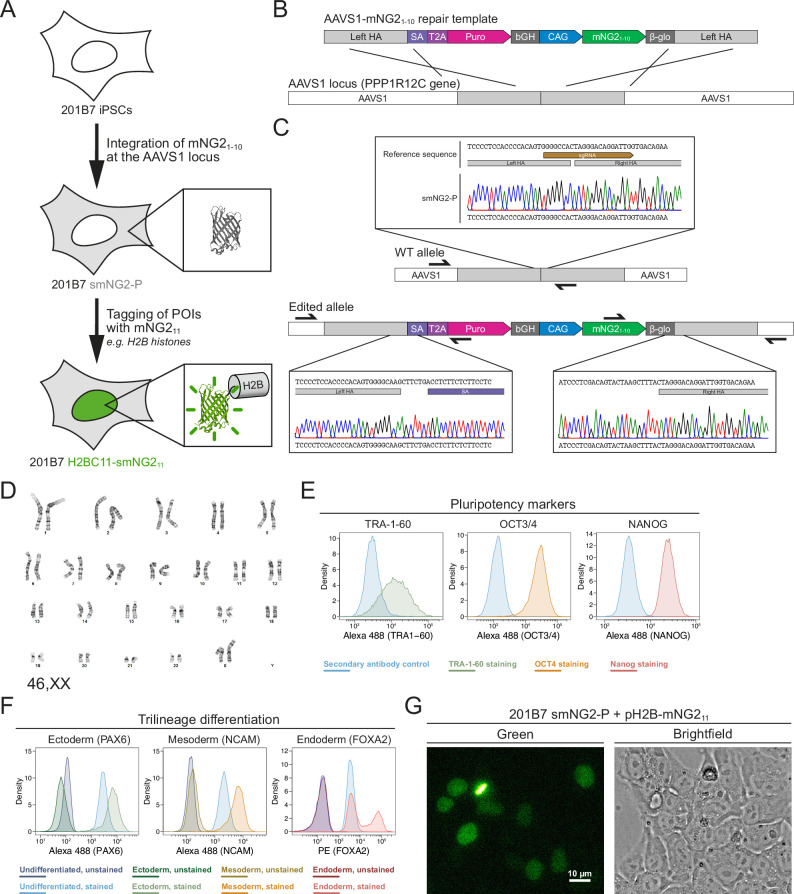
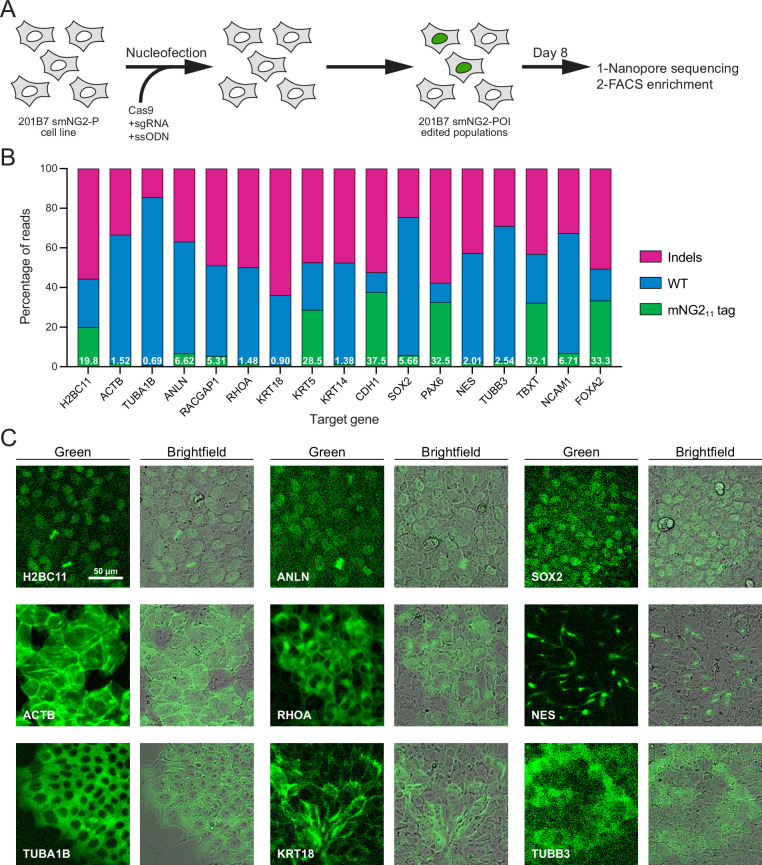
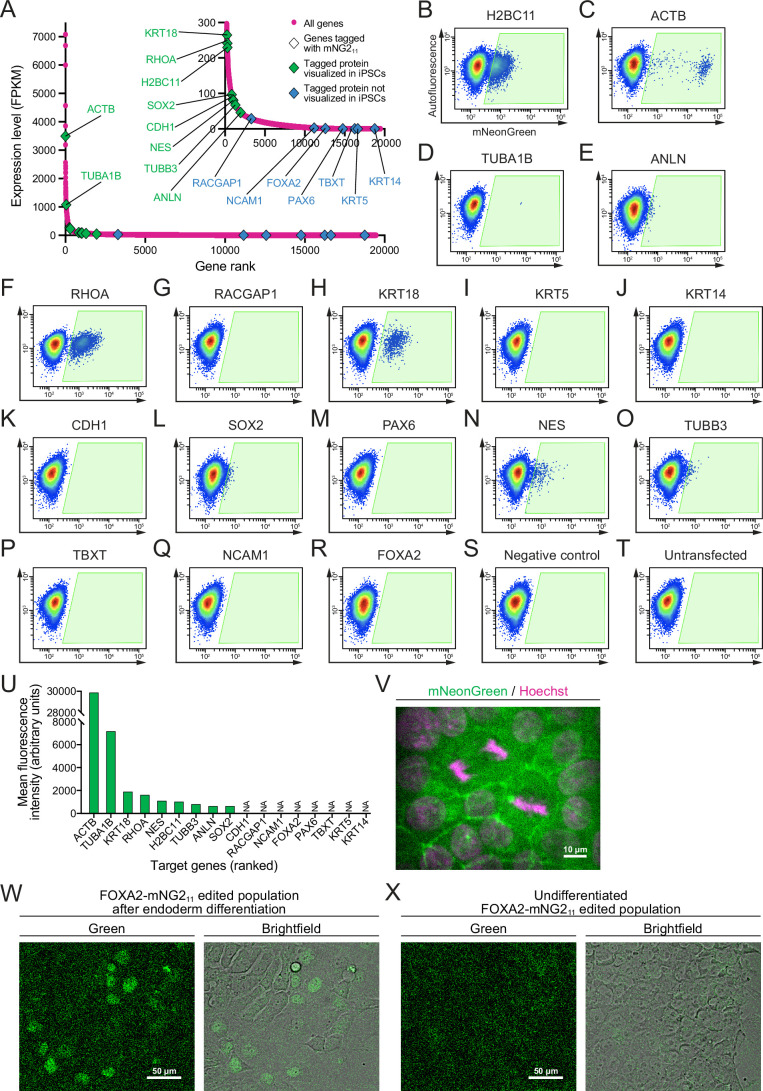
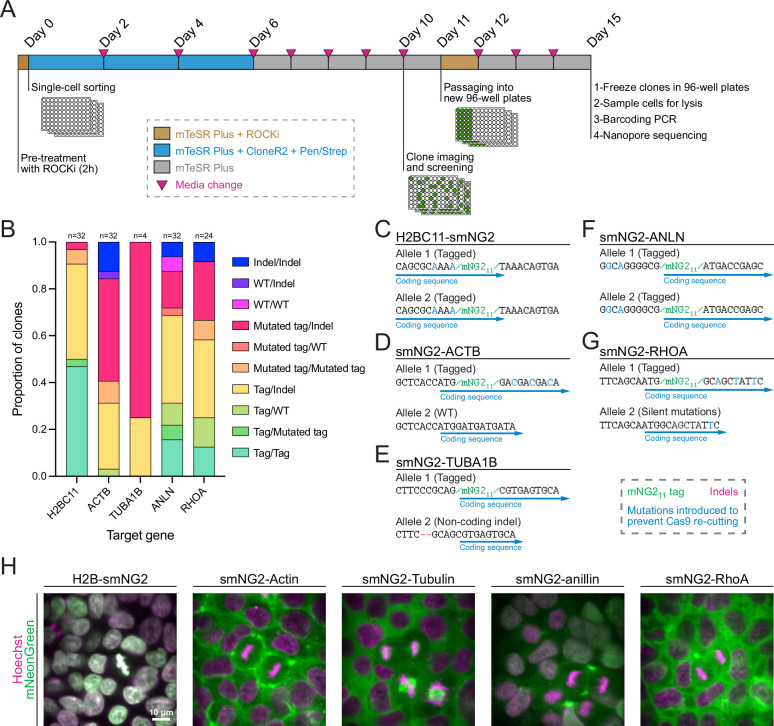
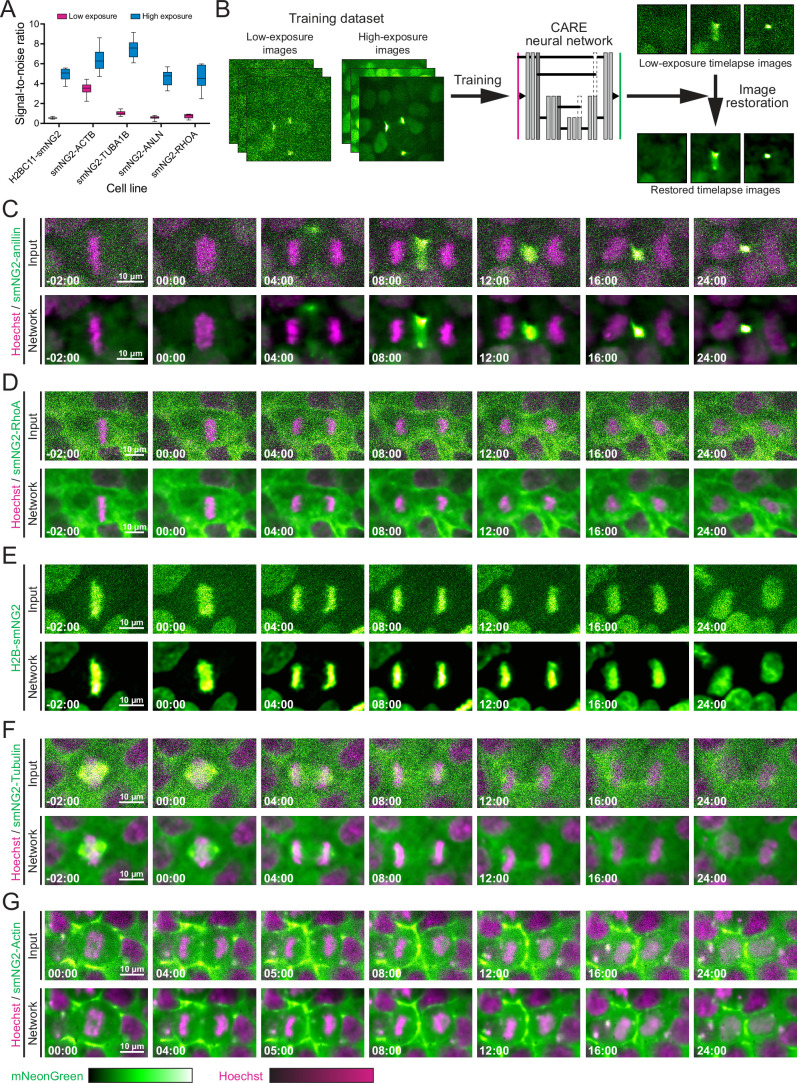
Endogenous tags have become invaluable tools to visualize and study native proteins in live cells. However, generating human cell lines carrying endogenous tags is difficult due to the low efficiency of homology-directed repair. Recently, an engineered split mNeonGreen protein was used to generate a large-scale endogenous tag library in HEK293 cells. Using split mNeonGreen for large-scale endogenous tagging in human iPSCs would open the door to studying protein function in healthy cells and across differentiated cell types. We engineered an iPS cell line to express the large fragment of the split mNeonGreen protein (mNG21-10) and showed that it enables fast and efficient endogenous tagging of proteins with the short fragment (mNG211). We also demonstrate that neural network-based image restoration enables live imaging studies of highly dynamic cellular processes such as cytokinesis in iPSCs. This work represents the first step towards a genome-wide endogenous tag library in human stem cells.

Keywords: cell biology; crispr; cytokinesis; endogenous tagging; gene editing; human; ipsc; live imaging.

Plain language summary

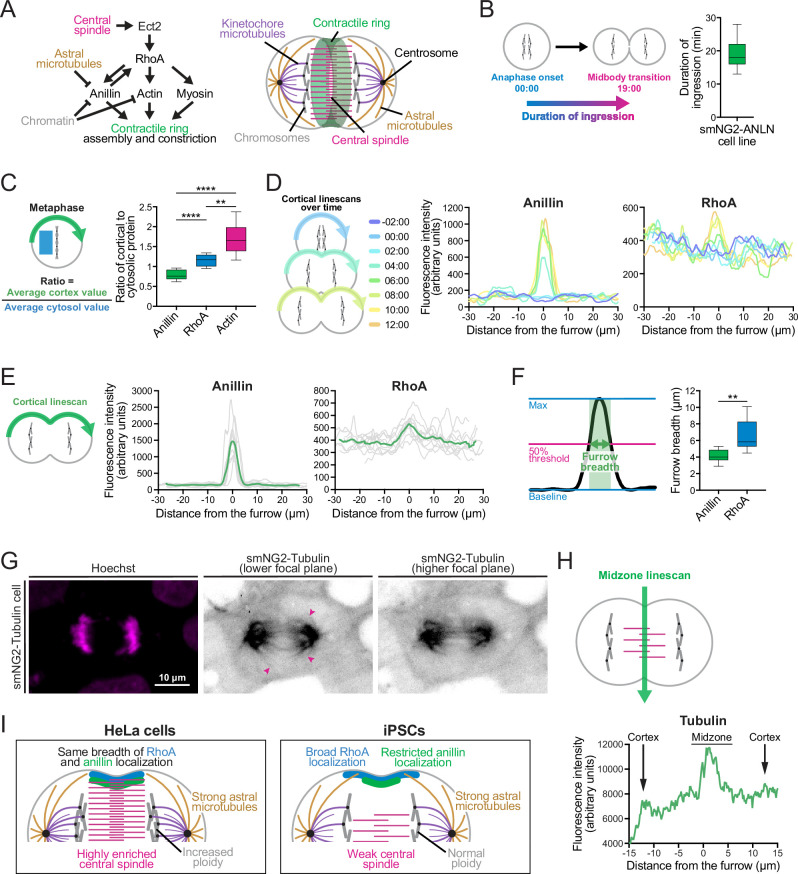
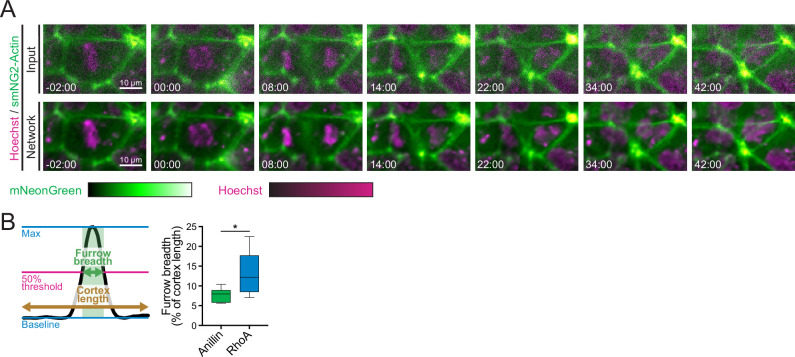
The human body contains around 20,000 different proteins that perform a myriad of essential roles. To understand how these proteins work in healthy individuals and during disease, we need to know their precise locations inside cells and how these locations may change in different situations. Genetic tools known as fluorescent proteins are often used as tags to study the location of specific proteins of interest within cells. When exposed to light, the fluorescent proteins emit specific colours of light that can be observed using microscopes. In a fluorescent protein system known as split mNeonGreen, researchers insert the DNA encoding two fragments of a fluorescent protein (one large, one small) separately into cells. The large fragment can be found throughout the cell, while the small fragment is attached to specific host proteins. When the two fragments meet, they assemble into the full mNeonGreen protein and can fluoresce. Researchers can use split mNeonGreen and other similar systems to generate large libraries of cells where the small fragment of a fluorescent protein is attached to thousands of different host proteins. However, so far these libraries are restricted to a handful of different types of cells. To address this challenge, Husser et al. inserted the DNA encoding the large fragment of mNeonGreen into human cells known as induced pluripotent stem cells, which are able to give rise to any other type of human cell. This then enabled the team to quickly and efficiently generate a library of stem cells that express the small fragment of mNeonGreen attached to different host proteins. Further experiments studied the locations of host proteins in the stem cells just before they divided into two cells. This suggested that there are differences between how induced pluripotent stem cells and other types of cells divide. In the future, the cells and the method developed by Husser et al. may be used by other researchers to create atlases showing where human proteins are located in many other types of cells.


Conflict of interest statement

MH, NP, CL, FA, VM, AP No competing interests declared

Figures

Figure 1.
Figure 1.. Generation of a split mNeonGreen human induced pluripotent stem (iPS) cell line.
(A) A schematic representation of the split tagging strategy used in this study. An expression cassette carrying the mNG21-10 fragment was integrated at the AAVS1 locus in 201B7 iPSCs to generate the parental split mNeonGreen2 cell line (smNG2-P). Proteins of interest were tagged endogenously with the mNG211 fragment to visualize their expression and localization. The structure of mNeonGreen was generated from PDB (Protein Data Bank, structure identifier 5 LTP; Clavel et al., 2016). (B) A schematic of the mNG21-10 expression cassette is shown with the CAG promoter (blue) and sequences for stable expression (dark gray), Puromycin resistance marker (pink), and homology arms (light gray) for integration at the AAVS1 locus. Abbreviations: SA = splicing acceptor, T2A=Thosea asigna virus 2A peptide, bGH = bovine growth hormone poly-adenylation signal, β-glo=rabbit β-globin poly-adenylation signal. (C) Sequencing chromatograms show the edited AAVS1 allele junctions in the smNG2-P cell line (bottom) compared to the WT allele (top). (D) Representative G-banding karyotype of the smNG2-P cell line shows that the edited cells have a normal karyotype (46, XX). (E) Flow cytometry plots show smNG2-P cells stained for pluripotency markers TRA-1–60 (left, green), OCT3/4 (center, yellow), and NANOG (right, red) or a secondary antibody control (blue). (F) Flow cytometry plots show differentiated smNG2-P cells stained for PAX6 (ectoderm; left, green), NCAM (mesoderm; center, yellow), and FOXA2 (endoderm; right, red) compared to undifferentiated cells (blue) and unstained controls (dark colors). (G) Fluorescent and brightfield images show fluorescence complementation after transfecting split mNeonGreen2 parental cell line (smNG2-P) cells with a plasmid expressing H2B fused to mNG211. The scale bar is 10 microns.
Figure 1—figure supplement 1.
Figure 1—figure supplement 1.. Screening of AAVS1-mNG21-10 clones.
(A) A graph shows qPCR amplification curves for the mNG21-10 probe across 32 edited clones (blue), wild-type (WT) cells (green), and a positive control (pink). (B) A graph shows the delta Rn values (increase in fluorescence over the 40 qPCR cycles) to show the presence or absence of the mNG21-10 gene in 32 clones edited clones (blue), WT cells (green), and a positive control (pink). Clones with delta Rn values above the threshold were considered positive for mNG21-10. (C) A graph shows qPCR amplification curves for the AmpR probe in 32 edited clones (blue), WT cells (green), and a positive control (pink). (D) A graph shows the delta Rn values (increase in fluorescence over the 40 qPCR cycles) to show the presence or absence of the AmpR gene in 32 edited clones (blue), WT cells (green), and a positive control (pink). Clones with delta Rn values below the threshold were considered negative for Ampicillin resistance (AmpR). (E) A schematic shows the strategy for junction PCR screening. Three sets of primers were used to amplify the WT AAVS1 allele (top, pink), and the left (bottom left, blue), and right (bottom right, green) integration junctions to verify the mNG21-10 insertion. (F–H) Gel images show the results of the junction PCR screening for WT (F), left junction (G), and right junction (H) with WT cells and six edited clones. The hatched boxes indicate the relevant DNA band. Clone 28 (green) was selected for further validation.
Figure 1—figure supplement 2.
Figure 1—figure supplement 2.. Validation of the split mNeonGreen2 parental cell line (smNG2-P) cell line.
(A) A bar graph shows the copy number of the mNG21-10 (green) and AmpR (pink) genes in clone 28 and wild-type (WT) cells determined by digital PCR. (B–M) Sequence chromatograms for 12 AAVS1 off-target sites in AAVS1-mNG21-10 clone 28 cells are shown below the reference sequence from the human genome. The mismatched sgRNA target and PAM sites are highlighted in red. (N) A brightfield image shows AAVS1-mNG21-10 clone 28 cells growing on an iMatrix-511 Silk-coated plate. (O) A gel image shows the mycoplasma PCR test with cells from several AAVS1-mNG21-10 clones, along with positive and negative controls. Clone 28 is highlighted in green.
Figure 2.
Figure 2.. Efficient endogenous tagging with mNG211 in split mNeonGreen2 parental cell line (smNG2-P) cells.
(A) A schematic shows the workflow used to tag proteins of interest with the mNG211 fragment. smNG2-P cells were transfected with Cas9/sgRNA RNPs and a single-stranded repair template (ssODN) to integrate mNG211 at a target locus. After recovery, the edited populations were frozen and assessed by Nanopore sequencing and flow cytometry. (B) A bar graph shows the distribution of alleles (WT, indels, or mNG211-tagged) in edited populations. The percentage of mNG211 alleles is indicated in white for each gene. (C) Fluorescent and brightfield images show populations of tagged cells after enrichment by FACS as indicated. The scale bar is 50 microns.
Figure 2—figure supplement 1.
Figure 2—figure supplement 1.. Fluorescent signal from endogenous mNG211 tags.
(A) A graph shows the expression levels of protein-coding genes in the 201B7 cell line. Genes targeted for tagging with mNG211 are indicated by triangles (green for tagged proteins that were detected and blue for tagged proteins that were not detected in induced pluripotent stem cells, iPSCs). The RNA-seq data was obtained from Iwasaki et al., 2022; GEO accession number GSE199820. (B–T) Flow cytometry plots show 17 different cell populations with smNG2 fluorescence after being edited with the mNG211 tag. A negative control transfected with pooled single-stranded repair templates (ssODNs) and scrambled sgRNAs (R), and an untransfected control (S) were used to set a gate to identify fluorescent cells (gate shown in green). (U) A bar graph shows the mean fluorescence intensity of fluorescent cells in the gates shown in (B–T). (V) Fluorescent images show the localization of smNG2-tagged E-cadherin (green) and DNA (stained with Hoechst, magenta). The scale bar is 10 microns. (W–X) Fluorescent and brightfield images show the expression of smNG2-tagged FOXA2 in the edited cell population after differentiation into endoderm (U) but not in the undifferentiated cell population (V). The scale bar is 50 microns.
Figure 3.
Figure 3.. Efficient clonal isolation and screening of tagged induced pluripotent stem (iPS) cell lines.
(A) The protocol used for single-cell isolation and recovery of tagged iPSC clones is shown. Tagged cell populations were pre-treated with ROCK inhibitor Y-27632 for 2 hr before sorting individual cells into 96-well plates by FACS. Cells were kept in recovery media for 6 days, then colonies were screened on day 10 to select those for further passaging into 96-well plates on day 11. Fully-grown clones were frozen on day 15, and cells were genotyped by barcoding PCR followed by Nanopore sequencing. (B) A stacked bar graph shows the distribution of genotypes inferred from multiplexed Nanopore sequencing for isolated clones of tagged H2BC11, ACTB, TUBA1B, ANLN, and RHOA (sample size is indicated above each bar). (C–G) The genotypes of the final tagged cell lines are shown: H2BC11-smNG2 (C), smNG2-ACTB (D), smNG2-TUBA1B (E), smNG2-ANLN (F), and smNG2-RHOA (G). The target gene coding sequence is in blue, indel mutations are in red and mNG11 tag in green. (H) Fluorescent images show the localization of smNG2 (green) and DNA (stained with Hoechst; magenta) in the final tagged cell lines. The scale bar is 10 microns.
Figure 3—figure supplement 1.
Figure 3—figure supplement 1.. Clonal isolation and screening of tagged clones.
(A) A bar graph shows the recovery rate of different edited and wild-type (WT) cell populations after single-cell isolation by FACS. (B) The steps used by the macro to process images for colony screening in 96-well plates are shown. (C–G) Representative images of results from colony screening using the macro in B. (H) Mean nuclear fluorescence intensity of a heterozygous (shown in blue, n=120) and homozygous (shown in green, n=112) smNG2-anillin clone measured by fluorescence microscopy. (I) Mean cytoplasmic fluorescence intensity of a heterozygous (shown in blue, n=103) and homozygous (shown in green, n=101) smNG2-RhoA clone measured by fluorescence microscopy. (J) Gel images show the results of the mycoplasma PCR test for the final mNG211-tagged cell lines compared to positive and negative controls. The bar graphs in H and I show the average with standard deviation error bars.
Figure 4.
Figure 4.. Image restoration for live imaging and quantitative measurements in induced pluripotent stem cells ( iPSCs).
(A) A graph shows the signal-to-noise ratio measured from low- (pink) and high-exposure (blue) images of the tagged iPS cell lines as indicated (n≥7 for each condition). (B) A schematic shows the training and application of the Content-Aware image REstoration (CARE) neural network for image restoration. The neural network developed by Weigert et al., 2018 was trained on sets of low- and high-exposure images for each tagged cell line and used to restore timelapse movies. (C–G) Comparisons of raw (Input; top panel) and restored timelapse images (Network; bottom panel) by the CARE neural network are shown for iPSCs expressing smNG2-anillin (C), smNG2-RhoA (D), H2B-smNG2 (E), smNG2-Tubulin (F), and smNG2-actin (G) undergoing cytokinesis (smNG2 in green; DNA stained with Hoechst in magenta). The scale bars are 10 microns, and time is relative to anaphase onset (00:00). The box plot in A shows the median line, quartile box edges and the minimum and maximum value whiskers.
Figure 5.
Figure 5.. Cytokinesis is uniquely regulated in induced pluripotent stem cells (iPSCs).
(A) Schematics show the core pathways regulating contractile ring assembly and ingression (left) and their localization inside a late anaphase cell (right). (B) A schematic (left) shows how the duration of ingression was measured in anillin-tagged iPSCs (right; n=39). (C) A schematic (left) shows how the ratio of cortical to cytosolic protein was measured in metaphase cells for smNG2-anillin, smNG2-RhoA, and smNG2-actin (right; n=10 for each). (D) A schematic (left) shows the location and timing of the linescans used to plot the fluorescence intensity along the cortex in single iPSCs for smNG2-anillin (center) and smNG2-RhoA (right). Timepoints are shown in different colors as indicated in the scale. (E) A schematic (left) shows the location of the linescans used to plot the intensity of fluorescence along the cortex at the onset of furrowing for smNG2-anillin (center) and smNG2-RhoA (right; n=10 for each). (F) A schematic (left) shows how the breadth of protein localization at the equatorial cortex at furrow initiation was calculated for smNG2-anillin and smNG2-RhoA (n=10 for each). (G) Fluorescent images show the location of DNA (left; stained with Hoechst) and smNG2-Tubulin (gray scale) in a cell. For tubulin, a lower focal plane (center) is shown to highlight astral microtubules (indicated by pink arrows), and a higher focal plane (right) is shown to highlight the central spindle. The scale bar is 10 microns. (H) A schematic (top) shows the location of the linescan used to plot the fluorescence intensity along the midzone of a cell expressing smNG2-tubulin in anaphase (bottom). (I) A schematic shows a comparison of the conventional view of cytokinesis (HeLa cell; left) and an iPS cell (iPSCs; right). HeLa cells have a strongly enriched central spindle, which keeps the equatorial of active RhoA narrow, and astral microtubules that extend all the way to the cortex and restrict the localization of anillin to the same zone as RhoA. iPSCs have a weakly enriched central spindle, resulting in a broader zone of active RhoA, and prominent astral microtubules that keep anillin in a narrow equatorial zone. Box plots in B, C, and F show the median line, quartile box edges and the minimum and maximum value whiskers. Statistical significance was determined by Brown-Forsythe and Welch’s ANOVA follow by Dunnett’s T3 test for C and Welch’s t-test for F (ns, not significant; *p≤0.05; **p≤0.01; ***p≤0.001; ****p≤0.0001).
Figure 5—figure supplement 1.
Figure 5—figure supplement 1.. Protein localization in induced pluripotent stem cells (iPSCs) during cytokinesis.
(A) Timelapse images show a cell expressing smNG2-actin during cytokinesis. The input images are shown above the same images after restoration by the Content-Aware image REstoration (CARE) neural network. The mNeonGreen2 (mNG2) signal is shown in green and the DNA is stained with Hoechst (magenta). The scale bar is 10 microns and times are shown relative to anaphase onset (00:00). (B) A schematic (left) shows how the breadth of protein localization at the equatorial cortex relative to cortex length was calculated for smNG2-anillin and smNG2-RhoA (right; n=10 for each). The box plot in B shows the median line, quartile box edges and the minimum and maximum value whiskers. Statistical significance was determined by Welch’s t-test (ns, not significant; *p≤0.05; **p≤0.01; ***p≤0.001; ****p≤0.0001).

Update of

  • doi: 10.1101/2023.06.28.546942
  • doi: 10.7554/eLife.92819.1
  • doi: 10.7554/eLife.92819.2

Similar articles

Cited by

References

    1. Aban CE, Lombardi A, Neiman G, Biani MC, La Greca A, Waisman A, Moro LN, Sevlever G, Miriuka S, Luzzani C. Downregulation of E-cadherin in pluripotent stem cells triggers partial EMT. Scientific Reports. 2021;11:2048. doi: 10.1038/s41598-021-81735-1. - DOI - PMC - PubMed
    1. Adriaans IE, Basant A, Ponsioen B, Glotzer M, Lens SMA. PLK1 plays dual roles in centralspindlin regulation during cytokinesis. The Journal of Cell Biology. 2019;218:1250–1264. doi: 10.1083/jcb.201805036. - DOI - PMC - PubMed
    1. Araujo F. Nanopore Demultiplex with Bowtie. c85a2ccGitHub. 2022 https://github.com/frba/nanopore_demultiplex
    1. Beaudet D, Akhshi T, Phillipp J, Law C, Piekny A. Active ran regulates anillin function during cytokinesis. Molecular Biology of the Cell. 2017;28:3517–3531. doi: 10.1091/mbc.E17-04-0253. - DOI - PMC - PubMed
    1. Bhargava N, Thakur P, Muruganandam TP, Jaitly S, Gupta P, Lohani N, Goswami SG, Saravanakumar V, Bhattacharya SK, Jain S, Ramalingam S. Development of an efficient single-cell cloning and expansion strategy for genome edited induced pluripotent stem cells. Molecular Biology Reports. 2022;49:7887–7898. doi: 10.1007/s11033-022-07621-9. - DOI - PubMed

Publication types

Associated data