. 2024 Jul 1;223(7):e202310143.
doi: 10.1083/jcb.202310143. Epub 2024 Apr 23.

BRG1 programs PRC2-complex repression and controls oligodendrocyte differentiation and remyelination

Affiliations

BRG1 programs PRC2-complex repression and controls oligodendrocyte differentiation and remyelination

Jiajia Wang et al. J Cell Biol. .

Abstract

Chromatin-remodeling protein BRG1/SMARCA4 is pivotal for establishing oligodendrocyte (OL) lineage identity. However, its functions for oligodendrocyte-precursor cell (OPC) differentiation within the postnatal brain and during remyelination remain elusive. Here, we demonstrate that Brg1 loss profoundly impairs OPC differentiation in the brain with a comparatively lesser effect in the spinal cord. Moreover, BRG1 is critical for OPC remyelination after injury. Integrative transcriptomic/genomic profiling reveals that BRG1 exhibits a dual role by promoting OPC differentiation networks while repressing OL-inhibitory cues and proneuronal programs. Furthermore, we find that BRG1 interacts with EED/PRC2 polycomb-repressive-complexes to enhance H3K27me3-mediated repression at gene loci associated with OL-differentiation inhibition and neurogenesis. Notably, BRG1 depletion decreases H3K27me3 deposition, leading to the upregulation of BMP/WNT signaling and proneurogenic genes, which suppresses OL programs. Thus, our findings reveal a hitherto unexplored spatiotemporal-specific role of BRG1 for OPC differentiation in the developing CNS and underscore a new insight into BRG1/PRC2-mediated epigenetic regulation that promotes and safeguards OL lineage commitment and differentiation.


Conflict of interest statement

Disclosures: The authors declare no competing interests exist.

Figures

Figure 1.
Figure 1.
Brg1 deletion in PDGFRα+ OPC causes OL differentiation deficits in the brain. (A) Strategy used to delete Brg1 in postnatal OPCs by tamoxifen (TAM) administration. (B) Immunostaining for BRG1 antibody in the corpus callosum of control and Brg1 iKO-Pdgfra mice at P7. Arrows indicate BRG1+/tdTomato+ cells. Scale bar, 50 μm; n = 4 animals/genotype. (C) Immunostaining for BRG1 and OLIG2 antibody in control and Brg1 iKO-Pdgfra brains. Scale bar, 10 μm; n = 3 animals/genotype. (D) Immunostaining (left) and quantification (right) of CC1+/tdTomato+ cells in the corpus callosum of control and Brg1 iKO-Pdgfra mice at P14. Scale bar, 50 μm; n = 5 animals/genotype. (E) Immunostaining of MBP in the white matter of control and Brg1 iKO-Pdgfra mice at P7. Scale bar, 100 μm; n = 4 animals/genotype. (F and G) Immunostaining (F) and quantification (G) of MBP in the white matter of control and Brg1 iKO-Pdgfra mice at P7 and P14. Scale bar in F, 50 μm. n = 4 animals/genotype at P7, n = 3 animals/genotype at P14. (H) Immunostaining (left) and quantification (right) of Ki67+/PDGFRα+ cells in the corpus callosum of control and Brg1 iKO-Pdgfra mice at P7. Scale bar, 50 μm; n = 4 animals/genotype. (I) Immunostaining (left) and quantification (right) of cleaved-caspase 3+ (CC3+)/OLIG2+ cells in the corpus callosum of control and Brg1 iKO-Pdgfra mice at P7. Scale bar, 50 μm; n = 3 animals/genotype. Data are presented as mean ± SEM; **P < 0.01; ***P < 0.001; two-tailed unpaired Student’s t test (D, E, H, and I), two-way ANOVA with Sidak’s multiple comparisons test (G).
Figure S1.
Figure S1.
Astrocytes and microglia are not affected in the Brg1 iKO-Pdgfra brain. Immunostaining of GFAP and Iba1 in the brain of control and Brg1 iKO-Pdgfra mice at P7 (left). Quantification of Iba1+ cells in the corpus callosum from P7 control and Brg1 iKO-Pdgfra mice (right). Data are presented as mean ± SEM; n = 3 animals/genotype; two-tailed unpaired Student’s t test.
Figure 2.
Figure 2.
Brg1 iKO-Pdgfra mice develop myelinogenesis defects in the brain and spinal cord. (A) Electron microscopy analysis of brain and spinal cord sections from P14 control and Brg1 iKO-Pdgfra mice after TAM injections from P1 to P3. Scale bar, 2 mm; n = 3 animals/genotype. (B) Quantification of myelinated axons as a percentage of total axons from P14 control and Brg1 iKO-Pdgfra brains and spinal cords. n = 3 animals/genotype. (C) Immunostaining (left) and quantification (right) of BRG1+/tdTomato+ cells in the ventral white matter of control and Brg1 iKO-Pdgfra spinal cords at P14. Scale bar, 50 μm; n = 3 animals/genotype. (D) Immunostaining (left) and quantification (right) of CC1+/tdTomato+ cells in the white matter from P14 control and Brg1 iKO-Pdgfra spinal cords. Scale bar, 100 μm; n = 4 animals/genotype. Data are presented as mean ± SEM; **P < 0.01; ***P < 0.001; two-tailed unpaired Student’s t test (B–D).
Figure S2.
Figure S2.
Brg1 deletion in Cnp+ immature OLs causes a developmental delay in OL differentiation. (A) Strategy used to conditional delete Brg1 by Cnp-Cre mice. (B) Representative immunostaining of BRG1 and Cre in the white matter of control (Brg1fl/fl and Brg1 cKO-Cnp spinal cord at P1. Arrow (left), BRG1+ cell; arrow (right), Cre+ cell. Scale bar, 10 μm; n = 3 animals/genotype. (C and D) In situ hybridization for Mbp and Plp1 on spinal cord sections of control and Brg1 cKO-Cnp mice at E14.5 (C) and P1 (D). Scale bar, 100 μm; n = 5 animals/genotype. (E) Quantification of Plp1+ cell number in one section. n = 5 animals/genotype. Data are presented as mean ± SEM; *P < 0.05; **P < 0.01; two-tailed unpaired Student’s t test (E).
Figure 3.
Figure 3.
BRG1 is critical for OPC remyelination after injury. (A) Representative immunostaining of BRG1 at control and lesion sites after LPC injury at P7. Scale bar, 50 μm; n = 4 animals/group. Arrows, BRG1+ cells. (B) Representative immunostaining (left) and quantification (right) of BRG1+PDGFRα+ cells at LPC-lesion sites at dpi 7. Scale bar, 60 μm; n = 6 animals. Arrows, BRG1+ cells. (C) Diagram showing TAM administration and LPC injection schedule. (D) Immunostaining of MBP at lesion sites from control and Brg1 iKO-Pdgfra spinal cords at dpi 14. Scale bar, 50 μm; n = 5 animals/genotype. (E and F) In situ hybridization for Mbp in spinal LPC lesions of control and Brg1 iKO-Pdgfra mice at dpi 14 (E) and dpi 21 (F). Scale bar, 50 μm; n = 4 animals/genotype. (G and H) In situ hybridization for Plp1 in spinal LPC lesions of control and Brg1 iKO-Pdgfra mice at dpi 14 (G) and dpi 21 (H). Scale bar, 50 μm; n = 4 animals/genotype. (I) Quantification of Plp1+ cells per 0.001 mm3 in LPC lesion sites. Data are presented as means ± SEM; n = 4 animals/genotype. (J) Electron microscopy of LPC lesions from control and Brg1 iKO-Pdgfra spinal cords at dpi 14 (left). Quantification of the percentage of remyelinated axons in control and Brg1 iKO-Pdgfra spinal cords at dpi 14 (right). Scale bar, 2 mm; n = 4 animals/genotype. (K) In situ hybridization for Pdgfra in spinal LPC lesions of control and Brg1 iKO-Pdgfra mice at dpi 14 (left). Quantification of Pdgfra+ cells per 0.001 mm3 in LPC lesion sites (right). Scale bar, 50 μm; n = 4 animals/genotype. Data are presented as mean ± SEM; n.s., not significant; *P < 0.05; **P < 0.01; ***P < 0.001; two-way ANOVA with Sidak’s multiple comparisons test (I), two-tailed unpaired Student’s t test (J and K).
Figure 4.
Figure 4.
BRG1 regulates the transcriptional program for OPC differentiation. (A) Immunostaining (left) and quantification (right) for MBP+OLIG2+ mature OLs in control and Brg1 KO OPCs from Brg1 iKO brains stimulated with T3 for 3 days. Scale bar, 50 μm; n = 3 independent experiments. (B) Differentially expressed transcripts (highlighted in color; fold change ≥1.5 [log2(fold change) > 0.585], false discovery rate <0.05) between OPCs isolated from control and Brg1 iKO mouse brains at P7. n = 2 independent experiments. (C) Heatmap shows differentially expressed genes in Brg1 KO OPCs compared with control OPCs. n = 2 independent experiments. (D) GSEA of genes enriched in control or Brg1 KO OPCs; NES, net enrichment score. (E and F) GSEA plots of Brg1 KO OPCs show downregulation of oligodendrocyte markers signature and upregulation of negative regulation of glial cell differentiation signature. (G) The heatmap shows the indicated differentially expressed oligodendrocyte genes in Brg1 KO OPCs compared with control OPCs. n = 2 independent experiments. (H) qPCR analysis of OPC differentiation-associated genes in control and Brg1 KO OPCs. n = 3 independent experiments. Data are presented as mean ± SEM; ***P < 0.001; two-tailed unpaired Student’s t test (A and H).
Figure 5.
Figure 5.
BRG1 binds with and promotes PRC2 activity in OPCs. (A) GSEA plots of H3K27me3, EZH2 targets, and SUZ12 targets enriched in Brg1 KO OPCs. (B) Western blot (left) and quantification (right) of BRG1, EED, EZH2, SUZ12, H3K27me3, and GAPDH from lysates of control and SiBrg1 treated Oli-neu cells. n = 3 independent experiments. (C) PCA plot of expression profiles of Brg1 KO OPCs (red) and Eed KO OPCs (blue). (D) Correlation of significantly changed gene expression in Eed KO OPCs and gene expression changes in Brg1 KO OPCs. Correlation and P values were obtained from Pearson’s product-moment correlation. (E) Coimmunoprecipitation assay for BRG1 and HA antibodies in Oli-neu cells transfected with plasmids expressing HA-tagged EED. n = 3 independent experiments. (F) Co-immunoprecipitation assay for BRG1, EED, and H3K27me3 antibodies in primary mouse OPCs. n = 3 independent experiments. (G) Representative images showed the proximity ligation assay of the BRG1-EED interaction (arrow) in primary mouse OPCs. n = 3 independent experiments. Scale bars, 10 μm. Data are presented as mean ± SEM; ***P < 0.001; two-tailed unpaired Student’s t test (B). Source data are available for this figure: SourceData F5.
Figure 6.
Figure 6.
BRG1 interacts with PRC2 to suppress negative regulators of OPC differentiation. (A) Bland–Altman plot showing genome-wide changes to SUZ12 ChIP-seq peaks in OPCs with significant gene expression change in Brg1 KO OPCs isolated from Brg1 iKO mice. (B) Representative SUZ12 and H3K27me3 ChIP-seq peak tracks of high-binding genes like Lef1 and Bmp6 in OPCs, visualized by the Integrative Genome Viewer (IGV) software. (C) Fold change of Lef1 and Bmp6 genes in RNA-seq of control and Brg1 KO OPCs. (D) GSEA plots of gene signatures with WNT signaling pathway and BMP response enriched in Brg1 KO OPCs. (E) qPCR analysis of WNT signaling pathway genes in control and Brg1 KO OPCs. n = 3 independent experiments. (F) ChIP-qPCR analysis of H3K27me3 enrichment at the promoter region of the Lef1 (left) and Bmp6 (right) genes in control and SiBrg1-treated Oli-neu cells. n = 3 independent experiments; IgG, immunoglobulin G. Data are presented as mean ± SEM; *P < 0.05; **P < 0.01; two-tailed unpaired Student’s t test (C, E, and F).
Figure 7.
Figure 7.
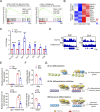
BRG1 cooperates with PRC2 to suppress neuronal gene expression within OPCs. (A) GSEA plots of neuron differentiation-related gene signatures enriched in Brg1 KO OPCs. (B) Heatmaps of Stemness genes and neuronal genes in control and Brg1 KO OPCs. (C) qPCR analysis of neuronal genes and astrocyte genes in control and Brg1 KO OPCs. n = 3 independent experiments. (D) Representative SUZ12 and H3K27me3 ChIP-seq peak tracks of neuronal genes like Sp9 and Zic4 in OPCs, visualized by the IGV software. (E) ChIP-qPCR analysis of H3K27me3 enrichment at the promoter region of the Sp9 and Zic4 genes in control and SiBrg1-treated Oli-neu cells. n = 3 independent experiments; IgG, immunoglobulin G. (F) Luciferase analysis of the promoter region of Mbp or Olig2 in control, Sp9 and Zic4 overexpressed Oli-neu cells. n = 3 experiments. (G) A schematic diagram of BRG1 function during OL differentiation. (I) BRG1 is recruited by the transcription factor OLIG2 to activate the expression of OL differentiation genes. (II) BRG1 interacts and promotes PRC2-mediated repression at OL differentiation inhibitory genes. (III) BRG1 interacts and promotes PRC2-mediated repression at non-OL neuronal genes. Data are presented as mean ± SEM; *P < 0.05; **P < 0.01; ***P < 0.001; two-tailed unpaired Student’s t test (C, E, and F).

References

    1. Alexander, J.M., Hota S.K., He D., Thomas S., Ho L., Pennacchio L.A., and Bruneau B.G.. 2015. Brg1 modulates enhancer activation in mesoderm lineage commitment. Development. 142:1418–1430. 10.1242/dev.109496 - DOI - PMC - PubMed
    1. Azim, K., and Butt A.M.. 2011. GSK3β negatively regulates oligodendrocyte differentiation and myelination in vivo. Glia. 59:540–553. 10.1002/glia.21122 - DOI - PubMed
    1. Bercury, K.K., and Macklin W.B.. 2015. Dynamics and mechanisms of CNS myelination. Dev. Cell. 32:447–458. 10.1016/j.devcel.2015.01.016 - DOI - PMC - PubMed
    1. Bergles, D.E., and Richardson W.D.. 2015. Oligodendrocyte development and plasticity. Cold Spring Harb. Perspect. Biol. 8:a020453. 10.1101/cshperspect.a020453 - DOI - PMC - PubMed
    1. Berry, K., Wang J., and Lu Q.R.. 2020. Epigenetic regulation of oligodendrocyte myelination in developmental disorders and neurodegenerative diseases. F1000 Res. 9:F1000 Faculty Rev-105. 10.12688/f1000research.20904.1 - DOI - PMC - PubMed

Publication types

MeSH terms