

Effects of Chemicals in Reporter Gene Bioassays with Different Metabolic Activities Compared to Baseline Toxicity
- PMID: 38652132
- PMCID: PMC11110108
- DOI: 10.1021/acs.chemrestox.4c00017
Effects of Chemicals in Reporter Gene Bioassays with Different Metabolic Activities Compared to Baseline Toxicity
Abstract
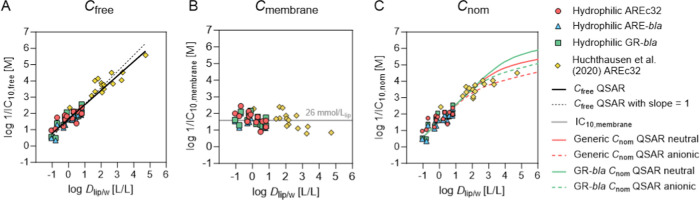
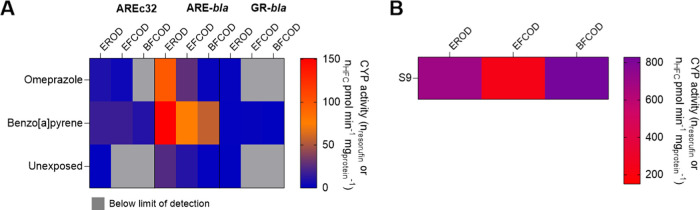
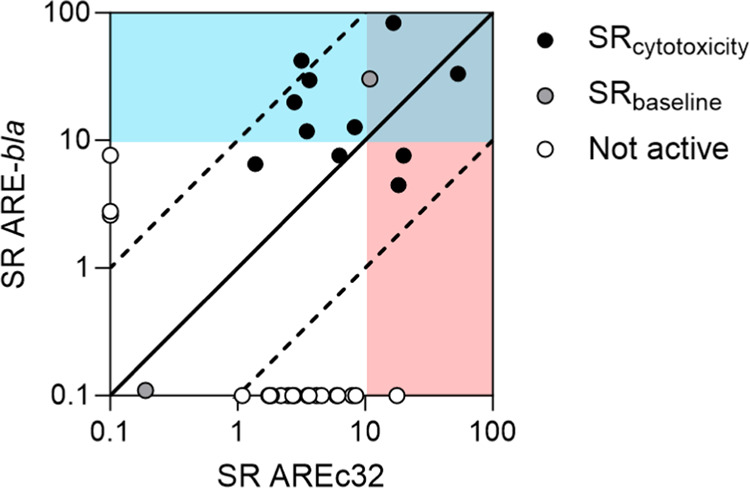
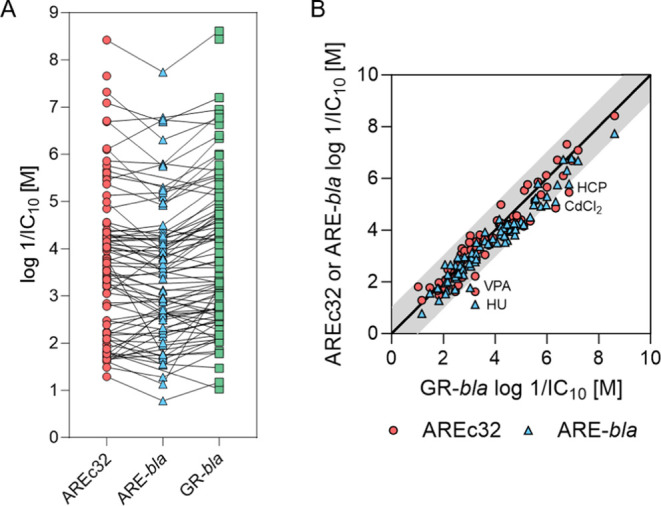
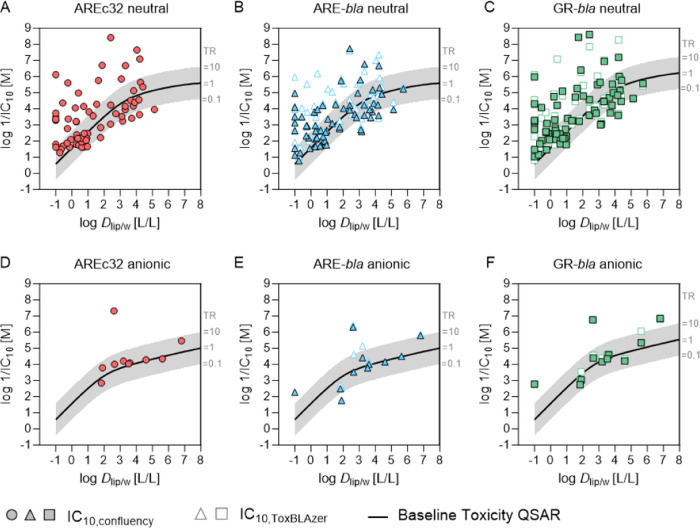
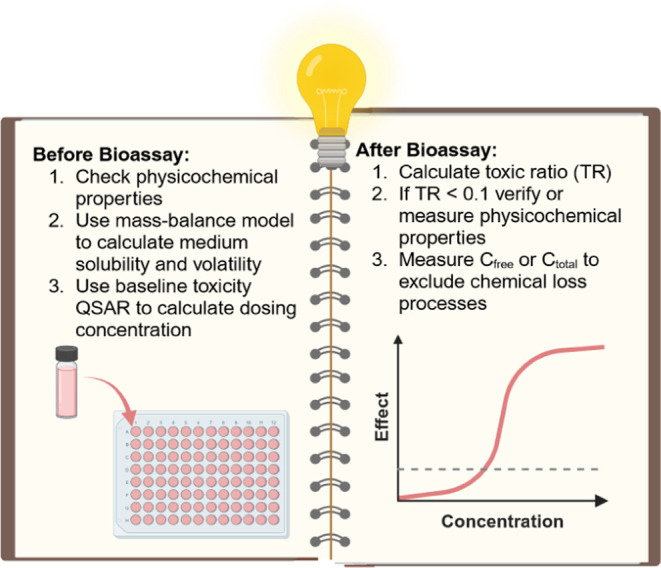
High-throughput cell-based bioassays are used for chemical screening and risk assessment. Chemical transformation processes caused by abiotic degradation or metabolization can reduce the chemical concentration or, in some cases, lead to the formation of more toxic transformation products. Unaccounted loss processes may falsify the bioassay results. Capturing the formation and effects of transformation products is important for relating the in vitro effects to in vivo. Reporter gene cell lines are believed to have low metabolic activity, but inducibility of cytochrome P450 (CYP) enzymes has been reported. Baseline toxicity is the minimal toxicity a chemical can have and is caused by the incorporation of the chemical into cell membranes. In the present study, we improved an existing baseline toxicity model based on a newly defined critical membrane burden derived from freely dissolved effect concentrations, which are directly related to the membrane concentration. Experimental effect concentrations of 94 chemicals in three bioassays (AREc32, ARE-bla and GR-bla) were compared with baseline toxicity by calculating the toxic ratio (TR). CYP activities of all cell lines were determined by using fluorescence-based assays. Only ARE-bla showed a low basal CYP activity and inducibility and AREc32 showed a low inducibility. Overall cytotoxicity was similar in all three assays despite the different metabolic activities indicating that chemical metabolism is not relevant for the cytotoxicity of the tested chemicals in these assays. Up to 28 chemicals showed specific cytotoxicity with TR > 10 in the bioassays, but baseline toxicity could explain the effects of the majority of the remaining chemicals. Seven chemicals showed TR < 0.1 indicating inaccurate physicochemical properties or experimental artifacts like chemical precipitation, volatilization, degradation, or other loss processes during the in vitro bioassay. The new baseline model can be used not only to identify specific cytotoxicity mechanisms but also to identify potential problems in the experimental performance or evaluation of the bioassay and thus improve the quality of the bioassay data.
Conflict of interest statement
The authors declare no competing financial interest.
Figures
Similar articles
-
Baseline Toxicity and Volatility Cutoff in Reporter Gene Assays Used for High-Throughput Screening.Chem Res Toxicol. 2019 Aug 19;32(8):1646-1655. doi: 10.1021/acs.chemrestox.9b00182. Epub 2019 Aug 2. Chem Res Toxicol. 2019. PMID: 31313575
-
In Vitro Metabolism and p53 Activation of Genotoxic Chemicals: Abiotic CYP Enzyme vs Liver Microsomes.Chem Res Toxicol. 2024 Aug 19;37(8):1364-1373. doi: 10.1021/acs.chemrestox.4c00101. Epub 2024 Jun 20. Chem Res Toxicol. 2024. PMID: 38900731 Free PMC article.
-
Critical Membrane Concentration and Mass-Balance Model to Identify Baseline Cytotoxicity of Hydrophobic and Ionizable Organic Chemicals in Mammalian Cell Lines.Chem Res Toxicol. 2021 Sep 20;34(9):2100-2109. doi: 10.1021/acs.chemrestox.1c00182. Epub 2021 Aug 6. Chem Res Toxicol. 2021. PMID: 34357765
-
Safety and nutritional assessment of GM plants and derived food and feed: the role of animal feeding trials.Food Chem Toxicol. 2008 Mar;46 Suppl 1:S2-70. doi: 10.1016/j.fct.2008.02.008. Epub 2008 Feb 13. Food Chem Toxicol. 2008. PMID: 18328408 Review.
-
Fish cell lines as versatile tools in ecotoxicology: assessment of cytotoxicity, cytochrome P4501A induction potential and estrogenic activity of chemicals and environmental samples.Toxicol In Vitro. 2001 Aug-Oct;15(4-5):477-88. doi: 10.1016/s0887-2333(01)00053-4. Toxicol In Vitro. 2001. PMID: 11566581 Review.
Cited by
-
Assessing Modes of Toxic Action of Organic Cations in In Vitro Cell-Based Bioassays: the Critical Role of Partitioning to Cells and Medium Components.Chem Res Toxicol. 2025 Mar 17;38(3):488-502. doi: 10.1021/acs.chemrestox.4c00527. Epub 2025 Mar 4. Chem Res Toxicol. 2025. PMID: 40036051 Free PMC article.
-
Impact of Biotransformation on Internal Concentrations and Specificity Classification of Organic Chemicals in the Zebrafish Embryo (Danio rerio).Environ Sci Technol. 2024 Oct 8;58(40):17898-17907. doi: 10.1021/acs.est.4c04156. Epub 2024 Sep 24. Environ Sci Technol. 2024. PMID: 39315645 Free PMC article.
References
-
- Isaacs K. K.; Egeghy P.; Dionisio K. L.; Phillips K. A.; Zidek A.; Ring C.; Sobus J. R.; Ulrich E. M.; Wetmore B. A.; Williams A. J.; Wambaugh J. F. The chemical landscape of high-throughput new approach methodologies for exposure. J. Exposure Sci. Environ. Epidemiol. 2022, 32 (6), 820–832. 10.1038/s41370-022-00496-9. - DOI - PMC - PubMed
-
- Schmeisser S.; Miccoli A.; von Bergen M.; Berggren E.; Braeuning A.; Busch W.; Desaintes C.; Gourmelon A.; Grafström R.; Harrill J.; Hartung T.; Herzler M.; Kass G. E. N.; Kleinstreuer N.; Leist M.; Luijten M.; Marx-Stoelting P.; Poetz O.; van Ravenzwaay B.; Roggeband R.; Rogiers V.; Roth A.; Sanders P.; Thomas R. S.; Marie Vinggaard A.; Vinken M.; van de Water B.; Luch A.; Tralau T. New approach methodologies in human regulatory toxicology - Not if, but how and when!. Environ. Int. 2023, 178, 10808210.1016/j.envint.2023.108082. - DOI - PMC - PubMed
-
- van der Zalm A. J.; Barroso J.; Browne P.; Casey W.; Gordon J.; Henry T. R.; Kleinstreuer N. C.; Lowit A. B.; Perron M.; Clippinger A. J. A framework for establishing scientific confidence in new approach methodologies. Arch. Toxicol. 2022, 96 (11), 2865–2879. 10.1007/s00204-022-03365-4. - DOI - PMC - PubMed
Publication types
MeSH terms
LinkOut - more resources
Full Text Sources
