. 2024 Apr;28(8):e18333.
doi: 10.1111/jcmm.18333.

Bortezomib suppresses acute myelogenous leukaemia stem-like KG-1a cells via NF-κB inhibition and the induction of oxidative stress

Affiliations

Bortezomib suppresses acute myelogenous leukaemia stem-like KG-1a cells via NF-κB inhibition and the induction of oxidative stress

Rafaela G A Costa et al. J Cell Mol Med. 2024 Apr.

Abstract

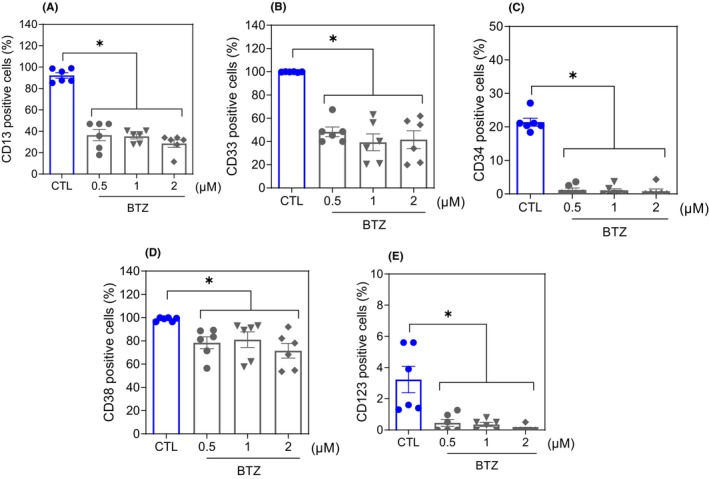
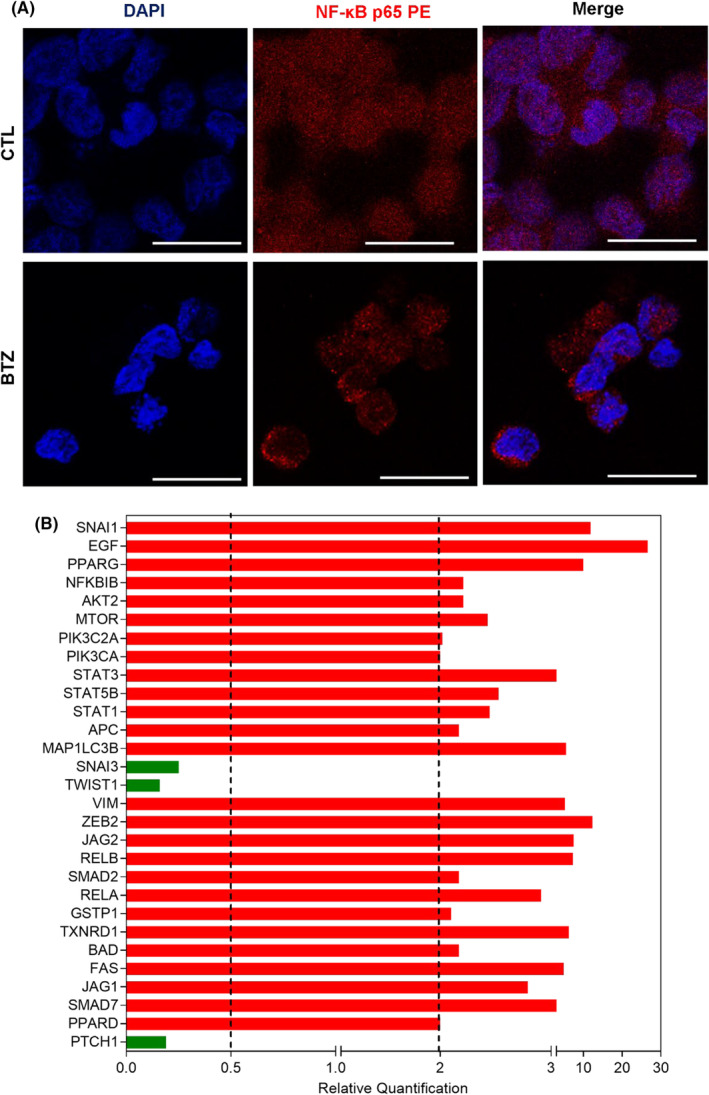
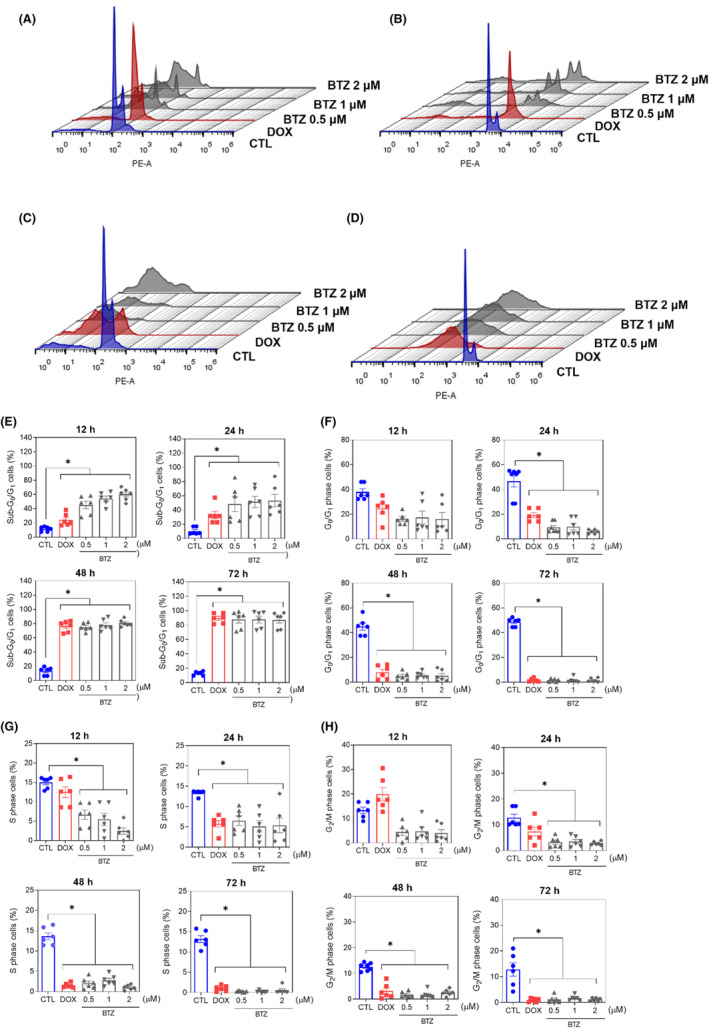
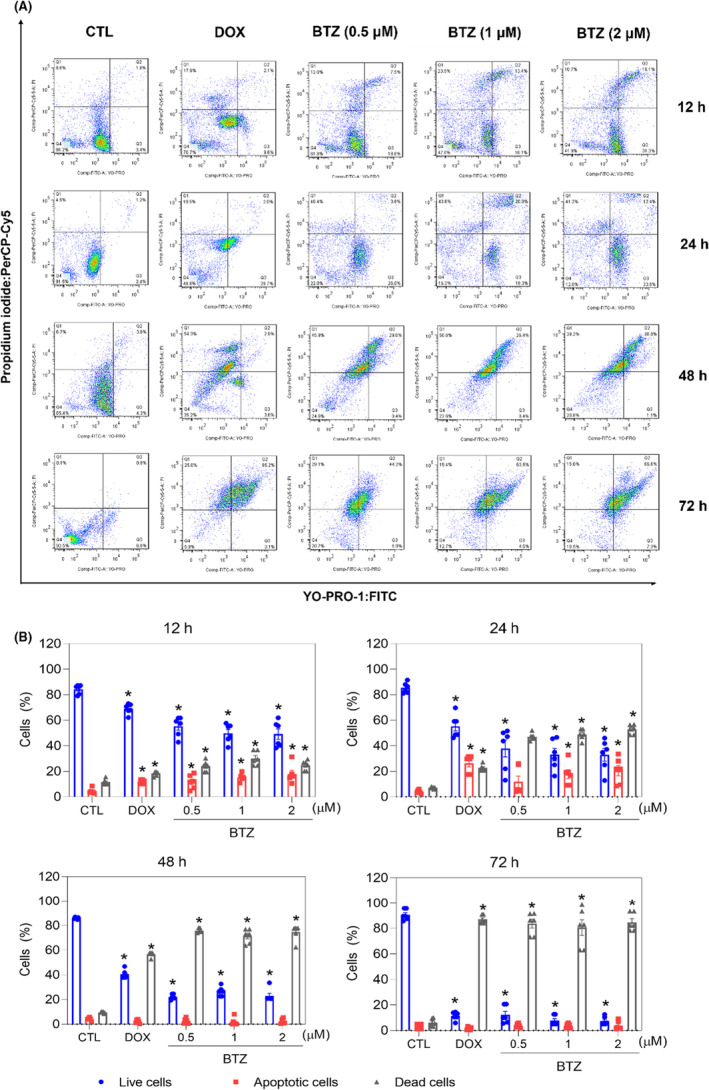
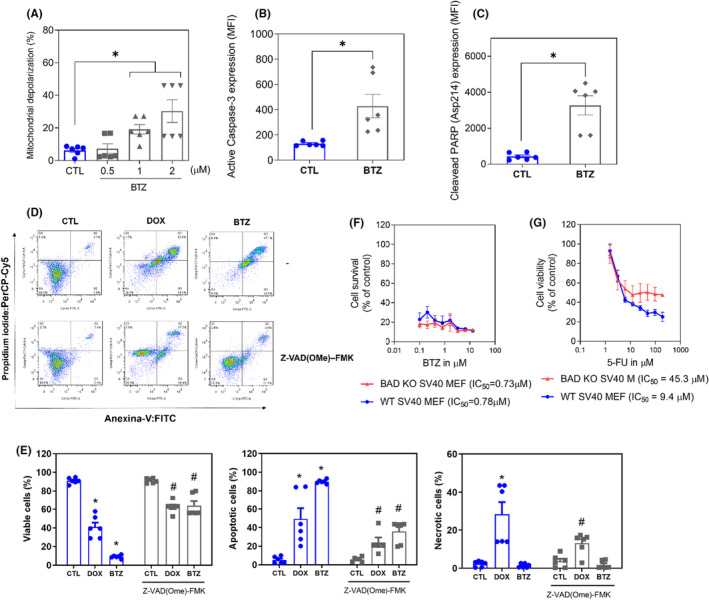
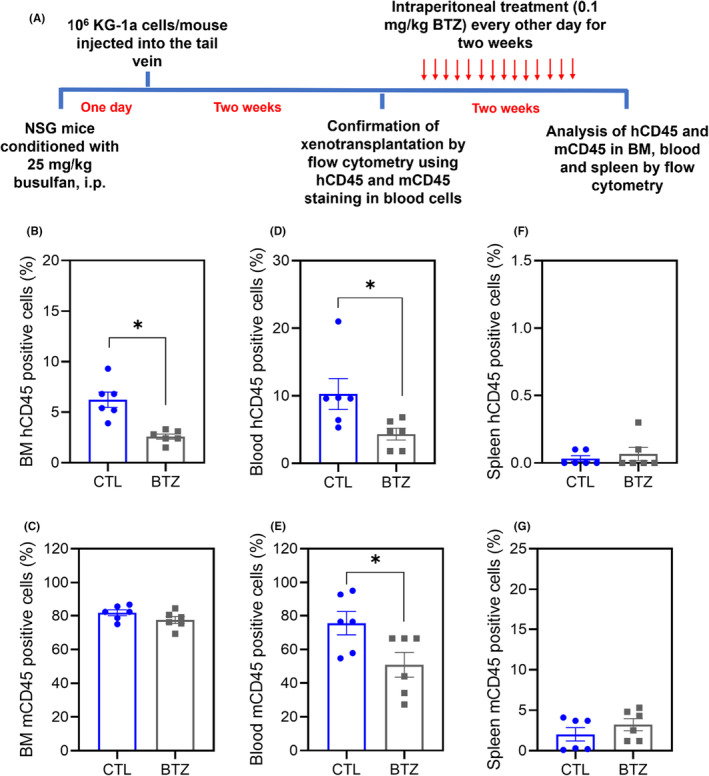
Acute myelogenous leukaemia (AML) originates and is maintained by leukaemic stem cells (LSCs) that are inherently resistant to antiproliferative therapies, indicating that a critical strategy for overcoming chemoresistance in AML therapy is to eradicate LSCs. In this work, we investigated the anti-AML activity of bortezomib (BTZ), emphasizing its anti-LSC potential, using KG-1a cells, an AML cell line with stem-like properties. BTZ presented potent cytotoxicity to both solid and haematological malignancy cells and reduced the stem-like features of KG-1a cells, as observed by the reduction in CD34- and CD123-positive cells. A reduction in NF-κB p65 nuclear staining was observed in BTZ-treated KG-1a cells, in addition to upregulation of the NF-κB inhibitor gene NFΚBIB. BTZ-induced DNA fragmentation, nuclear condensation, cell shrinkage and loss of transmembrane mitochondrial potential along with an increase in active caspase-3 and cleaved PARP-(Asp 214) level in KG-1a cells. Furthermore, BTZ-induced cell death was partially prevented by pretreatment with the pancaspase inhibitor Z-VAD-(OMe)-FMK, indicating that BTZ induces caspase-mediated apoptosis. BTZ also increased mitochondrial superoxide levels in KG-1a cells, and BTZ-induced apoptosis was partially prevented by pretreatment with the antioxidant N-acetylcysteine, indicating that BTZ induces oxidative stress-mediated apoptosis in KG-1a cells. At a dosage of 0.1 mg/kg every other day for 2 weeks, BTZ significantly reduced the percentage of hCD45-positive cells in the bone marrow and peripheral blood of NSG mice engrafted with KG-1a cells with tolerable toxicity. Taken together, these data indicate that the anti-LSC potential of BTZ appears to be an important strategy for AML treatment.

Keywords: AML; NF‐κB; bortezomib; leukaemic stem cells; oxidative stress.


Conflict of interest statement

The authors have no conflicts of interest.

Figures

FIGURE 1
FIGURE 1
BTZ induces potent and selective cytotoxicity to both solid and haematological malignant cells. (A) Chemical structure of BTZ. (B) IC50 values showing the cytotoxicity of BTZ against haematological (red bars) and solid cancers (blue bars), as well as against noncancerous cells (green bars). (C) Heatmap of selectivity indices (SI) calculated for BTZ. The SI was calculated using the following formula: SI = IC50 [noncancerous cells]/IC50 [cancer cells].
FIGURE 2
FIGURE 2
BTZ suppresses the stem‐like features of KG‐1a cells. Immunophenotypic analysis of the myeloid lineage markers CD13 (A) and CD33 (B) and the AML stem/progenitor markers CD34 (C), CD38 (D) and CD123 (E) in BTZ‐treated KG‐1a cells after 48 h of incubation. The vehicle (0.2% DMSO) was used as a negative control (CTL). The data are shown as the mean ± S.E.M. of three independent experiments carried out in duplicate. *p < 0.05 compared to CTL by one‐way ANOVA followed by Dunnett's multiple comparisons test.
FIGURE 3
FIGURE 3
BTZ reduces NF‐κB signalling and downregulates genes related to stemness properties in KG‐1a cells. (A) Representative immunofluorescence images of NF‐κB p65 in KG‐1a cells after 4 h of incubation with 2 μM BTZ. Scale bar = 25 μm. (B) Up‐ and down‐regulated genes in KG‐1a cells after 12 h of treatment with 2 μM BTZ. Genes that displayed RQ ≥2 (red bars) were upregulated, and RQ ≤0.5 (green bars) were downregulated.
FIGURE 4
FIGURE 4
BTZ affects cell cycle progression in KG‐1a cells. Representative histograms after (A) 12, (B) 24, (C) 48 and (D) 72 h of treatment. Percentages of cells in (E) sub‐G0/G1, (F) G0/G1, (G) S and (H) G2/M after different incubation periods with BTZ. Vehicle (0.2% DMSO) was used as a negative control (CTL), and doxorubicin (DOX, 1 μM) was used as a positive control. The data are shown as the mean ± S.E.M. of three independent experiments carried out in duplicate. *p < 0.05 compared with CTL by one‐way ANOVA followed by Dunnett's multiple comparisons test.
FIGURE 5
FIGURE 5
BTZ induces apoptotic cell death in KG‐1a cells. (A) Representative flow cytometry dot plots. (B) Apoptosis quantification in KG‐1a cells after 12, 24, 48 and 72 h of treatment with BTZ. Quantification of live (YO‐PRO‐1‐ and PI‐negative cells), apoptotic (YO‐PRO‐1‐positive cells) and dead (YO‐PRO‐1/PI double‐positive cells plus PI‐positive cells) KG‐1a cells. Vehicle (0.2% DMSO) was used as a negative control (CTL), and doxorubicin (DOX, 1 μM) was used as a positive control. The data are shown as the mean ± S.E.M. of three independent experiments carried out in duplicate. *p < 0.05 compared with CTL by one‐way ANOVA followed by Dunnett's multiple comparisons test.
FIGURE 6
FIGURE 6
BTZ induces caspase‐mediated apoptotic cell death in KG‐1a cells. (A) Effect of BTZ on mitochondrial activity in KG‐1a cells. (B) Effect of BTZ on the levels of active caspase 3 and (C) cleaved PARP (Asp214) after 24 h of treatment in KG‐1a cells. (D and E) Effect of the pancaspase inhibitor Z‐VAD(OMe)‐FMK on BTZ‐induced apoptosis in KG‐1a cells. The cells were pretreated for 2 h with 50 μM Z‐VAD(OMe)‐FMK and then incubated with 2 μM BTZ for 48 h. (F and G) Survival curves of WT SV40 MEFs and BAD KO SV40 MEFs upon treatment with 5‐fluorouracil (5‐FU, used as a positive control) and BTZ. The curves were obtained from at least three independent experiments carried out in duplicate using the Alamar blue assay after 72 h of incubation. Vehicle (0.2% DMSO) was used as a negative control (CTL), and doxorubicin (DOX, 1 μM) was used as a positive control. The data are shown as the mean ± S.E.M. of three independent experiments carried out in duplicate. *p < 0.05 compared with CTL by Student's t‐test or one‐way ANOVA followed by Dunnett's multiple comparisons test. #p < 0.05 compared with the respective treatment without inhibitor by Student's t‐test. MFI, mean fluorescence intensity.
FIGURE 7
FIGURE 7
BTZ causes oxidative stress‐mediated apoptotic cell death in KG‐1a cells. Mitochondrial ROS in KG‐1a cells after 1 (A) and 24 (B) h of treatment with BTZ. (C and D) Effect of the antioxidant NAC on the apoptosis induced by BTZ in KG‐1a cells. The cells were pretreated for 2 h with 5 mM NAC and then incubated with BTZ at 2 μM for 48 h. Vehicle (0.2% DMSO) was used as a negative control (CTL), and hydrogen peroxide (H2O2, 100 μM) was used as a positive control. The data are shown as the mean ± S.E.M. of three independent experiments carried out in duplicate. *p < 0.05 compared with CTL by Student's t‐test or one‐way ANOVA followed by Dunnett's multiple comparisons test. #p < 0.05 compared with the respective treatment without inhibitor by Student's t‐test. MFI, mean fluorescence intensity.
FIGURE 8
FIGURE 8
BTZ reduces the growth of KG‐1a cell xenografts in NSG mice. (A) Experimental design. Two weeks after the inoculation of KG‐1a cells, the mice were randomly divided into the BTZ (0.1 mg/kg) group and the control group (5% DMSO). hCD45‐positive cells were quantified by flow cytometry from (B) bone marrow (BM), (D) peripheral blood and (F) spleen. mCD45‐positive cells were quantified by flow cytometry from (C) BM, (E) peripheral blood and (G) spleen. The data are shown as the mean ± S.E.M. of 6 animals. *p < 0.05 compared with CTL by Student's t‐test.

Similar articles

Cited by

References

    1. Kantarjian H, Kadia T, DiNardo C, et al. Acute myeloid leukemia: current progress and future directions. Blood Cancer J. 2021;11(2):41. doi:10.1038/s41408-021-00425-3 - DOI - PMC - PubMed
    1. Döhner H, Wei AH, Appelbaum FR, et al. Diagnosis and management of AML in adults: 2022 recommendations from an international expert panel on behalf of the ELN. Blood. 2022;140(12):1345‐1377. doi:10.1182/blood.2022016867 - DOI - PubMed
    1. DiNardo CD, Erba HP, Freeman SD, Wei AH. Acute myeloid leukaemia. Lancet. 2023;401(10393):2073‐2086. doi:10.1016/S0140-6736(23)00108-3 - DOI - PubMed
    1. Kayser S, Levis MJ. The clinical impact of the molecular landscape of acute myeloid leukemia. Haematologica. 2023;108(2):308‐320. doi:10.3324/haematol.2022.280801 - DOI - PMC - PubMed
    1. Sasaki K, Ravandi F, Kadia TM, et al. De novo acute myeloid leukemia: a population‐based study of outcome in the United States based on the surveillance, epidemiology, and end results (SEER) database, 1980 to 2017. Cancer. 2021;127(12):2049‐2061. doi:10.1002/cncr.33458 - DOI - PMC - PubMed

Publication types