Diagnostic accuracy of artificial intelligence assisted clinical imaging in the detection of oral potentially malignant disorders and oral cancer: a systematic review and meta-analysis
- PMID: 38652301
- PMCID: PMC11325952
- DOI: 10.1097/JS9.0000000000001469
Diagnostic accuracy of artificial intelligence assisted clinical imaging in the detection of oral potentially malignant disorders and oral cancer: a systematic review and meta-analysis
Abstract
Background: The objective of this study is to examine the application of artificial intelligence (AI) algorithms in detecting oral potentially malignant disorders (OPMD) and oral cancerous lesions, and to evaluate the accuracy variations among different imaging tools employed in these diagnostic processes.
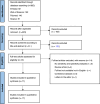
Materials and methods: A systematic search was conducted in four databases: Embase, Web of Science, PubMed, and Scopus. The inclusion criteria included studies using machine learning algorithms to provide diagnostic information on specific oral lesions, prospective or retrospective design, and inclusion of OPMD. Sensitivity and specificity analyses were also required. Forest plots were generated to display overall diagnostic odds ratio (DOR), sensitivity, specificity, negative predictive values, and summary receiver operating characteristic (SROC) curves. Meta-regression analysis was conducted to examine potential differences among different imaging tools.
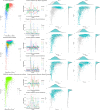
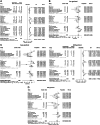
Results: The overall DOR for AI-based screening of OPMD and oral mucosal cancerous lesions from normal mucosa was 68.438 (95% CI= [39.484-118.623], I2 =86%). The area under the SROC curve was 0.938, indicating excellent diagnostic performance. AI-assisted screening showed a sensitivity of 89.9% (95% CI= [0.866-0.925]; I2 =81%), specificity of 89.2% (95% CI= [0.851-0.922], I2 =79%), and a high negative predictive value of 89.5% (95% CI= [0.851-0.927], I2 =96%). Meta-regression analysis revealed no significant difference among the three image tools. After generating a GOSH plot, the DOR was calculated to be 49.30, and the area under the SROC curve was 0.877. Additionally, sensitivity, specificity, and negative predictive value were 90.5% (95% CI [0.873-0.929], I2 =4%), 87.0% (95% CI [0.813-0.912], I2 =49%) and 90.1% (95% CI [0.860-0.931], I2 =57%), respectively. Subgroup analysis showed that clinical photography had the highest diagnostic accuracy.
Conclusions: AI-based detection using clinical photography shows a high DOR and is easily accessible in the current era with billions of phone subscribers globally. This indicates that there is significant potential for AI to enhance the diagnostic capabilities of general practitioners to the level of specialists by utilizing clinical photographs, without the need for expensive specialized imaging equipment.
Copyright © 2024 The Author(s). Published by Wolters Kluwer Health, Inc.
Conflict of interest statement
JWKH is a co-founder, shareholder and director of Vitome Limited. This company plays no role in the study and the decision to publish this manuscript.
Figures


References
-
- Organization WH. Global oral health status report: towards universal health coverage for oral health by 2030. 2022.
-
- Surveillance E, and End Results Program, National Cancer Institute. Cancer Stat Facts: Oral Cavity and Pharynx Cancer.
-
- Warnakulasuriya S, Kujan O, Aguirre-Urizar JM, et al. . Oral potentially malignant disorders: a consensus report from an international seminar on nomenclature and classification, convened by the WHO Collaborating Centre for Oral Cancer. Oral Dis 2021;27:1862–1880. - PubMed
-
- Mehanna HM, Rattay T, Smith J, et al. . Treatment and follow-up of oral dysplasia - a systematic review and meta-analysis. Head Neck 2009;31:1600–1609. - PubMed
Publication types
MeSH terms
LinkOut - more resources
Full Text Sources
Medical

