. 2024 Apr 23;134(11):e166085.
doi: 10.1172/JCI166085.

Human NLRC4 expression promotes cancer survival and associates with type I interferon signaling and immune infiltration

Affiliations

Human NLRC4 expression promotes cancer survival and associates with type I interferon signaling and immune infiltration

Charlotte Domblides et al. J Clin Invest. .

Abstract

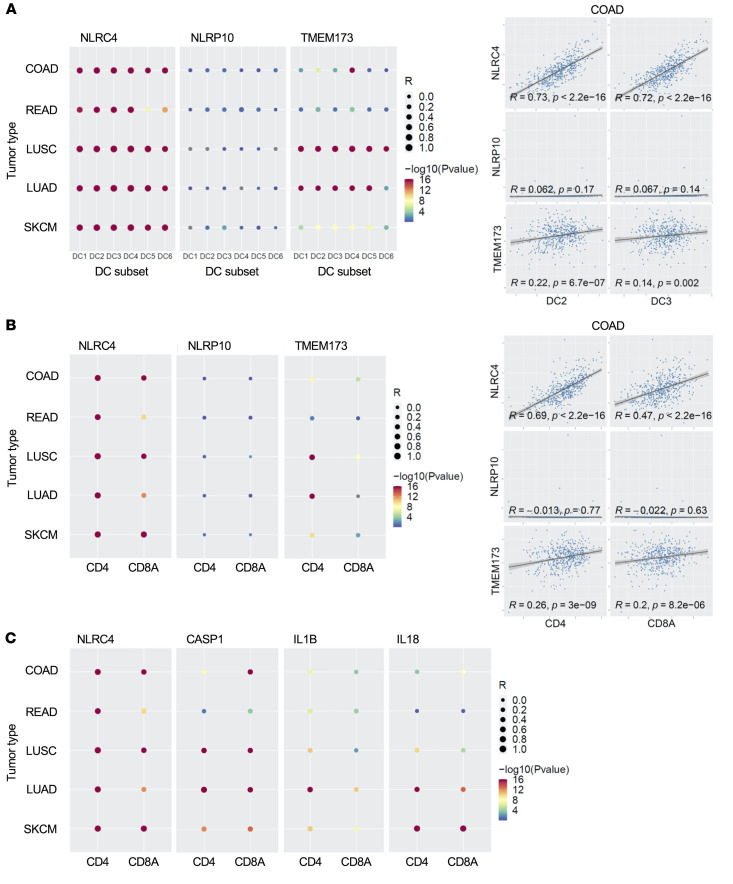
The immune system can control cancer progression. However, even though some innate immune sensors of cellular stress are expressed intrinsically in epithelial cells, their potential role in cancer aggressiveness and subsequent overall survival in humans is mainly unknown. Here, we show that nucleotide-binding oligomerization domain-like receptor (NLR) family CARD domain-containing 4 (NLRC4) is downregulated in epithelial tumor cells of patients with colorectal cancer (CRC) by using spatial tissue imaging. Strikingly, only the loss of tumor NLRC4, but not stromal NLRC4, was associated with poor immune infiltration (mainly DCs and CD4+ and CD8+ T cells) and accurately predicted progression to metastatic stage IV and decrease in overall survival. By combining multiomics approaches, we show that restoring NLRC4 expression in human CRC cells triggered a broad inflammasome-independent immune reprogramming consisting of type I interferon (IFN) signaling genes and the release of chemokines and myeloid growth factors involved in the tumor infiltration and activation of DCs and T cells. Consistently, such reprogramming in cancer cells was sufficient to directly induce maturation of human DCs toward a Th1 antitumor immune response through IL-12 production in vitro. In multiple human carcinomas (colorectal, lung, and skin), we confirmed that NLRC4 expression in patient tumors was strongly associated with type I IFN genes, immune infiltrates, and high microsatellite instability. Thus, we shed light on the epithelial innate immune sensor NLRC4 as a therapeutic target to promote an efficient antitumor immune response against the aggressiveness of various carcinomas.

Keywords: Cancer immunotherapy; Cellular immune response; Immunology; Innate immunity; Oncology.


Figures

Figure 1
Figure 1. Loss of tumor epithelial NLRC4 is associated with aggressive metastatic stage IV, and decreased overall survival of CRC patients.
(A) Left: Association between protein expression levels of tumor epithelial NLRC4, IL-18, or IL-1β and patient overall survival in the Bergonié Cancer Institute cohort. When available, patients were stratified based on protein expression levels of NLRC4, IL-1β, or IL-18, as high versus low expression in the colon epithelium (inside the cytokeratin mask) or in the stroma (outside the cytokeratin mask). NC, could not be calculated. A log-rank test stratified according to protein expression was used. Asterisks indicate P values between high versus low expression of markers either inside or outside the mask. Right: Protein expression of tumor epithelial NLRC4, IL-18, or IL-1β, in various CRC tumor stages, classified as stage I–II (localized), III (locally advanced), or IV (metastatic disease) (from the Bergonié cohort). COAD, colon adenocarcinoma; READ, rectum adenocarcinoma; CHOL, cholangiocarcinoma; LUAD, lung adenocarcinoma; LUSC, lung squamous cell carcinoma. *P < 0.05; **P < 0.01; ***P < 0.001; ****P < 0.0001 by 1-way ANOVA (parametric) or Kruskal-Wallis (nonparametric) test. (B) Top left: Representative image of polyps of a 6-month-old ApcMin/+ mouse in the small intestine (SI) according to their position (P, proximal; M, middle; or D, distal) and in the colon. Top right: H&E staining of healthy SI and polyp-containing section of a 6-month-old ApcMin/+ mouse. Original magnification, ×4. Bottom: Quantification of the number of polyps in the SI (n = 17) and the colon of ApcMin/+ mice (n = 17), and the size distribution of polyps from 6-month-old ApcMin/+ mice in the SI and colon. (C) Representative immunofluorescence images of SI tissue sections at 3 or 6 months of ApcMin/+ mice stained with anti-NLRC4 antibody (red). Anti-cytokeratin (green) and Hoechst (blue) were used to stain epithelial cells and nuclear morphology, respectively. Boxes indicate regions (150 × 150 μm) used to quantify NLRC4 staining in tumor (T) portion of the tissue. Graph shows NLRC4 expression level (MFI) in tumor region of SI at 3 or 6 months in ApcMin/+ mice. Data are mean ± SEM of 21–27 distinct normal/tumor regions, 3 regions per mouse, 7–9 mice per time point. ****P < 0.0001 by 2-tailed Student’s t test.
Figure 2
Figure 2. Loss of tumor epithelial NLRC4 protein is associated with low tumor immune infiltration of CD3+ T cells and activated DCs.
(A) Protein expression of tumor epithelial NLRC4 in various clinically defined levels of tumor total immune, total T cell, cytotoxic T cell, CD68+ macrophage, or CD163+ macrophage infiltration; as determined by immunohistochemistry as low, medium, and high levels of infiltration in tumors (from the Bergonié Cancer Institute cohort). One-way ANOVA (parametric) or a Kruskal-Wallis test (nonparametric) was used to evaluate the correlation between expression intensity and levels of immune infiltrates. (B) Associations between NLRC4, CASP1, or IL18 somatic copy number alterations and composition of the tumor immune infiltrate, obtained from TCGA cohort and analyzed using TIMER. Box-and-whisker plots are presented to show the distributions of each immune subset at each copy number status in COAD cancer patients. The infiltration level for each category was compared with the normal using 2-sided Wilcoxon’s rank-sum test. (C) Correlation coefficient and P values between NLRC4, CASP1, or IL18 transcripts and levels of immune infiltration for various immune cell subsets in COAD patients, obtained from TCGA cohort and analyzed using TIMER. (D) Association between protein expression levels of tumor epithelial NLRC4 and IL-18 with patient overall survival in the Bergonié cohort. Patients were stratified based on protein expression levels of NLRC4 and IL-18 (left) as high versus low expression in the colon epithelium (inside the cytokeratin mask). NC, could not be calculated. A log-rank test stratified according to protein expression was used. Right: 5-year overall survival rate (%). (E) Frequency of patients with low, mild, or high tumor immune infiltrates (as pathologically characterized by immune infiltration, CD3+ T cells, or CD8+ T cells) among 3 different population of patients expressing high or low levels of tumor epithelial NLRC4 and/or IL-18 (from the Bergonié cohort). COAD, colon adenocarcinoma. *P < 0.05; **P < 0.01; ***P < 0.001; ****P < 0.0001.
Figure 3
Figure 3. NLRC4 expression in cancer cells triggers an immune transcriptional program.
(A) Left: Volcano plots of differentially expressed genes in HT29-NLRC4 or THP1-NLRC4 versus mock control cell lines, as measured by RNA-seq analysis. Differential gene expression performed with DeSeq2. The x axis shows the log2-transformed fold change of NLRC4-overexpressing lines over control, and the y axis is the –log10 transformation of the adjusted P values. The 10 genes most downregulated (blue) or upregulated (red) are included. In the middle, volcano plots of differentially expressed immune-related genes in the HT29-NLRC4 cell line; or to the right, in the THP1-NLRC4 cell line. (B) Gene Ontology analysis using KEGG pathway of significant upregulated genes (P < 0.05; fold change > 2) in both NLRC4-expressing cell lines. (C) Dot plot representing NLRC4-induced type I IFN genes from both cell lines (HT29-NLRC4, red; THP1-NLRC4, blue), with fold changes of gene expression and associated P values. (D) mRNA transfections of NLRC4 (T337S), or NLRP3 (R260W), or control red fluorescent protein (RFP), in human primary monocytes. Normalized gene expression levels by qPCR of NLRC4 and NLRP3 shown as control (left), or type I IFN genes induced by each mRNA transfection as indicated (right). Data are mean of 2 different donors pooled ± SD (n = 3 independent mRNA transfections per construct); all transfected constructs were compared to the RFP control using Dunnett’s test. *P < 0.05; **P < 0.01; ***P < 0.001.
Figure 4
Figure 4. NLRC4 expression correlates with type I IFN gene signature, MSIhi patient tumors, and is associated with decreased risk of metastasis.
(A) Correlation analysis between expression of the top type I IFN genes upregulated in the HT29-NLRC4 cell line and NLRC4 or NLRP10, in either CRC patients (COAD, READ), lung cancer patients (LUSC, LUAD), or skin cutaneous melanoma (SKCM, primary and metastasis). (B) Correlation analysis between expression of the broader type I IFN gene signature (see Methods) and NLRC4 or NLRP6 in CRC patients (COAD, READ), or in lung cancer patients (LUSC, LUAD). Patient data sets from TCGA cohort; Spearman’s correlation coefficient R and P values are indicated (A and B). (C) Clinical outcome of the top type I IFN genes upregulated in the HT29-NLRC4 cell line (including NLRC4 or NLRP10) in SKCM primary versus metastasis. Patient data sets from TCGA cohort; z scores were determined by using TIMER 2.0 and reflect clinical outcome for each gene (blue: decreased risk P < 0.05, z < 0; red: increased risk P < 0.05, z > 0), with adjusted P values indicated. (D) Association between gene expression of NLR family members (NLRC4, NLRP6, or NLRP10) and microsatellite instability (MSI) status. (E) Association between type I IFN genes (IFI44L, or the gene set encompassing the top 14 NLRC4-induced IFN genes from cell lines) and MSI status in COAD patient tumors. Patient data sets from TCGA cohort, with adjusted P values indicated. MSS, MSI stable; MSI-L, MSI low; MSI-H, MSI high; COAD, colon adenocarcinoma; READ, rectum adenocarcinoma; LUAD, lung adenocarcinoma; LUSC, lung squamous cell carcinoma.
Figure 5
Figure 5. NLRC4 expression is associated with DC2 and DC3 cells and CD4+ and CD8+ T cell tumor infiltrates in cancer patients.
(A) Left: Expression correlation between NLRC4, NLRP10, or TMEM173 (STING) and various tumor-infiltrating DC subsets in CRC (COAD, READ), lung cancer (LUSC, LUAD), or melanoma (SKCM). The various DC subset gene signatures used (for DC1–DC6) were obtained from scRNA-seq of human blood. Right: Scatter plots showing correlation of gene expression between NLRC4, or NLRP10, or TMEM173, and DC2 or DC3 gene signatures in COAD patient tumors. COAD data sets used were obtained from TCGA cohort. (B) Left: Gene expression correlation between NLRC4, NLRP10, or TMEM173 (STING) and CD4 or CD8A in patient tumors; correlation coefficient R is represented by the size of dot, and log10(P value) is represented by the color of the dot. Right: Scatter plots showing correlation of gene expression between NLRC4, or NLRP10, or TMEM173 and CD4 or CD8A in COAD patient tumors. Correlation coefficient R and P values are indicated. (C) Gene expression correlation between NLRC4, CASP1, IL1B, or IL18 and CD4 or CD8A in patient tumors. For AC, data analysis was performed using TCGA patient database cohort; correlation coefficient R is represented by the size of the dots, and log10(P value) is represented by the color of the dot. COAD, colon adenocarcinoma; READ, rectum adenocarcinoma; LUAD, lung adenocarcinoma; LUSC, lung squamous cell carcinoma; SKCM, skin cutaneous melanoma.
Figure 6
Figure 6. NLRC4 expression in cancer cells mediates the release of type I IFN chemokines and myeloid growth factors to induce maturation of human primary DCs toward a Th1 immune response.
(A) Left: HT29-NLRC4 cells or HT29-pEx control cells were cultured in Boyden chambers in the presence or not of IFN-γ, and release of the indicated immune mediators (chemokines, myeloid growth factors, cytokines) was measured in the top chamber by ELISA. Right: Volcano plot of differentially secreted proteins by HT29-NLRC4 versus mock control cell lines as measured by Olink Proteomics. P values were adjusted by multiple testing using the Benjamini-Hochberg method (see Methods). Data presented as mean ± SD (n = 3). (B) IL-12 in cell culture supernatants measured by ELISA from cultures of HT29-NLRC4 cell line alone, HT29-pEx control cell line alone, or cocultured with primary DCs isolated from human blood, with or without LPS (0.1 μg/mL [left], or various concentrations in μg/mL [right]). Cocultures of HT29/DCs (1:1.2 ratio) were maintained for 24 hours in the presence or not of LPS. Data presented as mean ± SD (duplicates), representative of 2 donors with similar pattern. (C) Same experiment as in B, but extended to a broader cytokine array as indicated by using MSD. Data representative of 2 donors with similar patterns. *P < 0.05; **P < 0.01; ***P < 0.001; ****P < 0.0001 by unpaired, 2-tailed Student’s t test (A) or 2-way ANOVA with Šidák’s post hoc test for NLRC4 vs. pEx (B). (D) Same experiment as in B, but additional differentially secreted proteins as measured by Olink Proteomics. Heatmap in the left panel indicates the log2(fold change) between HT29-NLRC4 and WT cells (pEx control), in cocultures with DCs (green) or not (orange), in the presence or not of LPS. Black circles indicate statistically significant changes after multiple testing. Plots to the right show the normalized protein expression values for the various markers, cocultured or not with DCs, with or without LPS.

References

    1. Guo H, et al. Inflammasomes: mechanism of action, role in disease, and therapeutics. Nat Med. 2015;21(7):677–687. doi: 10.1038/nm.3893. - DOI - PMC - PubMed
    1. Rauch I, et al. NAIP-NLRC4 inflammasomes coordinate intestinal epithelial cell expulsion with eicosanoid and IL-18 release via activation of caspase-1 and -8. Immunity. 2017;46(4):649–659. doi: 10.1016/j.immuni.2017.03.016. - DOI - PMC - PubMed
    1. Furman D, et al. Expression of specific inflammasome gene modules stratifies older individuals into two extreme clinical and immunological states. Nat Med. 2017;23(2):174–184. doi: 10.1038/nm.4267. - DOI - PMC - PubMed
    1. Wang SB, et al. DDX17 is an essential mediator of sterile NLRC4 inflammasome activation by retrotransposon RNAs. Sci Immunol. 2021;6(66):eabi4493. doi: 10.1126/sciimmunol.abi4493. - DOI - PMC - PubMed
    1. Canna SW, et al. An activating NLRC4 inflammasome mutation causes autoinflammation with recurrent macrophage activation syndrome. Nat Genet. 2014;46(10):1140–1146. doi: 10.1038/ng.3089. - DOI - PMC - PubMed

MeSH terms