. 2024 Apr 23;134(11):e173892.
doi: 10.1172/JCI173892.

NR2E3 loss disrupts photoreceptor cell maturation and fate in human organoid models of retinal development

Affiliations

NR2E3 loss disrupts photoreceptor cell maturation and fate in human organoid models of retinal development

Nathaniel K Mullin et al. J Clin Invest. .

Abstract

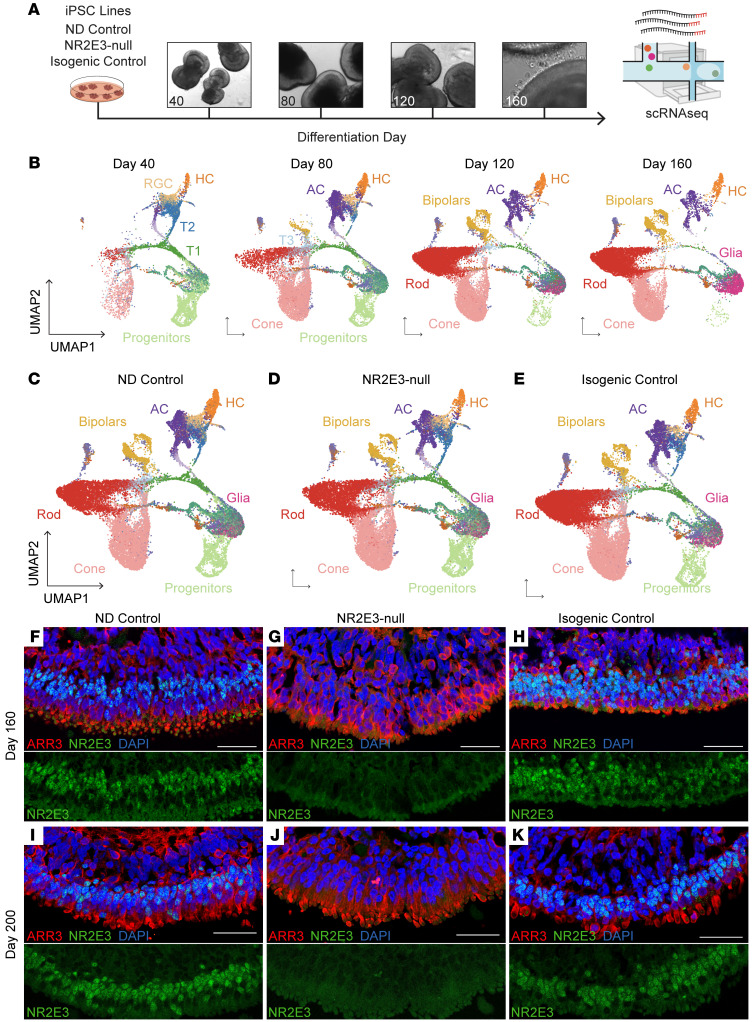
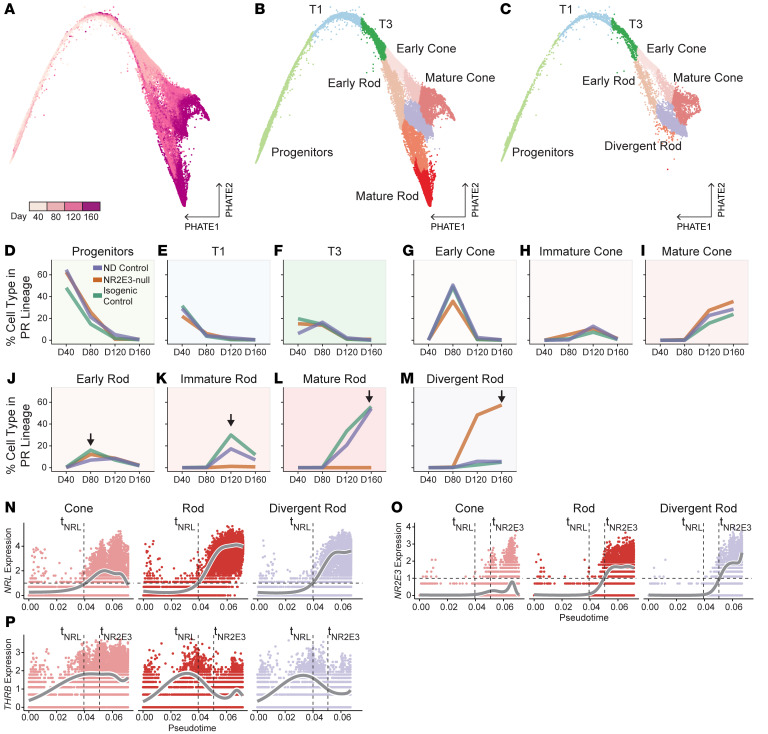
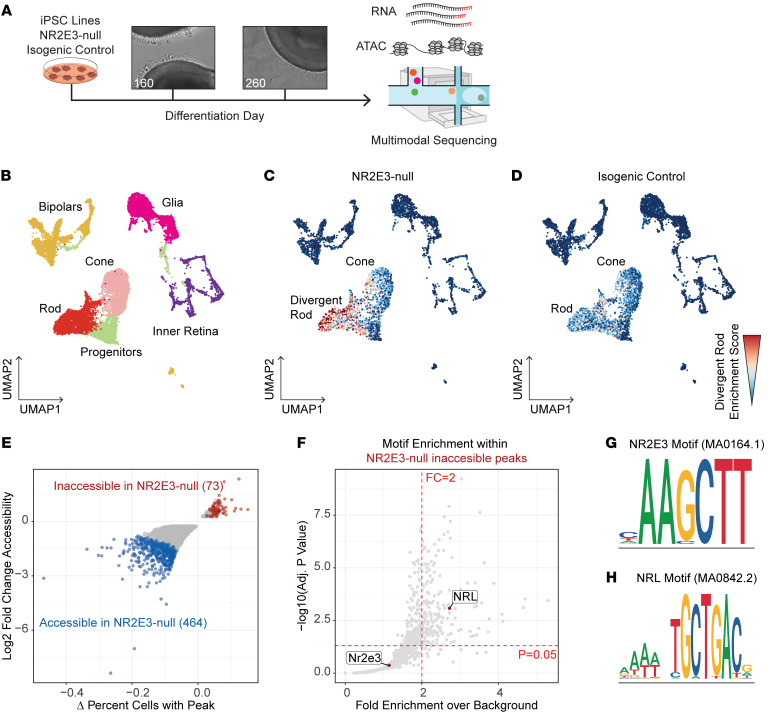
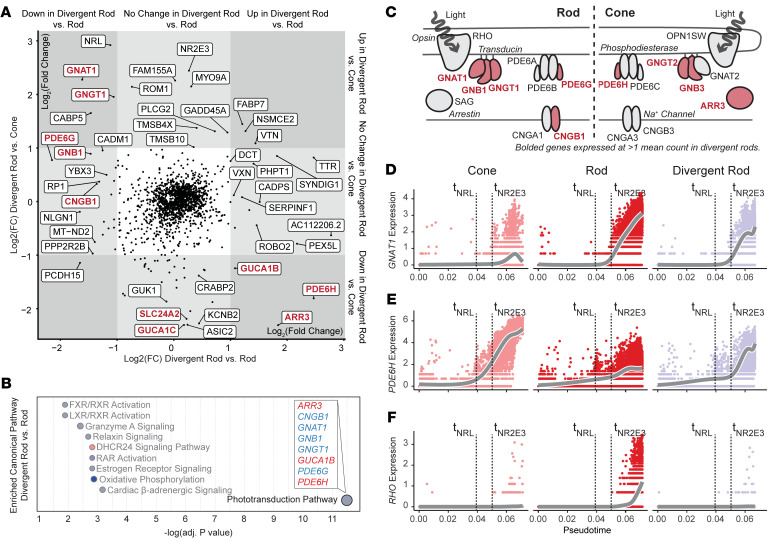
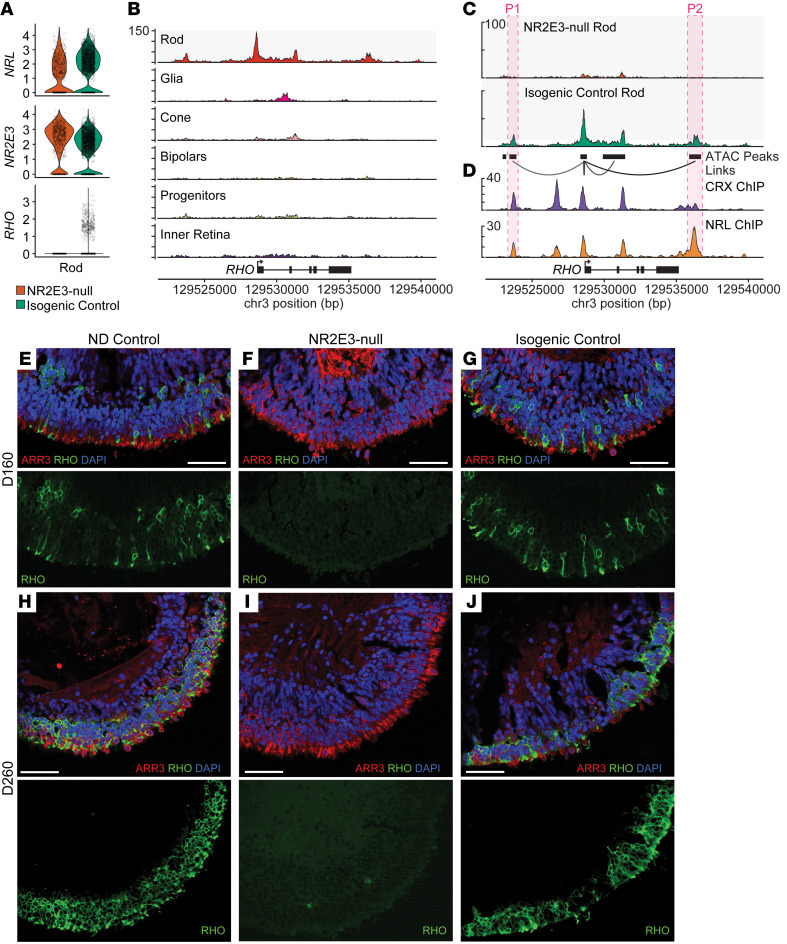
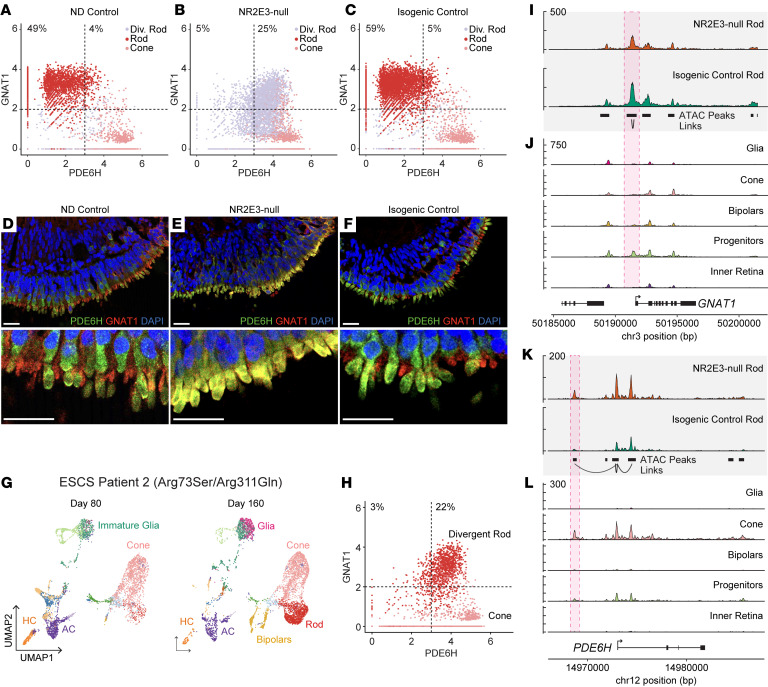
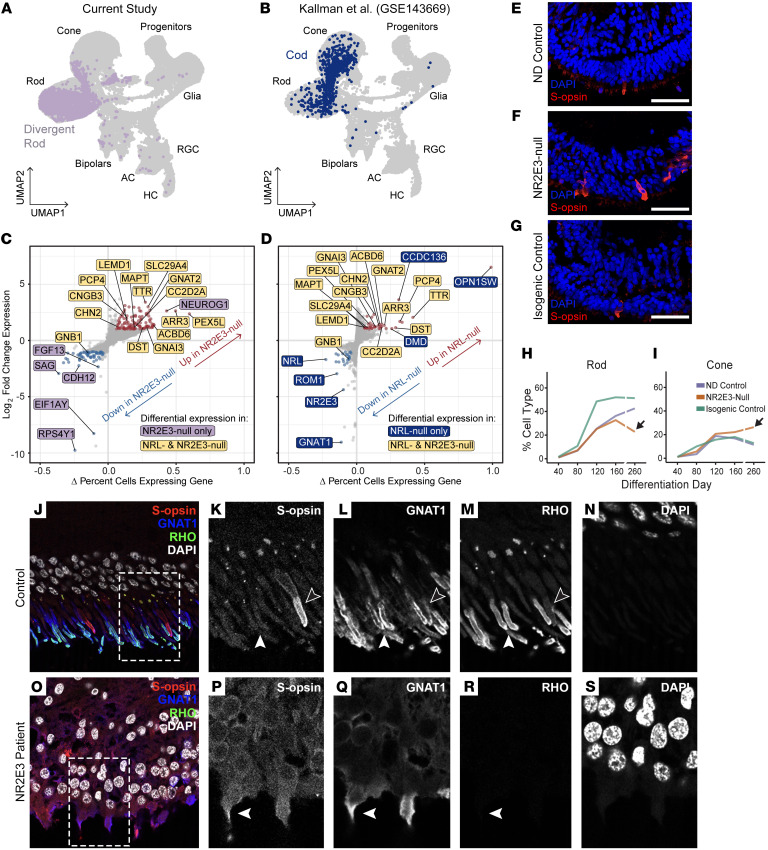
While dysfunction and death of light-detecting photoreceptor cells underlie most inherited retinal dystrophies, knowledge of the species-specific details of human rod and cone photoreceptor cell development remains limited. Here, we generated retinal organoids carrying retinal disease-causing variants in NR2E3, as well as isogenic and unrelated controls. Organoids were sampled using single-cell RNA sequencing (scRNA-Seq) across the developmental window encompassing photoreceptor specification, emergence, and maturation. Using scRNA-Seq data, we reconstruct the rod photoreceptor developmental lineage and identify a branch point unique to the disease state. We show that the rod-specific transcription factor NR2E3 is required for the proper expression of genes involved in phototransduction, including rhodopsin, which is absent in divergent rods. NR2E3-null rods additionally misexpress several cone-specific phototransduction genes. Using joint multimodal single-cell sequencing, we further identify putative regulatory sites where rod-specific factors act to steer photoreceptor cell development. Finally, we show that rod-committed photoreceptor cells form and persist throughout life in a patient with NR2E3-associated disease. Importantly, these findings are strikingly different from those observed in Nr2e3 rodent models. Together, these data provide a road map of human photoreceptor development and leverage patient induced pluripotent stem cells to define the specific roles of rod transcription factors in photoreceptor cell emergence and maturation in health and disease.

Keywords: Development; Genetic diseases; Monogenic diseases; Ophthalmology; iPS cells.


Figures

Figure 1
Figure 1. Modeling pathological retinal development using retinal organoids.
(A) Schematic for organoid differentiation time course with scRNA-Seq. (B) Integrated and annotated cells recovered from all scRNA-Seq samples projected in 2D space using UMAP embeddings. Cells are grouped by time point of collection. (CE) Cells from all time points are split by cell line of origin. (F) No-disease control (ND control) organoids express NR2E3 (green) in rod nuclei at D160 of differentiation. Cone photoreceptors express cone arrestin (ARR3, red).(G) NR2E3-null organoids express cone arrestin but lack expression of NR2E3. (H) Monoallelic correction of NR2E3 restores expression of NR2E3 in D160 organoids. (IK) At D200 of differentiation, NR2E3 expression remains high in ND control and isogenic control lines and is absent in NR2E3-null samples. Scale bars: 50 μm.
Figure 2
Figure 2. Divergent rods emerge in NR2E3-null organoids.
(A) PHATE reduction showing cells within the photoreceptor lineage. Cells are colored by time point of sample collection. (B) Cells from NR2E3-null and control lines are annotated together based on time point and PHATE-derived cluster. (C) Cells annotated based on PHATE clustering from only the NR2E3-null line. (DF) The proportion of early and intermediate progenitors decreases uniformly across differentiation of all lines. (GI) The proportion of maturing cones follows differentiation time point in all lines. (J) All lines form early rod photoreceptors at D80 (arrow). (K and L) Only ND control and isogenic control lines form immature and mature rod photoreceptors at D120 and D160 (arrows). (M) Divergent rods emerge by D120 and are largely restricted to the NR2E3-null line (arrow). (N) NRL expression is plotted against pseudotime for each lineage on a log scale. NRL expression is observed at comparable levels in rod and divergent rod lineages and is induced at the same point in pseudotime. The pseudotime value at which NRL expression passes 1 is shown as tNRL. (O) NR2E3 expression level across pseudotime is shown. In addition to tNRL (NRL induction pseudotime point), the point at which NR2E3 expression passes 1 is shown as tNR2E3. The timing of NR2E3 induction is similar in rod and divergent rod lineages. (P) THRB expression level across pseudotime is shown.
Figure 3
Figure 3. NR2E3 loss disrupts rod chromatin accessibility.
(A) Experimental schematic showing collection of nuclei from D160 and D260 retinal organoids for joint multimodal single-nucleus sequencing. (B) Annotated WNN-UMAP projections of cells assayed by joint multimodal single-nucleus sequencing. Both lines contribute to all cell type clusters. (C and D) Two-dimensional projection of cells based on WNN analysis of gene expression and ATAC-seq profiles. Cells split by line (NR2E3-null and isogenic control). Cells are shaded based on divergent rod gene module score, with red indicating enrichment for divergent rod module genes. (E) Differential ATAC peak accessibility between NR2E3-null and isogenic control rods. Peaks that are more accessible in the control line (i.e., closed in the NR2E3-null rods) are shown in red, while peaks that are more accessible in the NR2E3-null line are shown in blue. More peaks are accessible in NR2E3-null versus control, indicating a globally repressive role for NR2E3 in maturing rod photoreceptors. (F) Transcription factor binding motif enrichment in peaks that are inaccessible in the NR2E3-null rods versus control. Enrichment of the NRL motif indicates reliance of NRL on NR2E3 presence for binding. (G and H) Motif symbols for the NR2E3- and NRL-binding motifs used for analysis in F.
Figure 4
Figure 4. Divergent rods express a combination of rod- and cone-specific genes involved in phototransduction.
(A) Differentially expressed genes between the divergent rod and rod (x axis) or cone (y axis) lineages. Compared with normal rods, divergent rods upregulate several cone-specific transcripts, as well as genes involved in synaptogenesis. Compared with normal cones, divergent rods upregulate canonical rod transcripts. Genes involved in phototransduction are highlighted in red. (B) Diagram of rod-specific (left) and cone-specific (right) components of the phototransduction pathway. Genes expressed in divergent rods are colored, and those not expressed in divergent rods are shown in gray. (C) Pathway enrichment analysis for differentially expressed genes between divergent rod and rod clusters (the x axis of A). (D) The rod-specific transducin component (GNAT1) is expressed in rod and divergent rod lineages but not in normal cones. (E) The cone-specific phosphodiesterase PDE6H is expressed in the normal cone lineage and in divergent rods across the same developmental time. (F) The rod-specific opsin RHO is expressed late in normal rod development but not divergent rods. For DF, tNRL and tNR2E3 indicate pseudotime points of NRL and NR2E3 expression induction, respectively (as in Figure 2, O and P).
Figure 5
Figure 5. NR2E3-null rods fail to activate expression of rhodopsin.
(A) Violin plots show expression of NRL, NR2E3, and RHO within rods from either NR2E3-null or isogenic control organoids (D120 and D160 combined from the multimodal sequencing experiment in Figure 2). NR2E3-null rods express the transcription factors NRL and NR2E3 at the transcript level but do not express RHO transcript. (B) ATAC coverage tracks for isogenic control organoids (D160 and D260 combined) are shown. Accessibility in regions around RHO is observed in the rod cluster. (C) ATAC coverage for the rod cluster is shown for NR2E3-null and isogenic control samples. Below coverage tracks, ATAC peaks are shown as black boxes. Lines connecting peaks to the transcriptional start site of RHO represent peak-to-gene linkages. Two peaks (P1 and P2) that are linked to RHO expression and accessible only in control rods are highlighted in red. (D) CRX and NRL ChIP-Seq tracks from adult human donor eye samples are shown aligned to the tracks in C. NR2E3-dependent peaks highlighted in C are bound by NRL in human retina. (EG) At D160, RHO-expressing photoreceptors are observed in ND control (E) and isogenic control (G) organoids, but no RHO-expressing cells are seen in NR2E3-null organoids (F). (HJ) By D260, RHO expression increases in ND control (H) and isogenic control (J) organoids but is still absent from NR2E3-null organoids (I). Scale bars: 50 μm.
Figure 6
Figure 6. NR2E3 is required for repression of cone-specific phototransduction genes.
(A) Cells of the photoreceptor lineage from the ND control line are plotted based on expression level of PDE6H (x axis) and GNAT1 (y axis). Photoreceptor cells segregate by class with rods expressing GNAT1 and cones expressing PDE6H. (B) Divergent rods coexpress PDE6H and GNAT1 at high levels. No cells are observed to express only GNAT1, indicating lack of a normal rod population. PDE6H-expressing cone population is similar to controls. (C) The isogenic control line restores normal segregation of photoreceptor classes. (D) Segregation of expression of GNAT1 (red) and PDE6H (green) into rods and cones is observed in D260 ND control retinal organoids. (E) Photoreceptors from the NR2E3-null organoids exhibit colocalization of GNAT1 and PDE6H protein. (F) Segregation of expression is restored in isogenic control organoids. (G) Cells recovered from D80 and D160 organoids derived from a second ESCS patient were projected in 2D space using UMAP embeddings. Cells are shown grouped by cell type annotation derived from the first single-cell experiment (Figure 1). (H) PDE6H and GNAT1 expression in rod and cone photoreceptors isolated from organoids from ESCS patient 2 (as shown in G). The proportion of cells coexpressing GNAT1 and PDE6H is comparable to that in B. (I) ATAC coverage tracks for the rod cluster of organoids (D160 and D260 combined) are shown at the top for NR2E3-null and isogenic control samples. (J) Other cell type tracks show chromatin accessibility of the isogenic control sample. The GNAT1 locus is shown. A peak linked to expression of GNAT1 is shown boxed in red. This peak is accessible in both NR2E3-null and isogenic control rods. (K) The PDE6H locus is shown. NR2E3-null rods show accessibility at a peak normally accessibly only in cones (L). This peak is linked to expression of PDE6H. Scale bars: 50 μm.
Figure 7
Figure 7. Divergent rod fate in the context of ESCS.
(A and B) D40–D260 data from the photoreceptor lineage of the current study integrated with the same cell types from Kallman et al. (31). Cells are shown split by study and projected in 2D space using UMAP embeddings. Divergent rods are colored lavender, and NRL-null cods are colored blue. (C and D) Differential expression analysis between pathological and normal rods from each study. Genes in yellow are significantly dysregulated in both NRL- and NR2E3-null cells compared with control rods. Genes in lavender (C) are dysregulated exclusively in divergent rods. Genes in blue (D) are dysregulated exclusively in NRL-null cods. (EG) D260 retinal organoids from the current study stained for S-opsin. NR2E3-null organoids display a modest increase in the proportion of S-opsin–expressing cells. (H and I) Between D160 and D260 the rod proportion of NR2E3-null organoids decreases while the cone proportion increases. The opposite trend is observed in controls. (J) Staining of control postmortem donor retina shows rare short-wavelength cones (S-opsin), and colocalization of rhodopsin and GNAT1 in rods. (KN) Cropped image from J showing S-cone (black arrowheads) and rods (white arrowheads). (O) In an NR2E3 disease donor retina, no rhodopsin staining is observed, and colocalization of S-opsin and GNAT1 is present. (PS) Cropped image from O showing photoreceptor coexpressing S-opsin and GNAT1 (white arrowheads). Scale bars: 50 μm.

References

    1. Morrow EM, et al. Vertebrate photoreceptor cell development and disease. Trends Cell Biol. 1998;8(9):353–358. doi: 10.1016/S0962-8924(98)01341-5. - DOI - PubMed
    1. Trimarchi JM, et al. Individual retinal progenitor cells display extensive heterogeneity of gene expression. PLoS One. 2008;3(2):e1588. doi: 10.1371/journal.pone.0001588. - DOI - PMC - PubMed
    1. Stone EM, et al. Clinically focused molecular investigation of 1000 consecutive families with inherited retinal disease. Ophthalmology. 2017;124(9):1314–1331. doi: 10.1016/j.ophtha.2017.04.008. - DOI - PMC - PubMed
    1. Diacou R, et al. Cell fate decisions, transcription factors and signaling during early retinal development. Prog Retin Eye Res. 2022;91:101093. doi: 10.1016/j.preteyeres.2022.101093. - DOI - PMC - PubMed
    1. Lima Cunha D, et al. The spectrum of PAX6 mutations and genotype-phenotype correlations in the eye. Genes (Basel) 2019;10(12):1050. doi: 10.3390/genes10121050. - DOI - PMC - PubMed

MeSH terms

Substances