. 2024 May 28;43(5):114127.
doi: 10.1016/j.celrep.2024.114127. Epub 2024 Apr 21.

Mapping of susceptibility loci for Ebola virus pathogenesis in mice

Affiliations

Mapping of susceptibility loci for Ebola virus pathogenesis in mice

Alexandra Schäfer et al. Cell Rep. .

Abstract

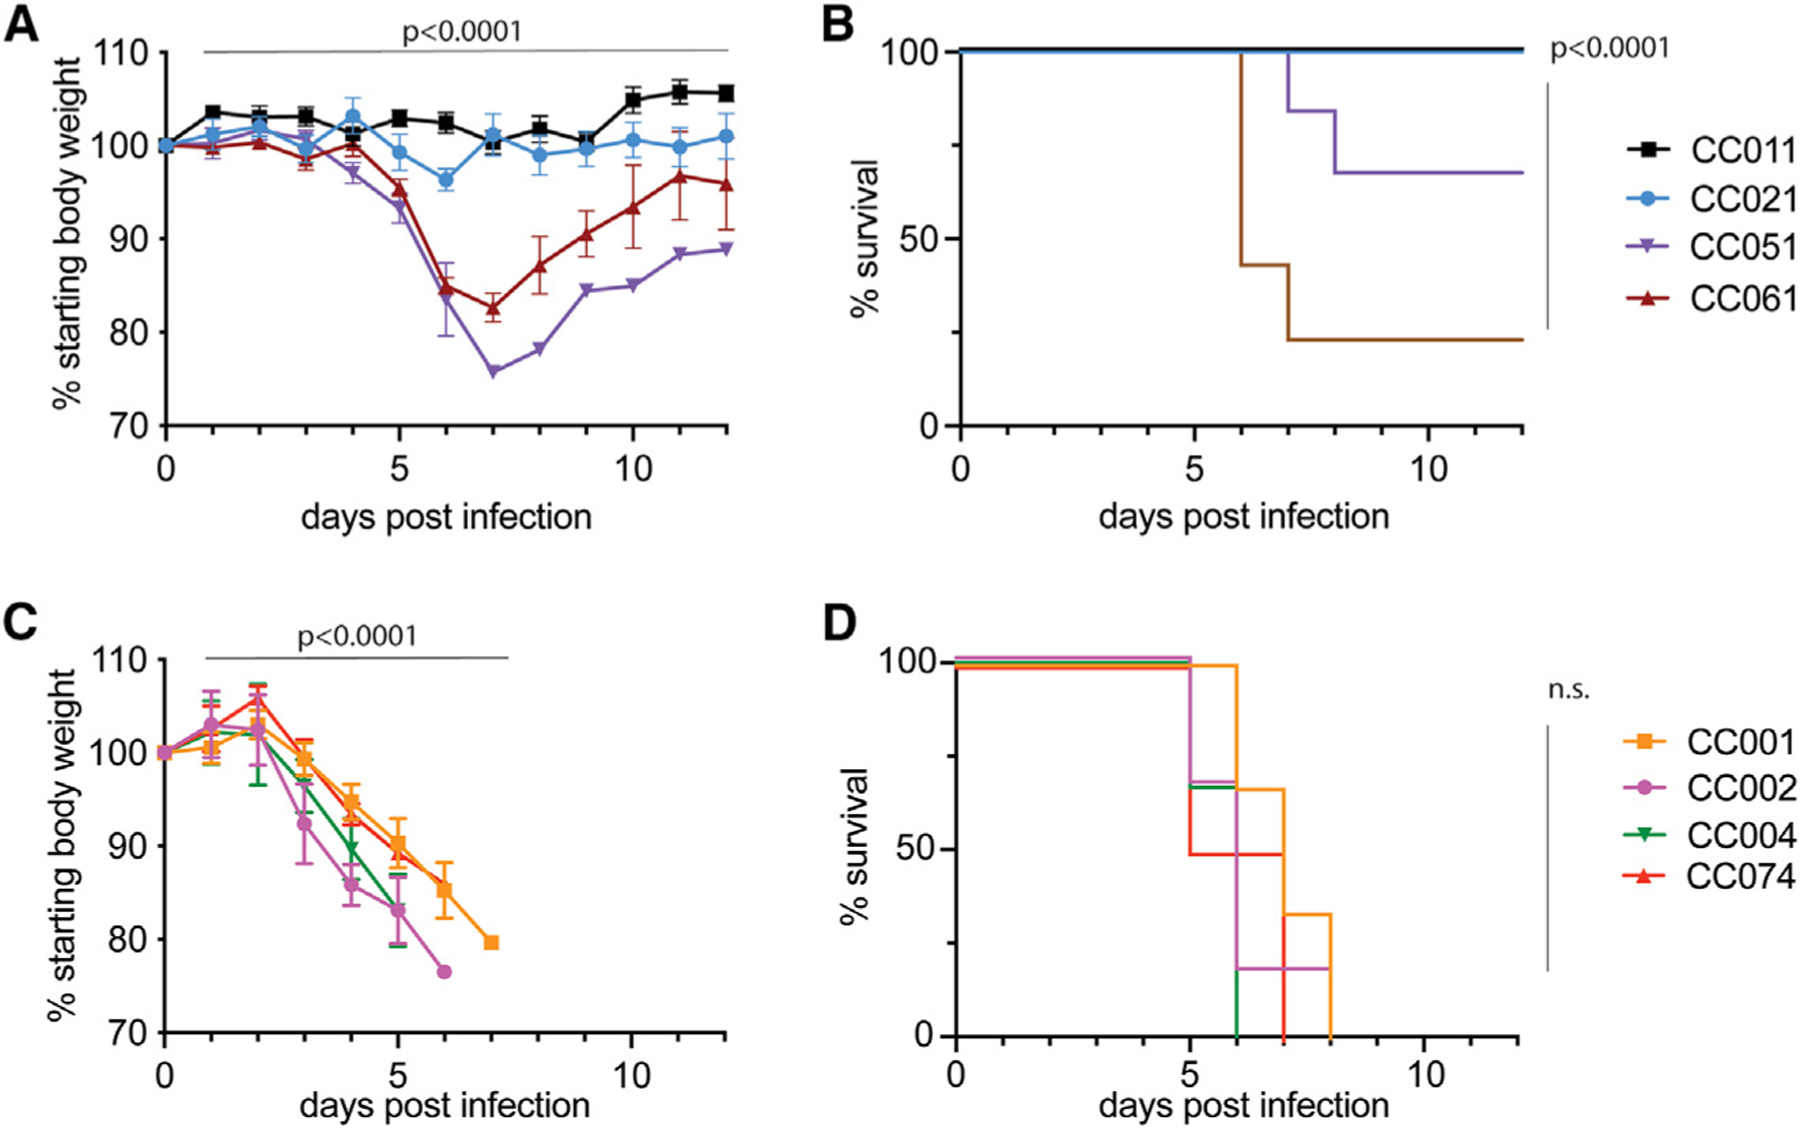
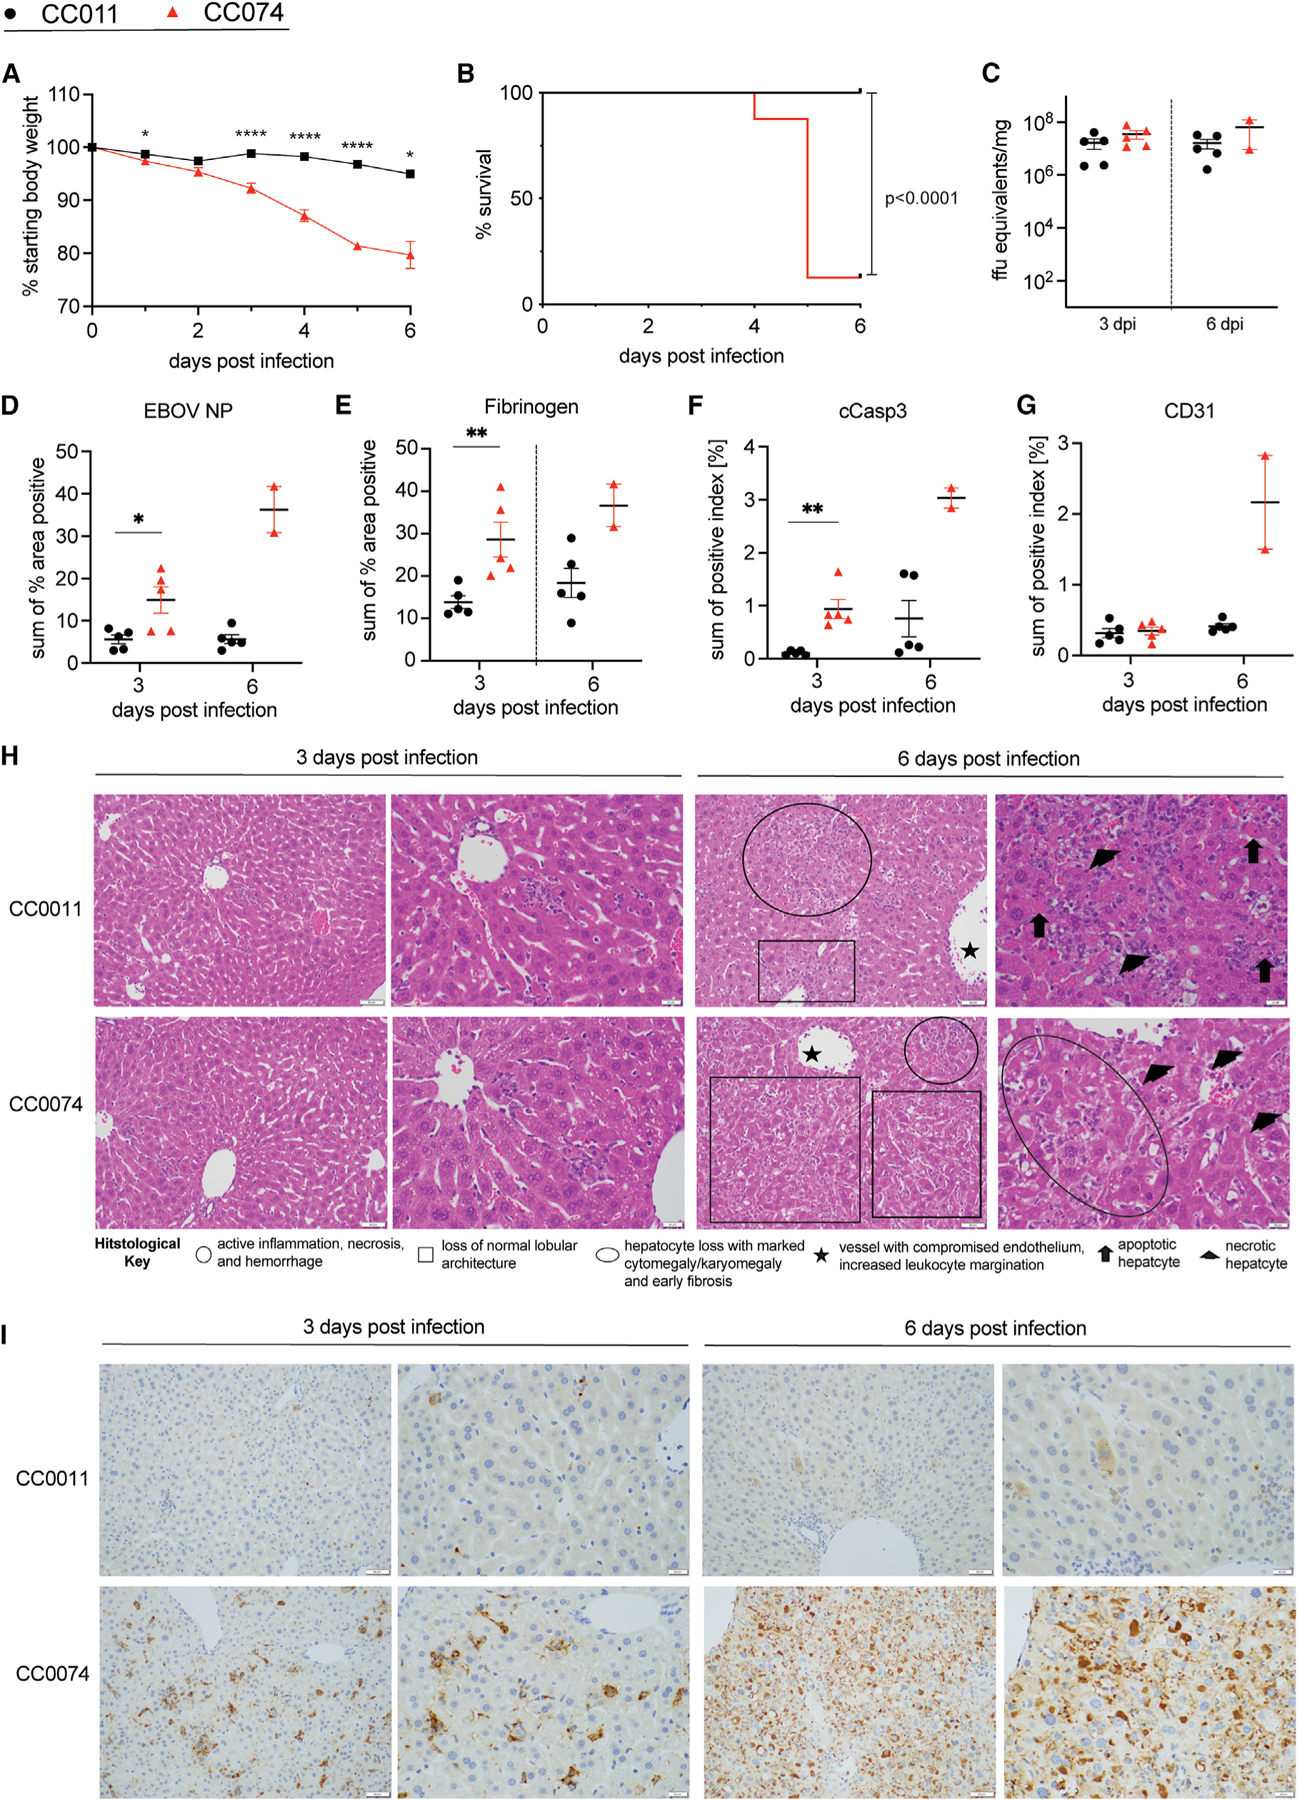
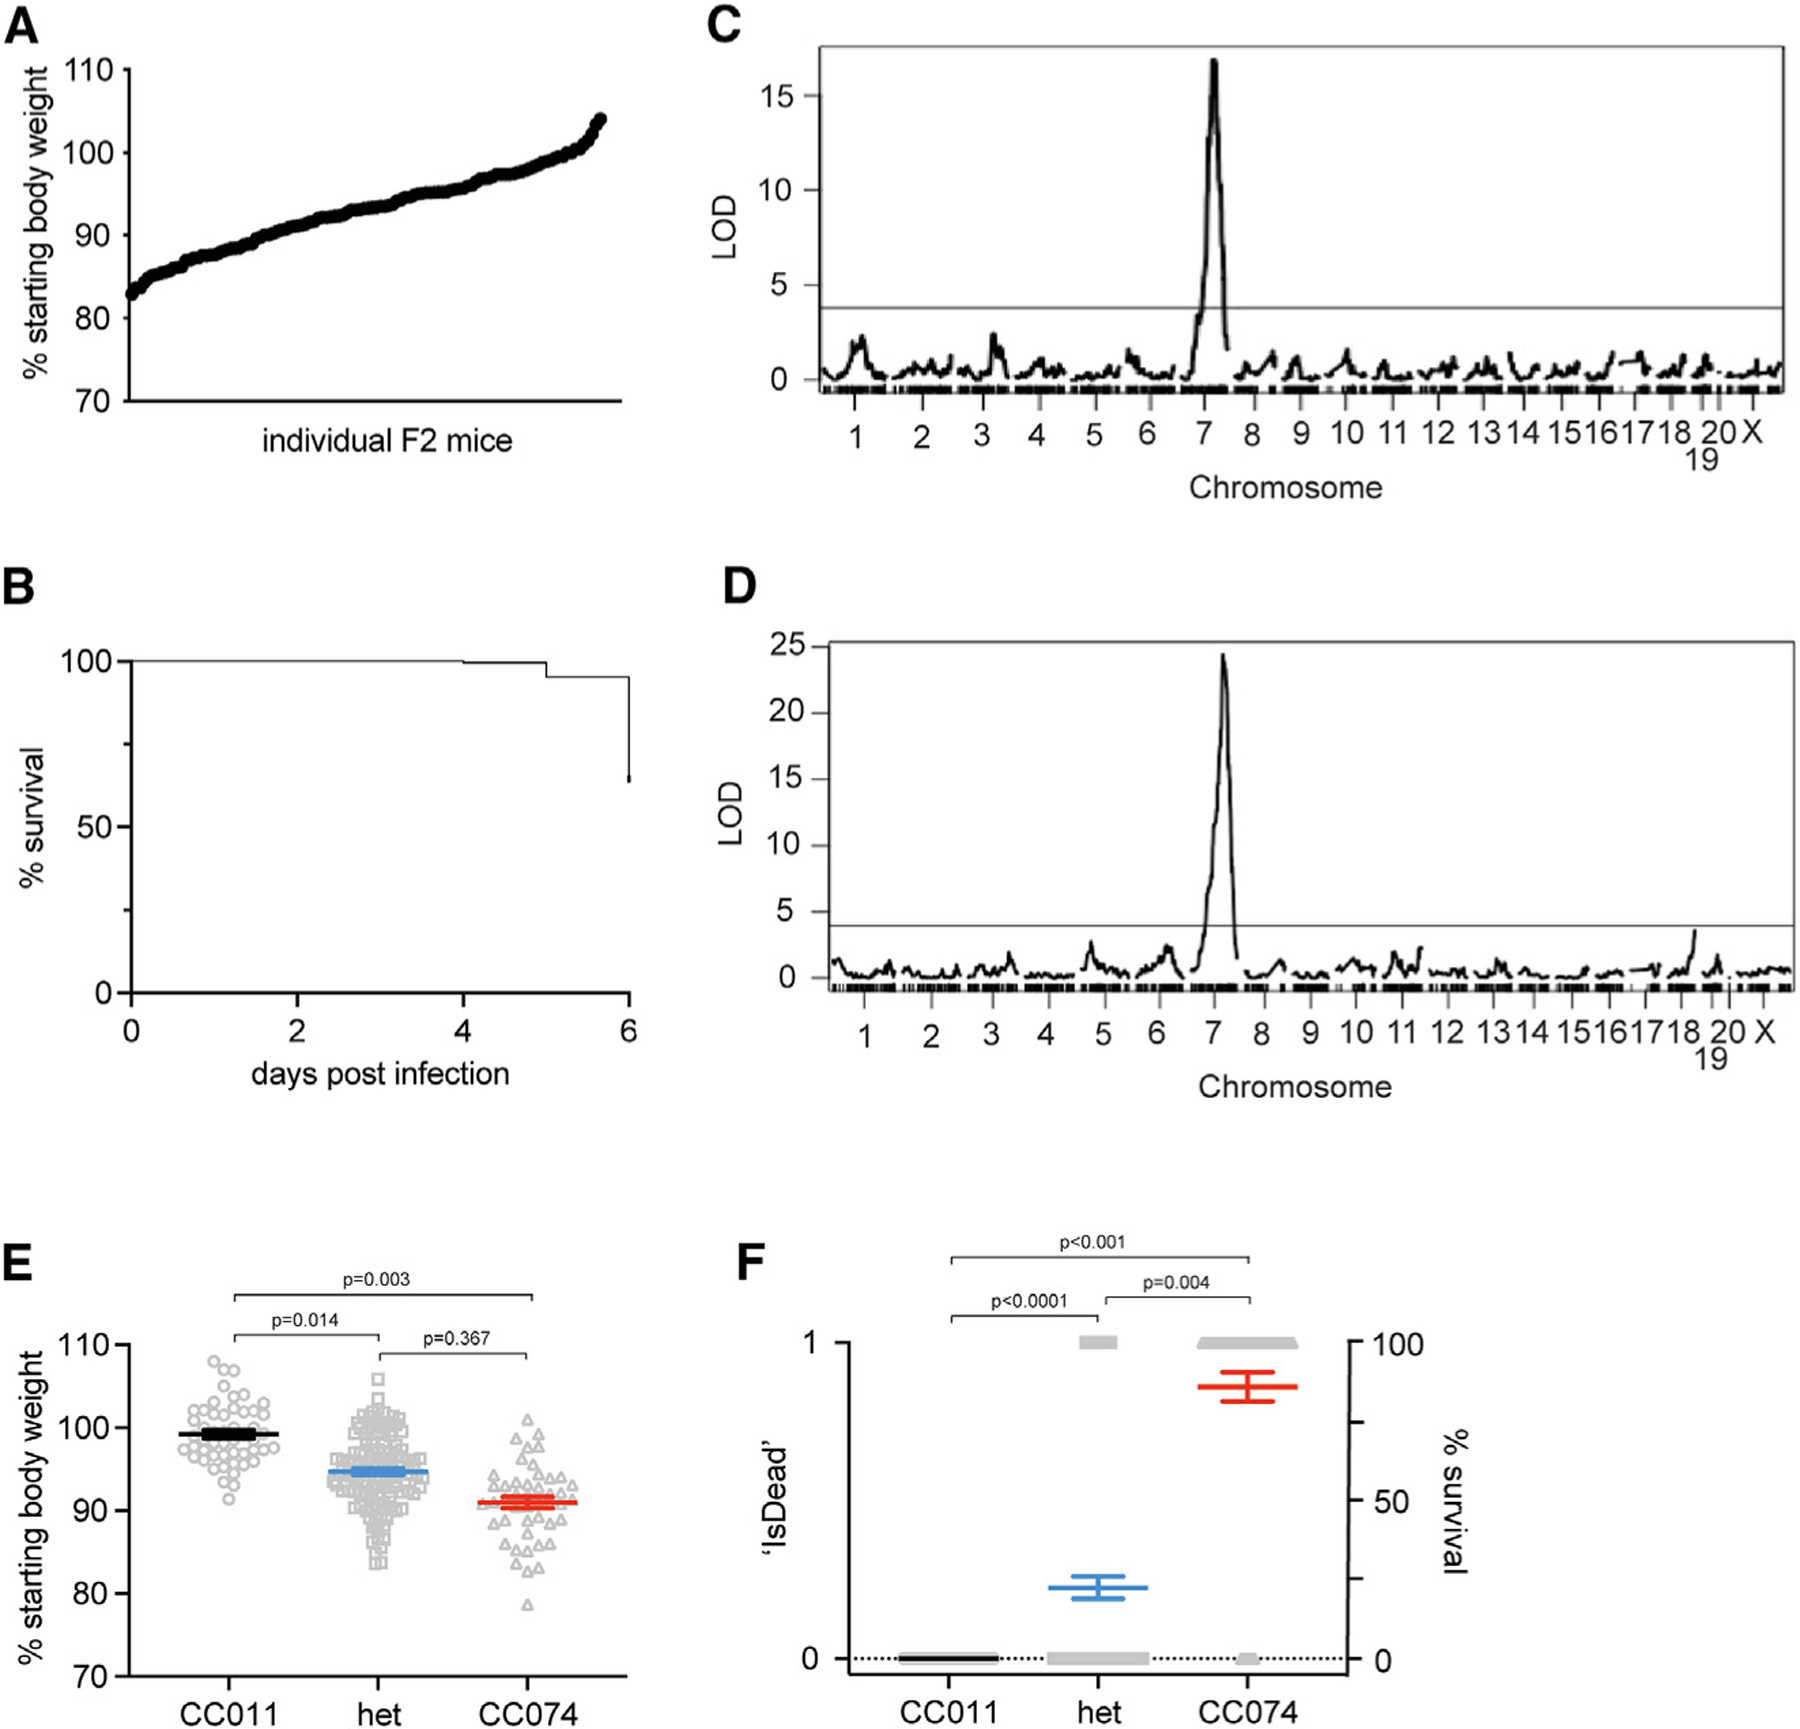
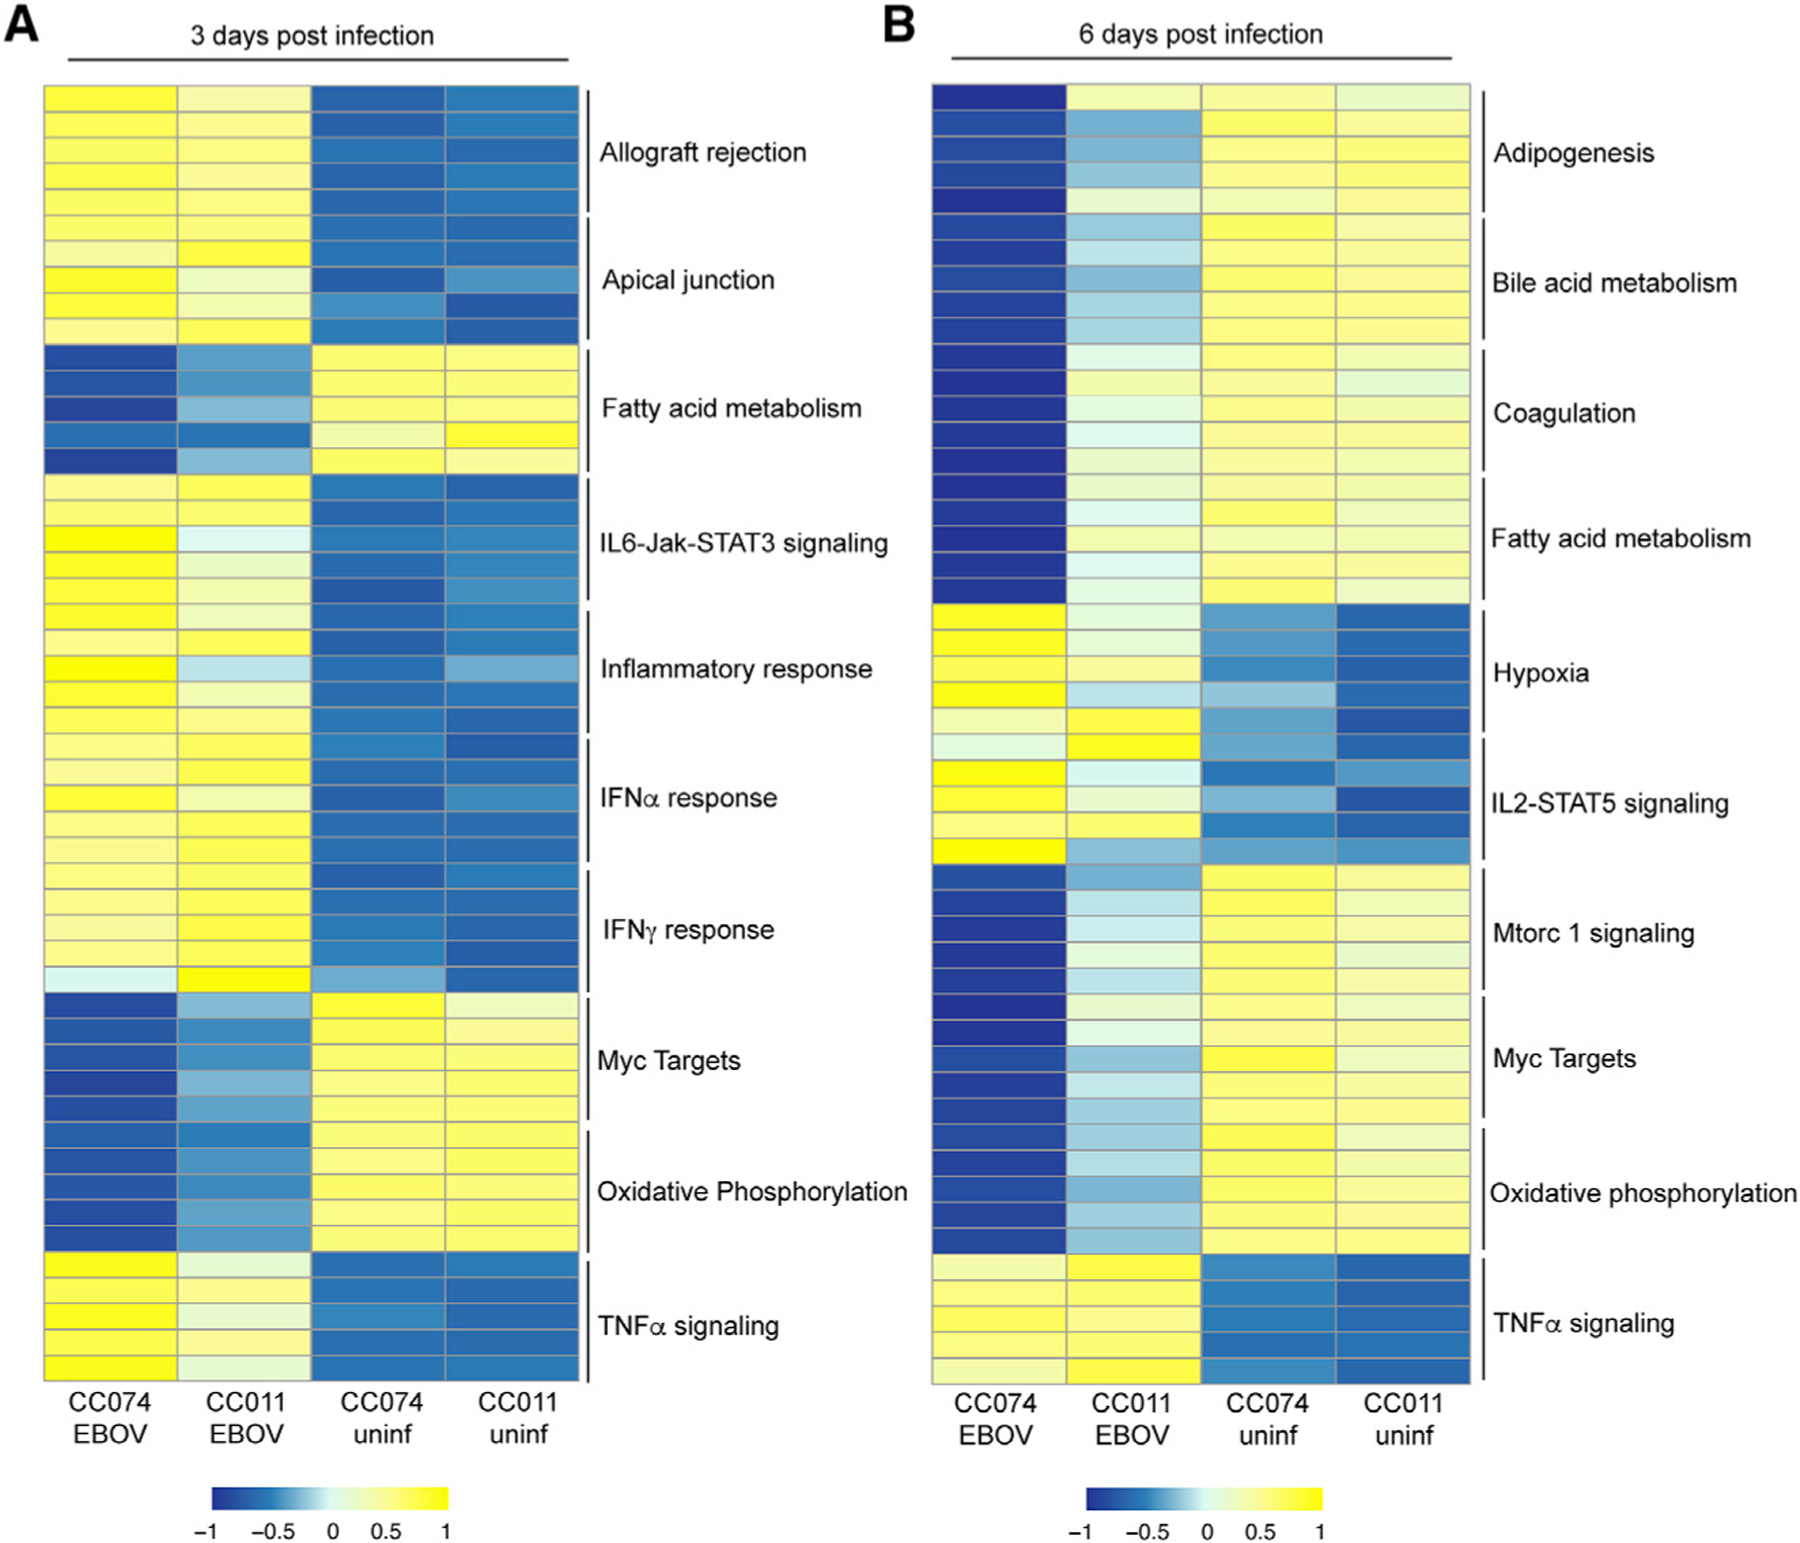
Ebola virus (EBOV), a major global health concern, causes severe, often fatal EBOV disease (EVD) in humans. Host genetic variation plays a critical role, yet the identity of host susceptibility loci in mammals remains unknown. Using genetic reference populations, we generate an F2 mapping cohort to identify host susceptibility loci that regulate EVD. While disease-resistant mice display minimal pathogenesis, susceptible mice display severe liver pathology consistent with EVD-like disease and transcriptional signatures associated with inflammatory and liver metabolic processes. A significant quantitative trait locus (QTL) for virus RNA load in blood is identified in chromosome (chr)8, and a severe clinical disease and mortality QTL is mapped to chr7, which includes the Trim5 locus. Using knockout mice, we validate the Trim5 locus as one potential driver of liver failure and mortality after infection. The identification of susceptibility loci provides insight into molecular genetic mechanisms regulating EVD progression and severity, potentially informing therapeutics and vaccination strategies.

Keywords: CP: Immunology; CP: Microbiology; Ebola virus disease (EVD); QTL; Trim5 locus; collaborative cross mice; filovirus; host response; liver damage.


Conflict of interest statement

Declaration of interests D.O.C. is employed by, has equity ownership in, and serves on the board of directors of TransViragen, the company that has been contracted by UNC-Chapel Hill to manage its Animal Models Core Facility. R.S.B. is a member of advisory boards for VaxArt, Takeda, and Invivyd, focused on unrelated projects.

Figures

Figure 1.
Figure 1.. CC strains demonstrate different EVD-like disease after MA-EBOV infection
Age-matched female mice (n = 6 per group) of eight genetically diverse CC strains (CC001, CC02, CC004, CC011, CC021, CC051, CC061, and CC074) were infected i.p. with 100 ffu MA-EBOV and monitored daily for weight loss and mortality until day 12 post infection. (A and B) (A) Weight loss and (B) survival curves for CC011, CC021, CC051, and CC061 mice. (C and D) (C) Weight loss and (D) survival curves for CC001, CC002, CC004, and CC074 mice. Data were analyzed using Mann-Whitney test (weight loss) and log rank test (survival) and significance is indicated.
Figure 2.
Figure 2.. Characterization of EBOV infection in the two parental strains, CC011 and CC074
(A and B) Age-matched CC011 and CC074 mice (n = 16 each, 8–10 weeks, both sexes) were infected with 100 ffu MA-EBOV and mice were monitored daily for weight loss (A) and mortality (B). (C–G) (C) Groups of CC011 and CC074 were used to evaluate the viral load in the liver (n = 5 female for all, except n = 2 males for CC074 on 6 dpi). Liver samples of matched mice from (C) were then used for quantification by IHC staining of (D) EBOV NP, (E) fibrinogen, (F) cleaved caspase 3, and (G) CD31 in the liver. (H and I) Representative images (20× and 40×, respectively) of the (H) hematoxylin and eosin (H&E)-stained liver sections and (I) EBOV nucleoprotein-immunostained liver sections utilized for the histological assessment of differences between CC011 and CC074 at 3 and 6 dpi; scale bars, 50 μm. Data were analyzed using Mann-Whitney test (weight loss, liver titer, histological quantification) and log rank test (survival). Significance is indicated as *p < 0.05, **p < 0.005, and ****p < 0.0001.
Figure 3.
Figure 3.. Disease phenotypes and identification of a severe EVD-like disease QTL on chr7
Eight- to 10-week-old CC011xCC074-F2 mice (n = 236; 123 females, 113 males) were generated and infected with 100 ffu MA-EBOV i.p. and followed for 6 days for weight loss and mortality. (A) Weight loss on day 5 post infection of CC011xCC074-F2 mice. (B) Survival of CC011xCC074-F2 mice over the time of infection. (C) QTL map for the weight loss on day 5 post infection. (D) QTL map for the overall survival rate over the time of infection. Phenotypes were grouped based on a homozygous CC011 genotype, a heterozygous genotype, and a homozygous CC074 genotype. (E) The allele plot for weight loss on 5 dpi, and (F) the allele plot for percentage survival over the time of infection; 0 = alive, 1 = dead. Data were analyzed using Mann-Whitney test (allele plots for weight loss and survival). LOD, log10 likelihood ratio; dotted line indicates the genome-wide p = 0.05 significance threshold.
Figure 4.
Figure 4.. Characterization of EBOV infection in Trim+/+ and Trim/ mice
(A) A neighbor-joining phylogenetic tree was constructed from a multiple sequence alignment of the human TRIM5 protein and mouse orthologs (TRIM12a, TRIM12c, TRIM30a, TRIM30b, TRIM30c, and TRIM30d). Similarities (based on the Blosum62 similarity matrix) are included as a heatmap with similarity ranging from 50% (gold) to 100% (blue). The multiple sequence alignment was performed, the neighbor-joining tree was constructed in Geneious Prime, and the tree and distances were output as Newick and CSV files, respectively. The tree and heatmap were then rendered for publication in EvolView (https://www.evolgenius.info) and Adobe Illustrator CS. (B) The Trim5 locus in wild-type C57BL/6J mice (indicated by red box). For validation of the Trim5 locus as a susceptibility region during MA-EBOV infection, age-matched Trim/ (n = 20) and Trim+/+ littermates (n = 27) (all 8–10 weeks old, both sexes) were infected i.p. with 100 ffu MA-EBOV. (C) Survival; dashed line indicates median survival. (D–I) (D) Weight loss. A group of Trim+/+ and Trim/ (n = 5 females for all at both time points) was then used to evaluate the (E) viral load in the liver (6 dpi only) and for quantification of (F) EBOV NP in the liver, (G) fibrinogen, (H) cleaved caspase 3, and (I) CD31 of Trim+/+ and Trim/ mice by IHC staining. (J and K) Representative images (20× and 40×, respectively) of the (J) H&E-stained liver sections and (K) EBOV nucleoprotein-immunostained liver sections utilized for the histological assessment of differences between Trim+/+ and Trim/ mice at 3 and 6 dpi; scale bars, 50 μm. Circles are areas of active inflammation, necrosis, and hemorrhage. Squares are areas of active inflammation and necrosis. Stars denote vessels with compromised endothelium and increased leukocyte adherence/margination. Arrows denote apoptotic hepatocytes. Arrowheads denote necrotic hepatocytes. Data were analyzed using Mann-Whitney test (weight loss, liver titer, histological quantification) and log rank testing (survival). Significance is indicated as **p < 0.005.
Figure 5.
Figure 5.. Differentially expressed gene signatures in the liver in the two parental strains, CC011 and CC074
Heatmap of the top five ranked genes in the top 10 significantly enriched pathways in infected CC011 and CC074 mice compared to their respective mock-infected controls (<1.5 log2 fold over mock; p < 0.05); shown are the average expression level for each gene for each group on (A) 3 dpi and (B) 6 dpi, (n = 5 EBOV-infected females for all time points, except for n = 2 EBOV-infected males for CC074 on 6dpi, n = 3 mock-infected females for all time points).
Figure 6.
Figure 6.. Differentially expressed gene signatures in the liver in Trim+/+ and Trim/ mice
(A) Heatmap of the top five ranked genes in the top 10 significantly enriched pathways in infected Trim+/+ and Trim/ mice compared to their respective mock-infected controls (<1.5 log2 fold over mock; p < 0.05); shown are the average expression levels for each gene for each group on 6 dpi (n = 5 females for all time points, n = 3 females for all time points for mocks). (B) Heatmap of key genes being significantly affected during the development of EVD-like disease in the liver (in bold). For each gene, the average normalized transcript counts (log2 cpm.) are shown. Data were analyzed using Mann-Whitney test; significance is indicated as p* < 0.05, **p < 0.005 (n = 5 EBOV-infected females for all time points, n = 3 mock-infected females for all time points).

References

    1. Sawyer SL, Emerman M, and Malik HS (2007). Discordant evolution of the adjacent antiretroviral genes TRIM22 and TRIM5 in mammals. PLoS Pathog 3, e197. 10.1371/journal.ppat.0030197. - DOI - PMC - PubMed
    1. Jacob ST, Crozier I, Fischer WA 2nd, Hewlett A, Kraft CS, Vega M.A.d.L., Soka MJ, Wahl V, Griffiths A, Bollinger L, and Kuhn JH (2020). Ebola virus disease. Nat. Rev. Dis. Prim 6, 13. 10.1038/s41572-020-0147-3. - DOI - PMC - PubMed
    1. Marzi A, Halfmann P, Hill-Batorski L, Feldmann F, Shupert WL, Neumann G, Feldmann H, and Kawaoka Y (2015). Vaccines. An Ebola whole-virus vaccine is protective in nonhuman primates. Science 348, 439–442. 10.1126/science.aaa4919. - DOI - PMC - PubMed
    1. Geisbert TW, and Feldmann H (2011). Recombinant vesicular stomatitis virus-based vaccines against Ebola and Marburg virus infections. J. Infect. Dis 204, S1075–S1081. 10.1093/infdis/jir349. - DOI - PMC - PubMed
    1. Jones SM, Feldmann H, Ströher U, Geisbert JB, Fernando L, Grolla A, Klenk HD, Sullivan NJ, Volchkov VE, Fritz EA, et al. (2005). Live attenuated recombinant vaccine protects nonhuman primates against Ebola and Marburg viruses. Nat. Med 11, 786–790. 10.1038/nm1258. - DOI - PubMed

Publication types

LinkOut - more resources