. 2024 May 28;43(5):114128.
doi: 10.1016/j.celrep.2024.114128. Epub 2024 Apr 21.

Systematic characterization of multi-omics landscape between gut microbial metabolites and GPCRome in Alzheimer's disease

Affiliations

Systematic characterization of multi-omics landscape between gut microbial metabolites and GPCRome in Alzheimer's disease

Yunguang Qiu et al. Cell Rep. .

Abstract

Shifts in the magnitude and nature of gut microbial metabolites have been implicated in Alzheimer's disease (AD), but the host receptors that sense and respond to these metabolites are largely unknown. Here, we develop a systems biology framework that integrates machine learning and multi-omics to identify molecular relationships of gut microbial metabolites with non-olfactory G-protein-coupled receptors (termed the "GPCRome"). We evaluate 1.09 million metabolite-protein pairs connecting 408 human GPCRs and 335 gut microbial metabolites. Using genetics-derived Mendelian randomization and integrative analyses of human brain transcriptomic and proteomic profiles, we identify orphan GPCRs (i.e., GPR84) as potential drug targets in AD and that triacanthine experimentally activates GPR84. We demonstrate that phenethylamine and agmatine significantly reduce tau hyperphosphorylation (p-tau181 and p-tau205) in AD patient induced pluripotent stem cell-derived neurons. This study demonstrates a systems biology framework to uncover the GPCR targets of human gut microbiota in AD and other complex diseases if broadly applied.

Keywords: AlphaFold2; Alzheimer's disease; CP: Microbiology; CP: Neuroscience; G-protein-coupled receptors; Mendelian randomization; gut microbial metabolite; gut microbiota; machine learning; metabolite-protein interaction; multi-omics; orphan GPCR.


Conflict of interest statement

Declaration of interests J.B.L. has received consulting fees from Vaxxinity and grant support from GE Healthcare and serves on a data safety monitoring board for Eisai.

Figures

Figure 1.
Figure 1.. Schematic of a systems biology framework illustrating associations between gut-microbiota metabolites and GPCRome
(A) Schematic diagram illustrating multi-omics prioritized associations between gut-microbiota metabolites and GPCRome in Alzheimer’s disease (AD). Specifically, AD-related genes, proteins, and microbiota-derived metabolite datasets were compiled from multi-omics data including genome, transcriptome/proteome, metabolome, and interactome. (B) Mendelian randomization (MR) analysis prioritizes AD-related GPCR targets and human gut metabolites. (C) An overall workflow of machine learning (ML)-based systems biology approach. Molecular docking was performed to generate three-dimensional (3D) features of metabolite-GPCR pairs. Metabolites derived from microbiota were docked into predicted pockets of GPCRs. Then, 3D interaction features (e.g., ligand stability, polar and hydrophobic interactions) were input for building ML models. The top-one GPCR-ML model is prioritized as the Extra Trees regressor model. Via the GPCR-ML score, we re-ranked the metabolites against GPCRs. (D) A diagram showing experimental validations for the predicted GPCR-metabolite associations using patient iPSC-derived neuron models. eQTL: expression quantitative trait loci; GWAS: Genome-wide assoication studies.
Figure 2.
Figure 2.. Multi-omics analysis reveals potential therapeutic targets for AD within the GPCRome
(A) AD-related GPCR targets (alzGPCRs) were prioritized by MR analysis. In total, four genomic datasets (Mayo, ROSMAP, Metabrain, and Meta) in human cortex region were used. Meta dataset is a large eQTL meta-analysis dataset collected from a previous study. β >0 indicates that the elevated expression level of GPCRs increases the likelihood of AD; **FDR < 0.05. *p < 0.05. (B) Phylogenetic tree depicting GPCR targets with AD multi-omics evidence across the GPCRome. Each branch in the tree represents one GPCR, labeled with the UniProt protein name. The number of multi-omics evidence is exhibited on the outer stacked bar. GPCRs differentially expressed (DE) in at least one dataset are shown in bold on the tree rim. 3D AlphaFold2 structural models of top four muti-omics prioritized GPCRs (GPR84, GPR34, CXCR4, and CX3CR1) are displayed and highlighted by predicted local distance difference test (pLDDT) score. The gray arrows refer to the multi-omics evidence of the four GPCRs. Regions with pLDDT score >70 indicates confident structures (blue and cyan).
Figure 3.
Figure 3.. ML-based discovery of the gut metabolite-GPCRome
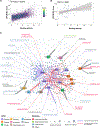
(A) Performance of Extra Trees model on the external test dataset. The dataset was split from the training dataset collected from GPCRdb and GLASS databases. Binding activity and GPCR-ML score of 5,445 unseen metabolite-GPCR pairs were scatter plotted by the point density. (B) Performance of the Extra Trees model on an independent benchmark dataset. This dataset was retrieved from the GPCRdb database and a high-throughput functional screening. Binding activity and GPCR-ML score of 56 experimentally reported metabolite-GPCR pairs are scattered plotted in color blue. Regression of data was predicted by linear regression function. (C) An integrated network illustrates the gut microbiota-derived metabolite-GPCRome interactome. A GPCR-ML score (edge) connecting the top-one ranked metabolite of 369 GPCRs or the top-one predicted GPCRs of 335 metabolites. Metabolite and GPCR are depicted as circle and rectangle nodes, respectively. Hierarchical class of GPCR and chemical class of metabolites are indicated with different colors. The size of the GPCR node is proportional to the number of multi-omics or MR evidence, while the size of the metabolite node is proportional to the number of bacteria strains with higher metabolite abundance (|log2FC| ≥ 2). GPCRs supported by either AD genetics-derived MR or differential expression (DE) in at least 5 brain transcriptomic/proteomic datasets are highlighted in the large rectangle. Meanwhile, metabolites paired with these GPCRs are highlighted. The edge color is displayed in gray unless the metabolites connect with orphan GPCRs (shown in purple) or lipid and lipid-like molecules (shown in red). Some metabolite-GPCR pairs highlighted by thicker edges are discussed in the main text.
Figure 4.
Figure 4.. Human gut metabolite-GPCR associations in AD
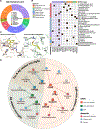
(A) Percentage of gut metabolite-GPCR associations in AD. A total of 220 metabolite-GPCR interaction pairs are classified by the ligand type of GPCRs. (B) Heatmap depicting 31 associations of tier 1 alzGPCRs (evidenced in human AD genetic or at least 5 brain transcriptomic/proteomic datasets). The columns in purple display associations with orphan GPCRs. (C) Binding modes of GALR1 and FPR1 with their top-ranked candidate metabolite, linolenic acid, and 5-phenylvaleric acid, respectively. GALR1 and FPR1 are two GPCRs supported by both human AD genetic and brain transcriptomic/proteomic differential expression evidence. (D) Circos network showing metabolite-GPCR associations in Aβ-related microglia, tau-related microglia, or both (disease-associated microglia vs. homeostasis-associated microglia). 14 pairs between 8 AD-related GPCRs and their top-ranked candidate metabolites are illustrated. The solid or dashed line indicates pairs with top-one ranked GPCRs or top-one ranked metabolites, respectively. GPCRs are colored based on microglia phenotypes. Metabolites are colored by chemical class.
Figure 5.
Figure 5.. Discovery of AD-related gut metabolites binding with alzGPCRs and validation on orphan GPR84
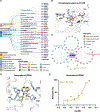
(A) Sankey plot depicting associations between MR-prioritized gut metabolites and alzGPCRs. 24 gut metabolites supported by MR analysis (p < 0.05) on three AD GWAS datasets interact with 32 alzGPCRs. The pairs between 3 specifically prioritized AD-related gut metabolites (HMB, phosphoethanolamine, and glutamine) are highlighted. Aceglutamide paired with GPR84 is also highlighted. The color of metabolites indicates chemical class. The color of alzGPCRs indicates hierarchical class. (B) Binding mode of phosphoethanolamine for PTAFR. (C) Top 50 prioritized gut metabolites for GPR84. Human gut metabolites are circled and colored by their chemical class. (D) Binding mode of triacanthine for GPR84. (E) Dose-dependent response of triacanthine on GPR84 by a cAMP assay (n = 2, STAR Methods). Data shown as mean ± standard deviation (SD). SAH, S-adenosylhomocysteine; HPLA, 2-hydroxy-3-(4-hydroxyphenyl) propanoic acid; HMB, 2-hydroxy-4-(methylthio)butanoic acid.
Figure 6.
Figure 6.. Agmatine reduces expression of C3AR and p-tau in patient iPSC-derived neurons
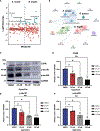
(A) Abundance of gut metabolites from E. rectale and B. fragilis. (B) GPCR-ML-score-predicted associations between gut metabolites (from AD, E. rectale, B. fragilis, and R. gnavus) and alzGPCRs. (C and D) Dose-dependent effect of agmatine on the levels of C3AR confirmed by western blotting (C) and densitometry analysis (normalized with GAPDH) (D). (E and F) Dose-dependent effect of agmatine on the levels of p-tau181 (E) and p-tau205 (F). Quantification data represent mean ± standard deviation (SD) of three independent experiments (n = 3). p values were obtained using one-way ANOVA with Dunnett’s multiple comparison test, ns p > 0.05, *p < 0.05, **p < 0.01, and ***p < 0.001. dUMP, 2′-deoxyuridine 5′-monophosphate; 3-HBA, 3-hydroxybutyric acid.
Figure 7.
Figure 7.. Phenethylamine reduces p-tau in patient iPSC-derived neurons
(A) Binding mode of phenethylamine for GPR153. (B) Dose-dependent effect of phenethylamine on the levels of tau phosphorylation (p-tau181 and p-tau205) confirmed by western blotting. (C and D) Dose-dependent effect of phenethylamine on the levels of p-tau181 (C) and p-tau205 (D) confirmed by densitometry analysis (normalized with GAPDH). Quantification data represent mean ± SD of three independent experiments (n = 3). p values were obtained using one-way ANOVA with Dunnett’s multiple comparison test, ns p > 0.05, *p < 0.05, **p < 0.01, ***p < 0.001, and ****p < 0.0001.

References

    1. Cohen LJ, Esterhazy D, Kim S-H, Lemetre C, Aguilar RR, Gordon EA, Pickard AJ, Cross JR, Emiliano AB, Han SM, et al. (2017). Commensal bacteria make GPCR ligands that mimic human signalling molecules. Nature 549, 48–53. 10.1038/nature23874. - DOI - PMC - PubMed
    1. Pandey S, Maharana J, and Shukla AK (2019). The Gut Feeling: GPCRs Enlighten the Way. Cell Host Microbe 26, 160–162. 10.1016/j.chom.2019.07.018. - DOI - PMC - PubMed
    1. Azam S, Haque ME, Jakaria M, Jo SH, Kim IS, and Choi DK (2020). G-Protein-Coupled Receptors in CNS: A Potential Therapeutic Target for Intervention in Neurodegenerative Disorders and Associated Cognitive Deficits. Cells 9, 506. 10.3390/cells9020506. - DOI - PMC - PubMed
    1. Husted AS, Trauelsen M, Rudenko O, Hjorth SA, and Schwartz TW (2017). GPCR-Mediated Signaling of Metabolites. Cell Metabol. 25, 777–796. 10.1016/j.cmet.2017.03.008. - DOI - PubMed
    1. Wacker D, Stevens RC, and Roth BL (2017). How Ligands Illuminate GPCR Molecular Pharmacology. Cell 170, 414–427. 10.1016/j.cell.2017.07.009. - DOI - PMC - PubMed

Publication types