. 2024 May 9;187(10):2359-2374.e18.
doi: 10.1016/j.cell.2024.03.030. Epub 2024 Apr 22.

BCAA-nitrogen flux in brown fat controls metabolic health independent of thermogenesis

Affiliations

BCAA-nitrogen flux in brown fat controls metabolic health independent of thermogenesis

Anthony R P Verkerke et al. Cell. .

Abstract

Brown adipose tissue (BAT) is best known for thermogenesis. Rodent studies demonstrated that enhanced BAT thermogenesis is tightly associated with increased energy expenditure, reduced body weight, and improved glucose homeostasis. However, human BAT is protective against type 2 diabetes, independent of body weight. The mechanism underlying this dissociation remains unclear. Here, we report that impaired mitochondrial catabolism of branched-chain amino acids (BCAAs) in BAT, by deleting mitochondrial BCAA carriers (MBCs), caused systemic insulin resistance without affecting energy expenditure and body weight. Brown adipocytes catabolized BCAA in the mitochondria as nitrogen donors for the biosynthesis of non-essential amino acids and glutathione. Impaired mitochondrial BCAA-nitrogen flux in BAT resulted in increased oxidative stress, decreased hepatic insulin signaling, and decreased circulating BCAA-derived metabolites. A high-fat diet attenuated BCAA-nitrogen flux and metabolite synthesis in BAT, whereas cold-activated BAT enhanced the synthesis. This work uncovers a metabolite-mediated pathway through which BAT controls metabolic health beyond thermogenesis.

Keywords: amino acid metabolism; bioenergetics; brown adipose tissue; diabetes; glucose homeostasis; insulin resistance; inter-organ communication; mitochondria; thermogenesis.


Conflict of interest statement

Declaration of interests The authors declare no competing interests.

Figures

Figure 1.
Figure 1.. BCAAs are key nitrogen donors in brown adipocytes.
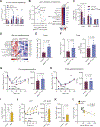
A. Schematic of metabolomics studies in BAT vs. WAT-derived extracellular fluid (EF). B. Relative abundance of indicated metabolites in the EF from wild-type male mouse BAT and epidydimal WAT. Data represented as z-score heatmap for indicated metabolites. N=5 per group. C. The metabolite pathway analysis of BAT-EF enriched metabolites. The node color of each pathway is determined by the P-value, and the node size is based on the pathway impact factor, with the biggest indicating the highest impact. D. Schematic of 15N-BCAA tracing in brown adipocytes (nitrogen: black square, carbon: white circle). E. List of cellular 15N-metabolites derived from transamination of 15N-BCAA. Differentiated brown adipocytes were cultured with 15N-BCAA (1.6 mM each) for 24 hours. Labeling (%) represents M+1. N = 3 per metabolite. F. List of cellular 13C-metabolites derived from 13C-BCAA. Differentiated brown adipocytes were cultured with 13C-BCAA (1.6 mM each) for 2 hours. Labeling (%) represents the fraction of 13C labeling in all isotopomers. N = 3 per metabolite. G. Time course changes in indicated 13C-metabolite abundance in the culture media of brown adipocytes. N = 3 per group per time point. H. Abundance of indicated 13C-metabolites in the culture media and brown adipocytes. Following incubation with 13C-BCAAs, media was collected at 2 hours. N = 3 per group per time point.
Figure 2.
Figure 2.. MBC is required for the synthesis of BCAA-derived metabolites.
A. Total cellular metabolite abundance (M+0 and M+1) in control and MBC KO brown adipocytes incubated with 15N-BCAA at indicated time points. Data represented as z-score heatmap across 1–24 hours for each metabolite, with each cell representing quantitated value for each biological replicate. N = 3 per group per time point. Statistic for A-E: 2-way ANOVA with Šídák’s multiple comparisons test. *P<0.05; **P<0.01; ***P<0.001; ****P<0.0001. B. Labeled metabolites in control and MBC KO brown adipocytes cultured with 15N-BCAA for 24 hours. M+0, M+1, M+2, and M+3 labeled metabolites are relative to control group. N = 3 per group. C. Time course changes in indicated metabolite abundance (M+0 and M+1) in culture media from control or MBC KO brown adipocytes. N = 3 per group per time point. D. Labeled metabolites in control and shRNA-Bcat2 brown adipocytes cultured with 15N-BCAA for 24 hours. M+0, M+1, M+2, and M+3 labeled metabolites are relative to control group. N = 3 per group. E. Labeled metabolites in brown adipocytes under control and BCAT2 inhibitors (Telmisartan and BCAT-IN-2) cultured with 15N-BCAA for 24 hours. N = 3 per group.
Figure 3.
Figure 3.. Mechanisms of mitochondrial BCAA catabolism via MBC.
A. Left: Venn Diagram of the MBC-proteome comparing enriched proteins (≥ 2-fold) from MBC-TurboID with BCAT2-TurboID proximity labeling. Right: MBC proteome correlated between MBC-TurboID and BCAT2-TurboID fold change compared to control. B. Mitochondrial BCAA catabolic protein identified in BCAT2-TurboID and MBC-TurboID brown adipocytes. Data are represented as fold change over empty-vector controls. Undetected proteins are shown in grey. C. Inner mitochondrial membrane proteins identified in MBC-Flag-pulldown and MBC-TurboID experiments. D. OCR of differentiated brown adipocytes in response to BCAA and norepinephrine at indicated time points. N = 5 per group. Statistic: 2-way ANOVA with Dunnett’s multiple comparisons test. E. 15N-BCAA labeled (M+1) metabolites detected in indicate brown adipocytes incubated with 15N-BCAA (1.6 mM) for 24 hours. N = 3 per group. Statistic: one-way ANOVA with Dunnett’s multiple comparisons test.
Figure 4.
Figure 4.. Impaired BCAA flux in BAT causes insulin resistance independent of energy expenditure.
A. Serum BCAA from 4-hour fasted control and MBC-KD male mice fed a high-fat diet. N = 7 per group. B. BCAA tolerance test and area under the curve (AUC) of control and MBC-KD male mice. Changes in blood BCAA levels were measured in fasted mice in response to an oral bolus BCAA challenge (75 mg kg−1). N = 8 control, 5 MBC-KD. C. 15N-BCAA derived Glu, Gln, and Ala in the serum of MBC-KD and control male mice. D. Total glutathione (reduced and oxidized) amount in BAT of control and MBC-KD male mice. N = 8 per group. E. Body mass of control and MBC-KD male mice on a high-fat diet. N = 7 control and 10 for MBC-KD. F. Serum glucose from 4-hour fasted control and MBC-KD male mice fed a high-fat diet. N = 7 per group. G. Glucose tolerance test and AUC of high-fat diet fed control and MBC-KD male mice. Mice were fasted for 4 hours prior to collecting baseline blood glucose measurement and subsequent intraperitoneal injection of glucose (1 g kg−1). N = 5 control mice and 6 for MBC-KD mice. H. Insulin tolerance test and AUC of mice in (G). Mice were fasted for 4 hours prior to intraperitoneal injection of insulin (1 U kg−1). N = 4 control mice and 5 for MBC-KD mice. I. Energy expenditure of control male mice and male mice with brown fat knockout of MBC (MBCUCP1 KO) at indicated temperature. N = 4 control mice and 3 for MBCUCP1 KO mice. J. Body mass of control and MBCUCP1 KO male mice on a high-fat diet. N = 8 per group. K. BCAA tolerance test and AUC of control and MBCUCP1 KO male mice. Changes in blood BCAA levels were measured in fasted mice in response to an oral bolus BCAA challenge (75 g kg−1). N = 5 control mice and 6 for MBCUCP1 KO mice. L. Insulin tolerance test and AUC of control and MBCUCP1 KO male mice. Mice were fasted for 4 hours prior to intraperitoneal injection of insulin (1 U kg−1). N = 14 control mice and 8 for MBCUCP1 KO mice.
Figure 5.
Figure 5.. Reduced glutathione mediates insulin resistance.
A. In vivo insulin stimulation of AKTSer473 phosphorylation in indicated tissues (phospho-AKTSer473 over total-AKT). Male mice were fasted 4 hours prior to insulin injection. N = 6 for both groups. B. Phospho-proteomic analysis of in vivo insulin-stimulated liver tissues in (A). Left: Scattered plot of the analysis with indicated phosphor-proteins. Right: Heat map of averaged phosphor-proteins. N = 6 from control and N = 5 from KO liver, male mice. C. PDH activity in response to insulin in (A). N = 4 per group per each tissue. D. Metabolomics in serum from high-fat diet fed control and MBCUCP1 KO male mice. N = 6 for control and 7 for MBCUCP1 KO. E. Oxidative stress marker protein carbonyl content in the liver from control and MBCUCP1 KO male mice on a high-fat diet. N = 6 per group. F. Abundance of lipid oxidative stress marker malondialdehyde (MDA) content (left) and 4-hydroxylnonenal (4-HNE) content (right) in liver tissue. N = 5 per group for MDA content, N = 6 per group for 4-HNE quantification. G. Insulin tolerance test and AUC of high-fat diet fed control and MBCUCP1 KO male mice prior to glutathione supplementation. Mice were fasted for 4 hours prior to intraperitoneal injection of insulin (1 U kg−1). N = 9 control and 6 for MBCUCP KO mice. H. Insulin tolerance test and AUC of male mice in (G) following 10 days of glutathione supplementation (2 g kg−1). Mice received glutathione supplementation 18 hours prior to insulin tolerance test to limit acute glutathione response. N = 7 control mice and 6 for MBCUCP KO mice. I. Serum GSH levels in wild-type male mice following BSO treatment. N = 9 per group. J. Insulin tolerance test (0.5 U kg−1) in wild-type male mice treated with BSO for 20 days. N = 9 per group. K. Serum BCAA levels in (J). L. Correlation between serum BCAA and serum GSH levels in (J).
Figure 6.
Figure 6.. BCAA catabolism in BAT is coupled with glutathione synthesis.
A. Ex vivo 14C-Leu oxidation in wild-type male mice fed a standard diet or a high-fat diet for 4 and 12 weeks. N = 6 per group. B. Indicated protein abundance in BAT mitochondria of wild-type male mice fed a standard diet or high-fat diet for 8 weeks. Isolated mitochondria were subjected to quantitative proteomics. N = 5 per group. C. Gene ontology of biological processes from all the down-regulated BAT mitochondrial proteins in (B). D. BCAA-linked metabolites in the BAT of wild-type male mice fed a standard diet or a high-fat diet for 12 weeks. N = 6 per group. E. Changes in indicated 15N-labeled metabolites in the BAT of male mice stably infused with 15N-BCAA for 12 hours. N = 4 per group. F. BCAA-linked metabolites in the BAT of wild-type male mice acclimated to 6°C or 30°C for two weeks. N = 10 for mice housed at 6°C and 9 for mice housed at 30°C. G. Representative 18FDG-PET of high BAT (SUV ≥ 2.0) and low BAT (SUV< 2.0) groups. Quantification of BAT activity (SUV) is shown below. N = 26 for high BAT and 7 for low BAT. H. Total glutathione in the serum of subjects at 27°C and after 2 hours of exposure to 19°C in (G). Statistic between 27°C and 19°C is Wilcoxon matched-pairs signed rank test with multiple comparisons corrected by two-stage step up (Benjamini, Krieger, and Yekutieli) method. Statistic comparing high BAT 19°C to low BAT 19°C is Mann Whitney test. I. Correlation between BAT activity (log SUV) and circulating glutathione levels in all the subjects examined in the study (N=33) following cold exposure at 19°C and at 27°C by Spearman correlation two-tailed test.

References

    1. Hawley JA, Hargreaves M, Joyner MJ, and Zierath JR (2014). Integrative biology of exercise. Cell 159, 738–749. 10.1016/j.cell.2014.10.029 - DOI - PubMed
    1. Murphy RM, Watt MJ, and Febbraio MA (2020). Metabolic communication during exercise. Nat Metab 2, 805–816. 10.1038/s42255-020-0258-x - DOI - PubMed
    1. Cannon B, and Nedergaard J. (2004). Brown adipose tissue: function and physiological significance. Physiological reviews 84, 277–359. 10.1152/physrev.00015.2003 - DOI - PubMed
    1. Betz MJ, and Enerback S. (2018). Targeting thermogenesis in brown fat and muscle to treat obesity and metabolic disease. Nat Rev Endocrinol 14, 77–87. 10.1038/nrendo.2017.132 - DOI - PubMed
    1. Becher T, Palanisamy S, Kramer DJ, Eljalby M, Marx SJ, Wibmer AG, Butler SD, Jiang CS, Vaughan R, Schoder H, et al. (2021). Brown adipose tissue is associated with cardiometabolic health. Nature medicine 27, 58–65. 10.1038/s41591-020-1126-7 - DOI - PMC - PubMed

Publication types

LinkOut - more resources