. 2024 Apr 23;15(1):3436.
doi: 10.1038/s41467-024-47752-0.

Nitrogen and Nod factor signaling determine Lotus japonicus root exudate composition and bacterial assembly

Affiliations

Nitrogen and Nod factor signaling determine Lotus japonicus root exudate composition and bacterial assembly

Ke Tao et al. Nat Commun. .

Abstract

Symbiosis with soil-dwelling bacteria that fix atmospheric nitrogen allows legume plants to grow in nitrogen-depleted soil. Symbiosis impacts the assembly of root microbiota, but it is unknown how the interaction between the legume host and rhizobia impacts the remaining microbiota and whether it depends on nitrogen nutrition. Here, we use plant and bacterial mutants to address the role of Nod factor signaling on Lotus japonicus root microbiota assembly. We find that Nod factors are produced by symbionts to activate Nod factor signaling in the host and that this modulates the root exudate profile and the assembly of a symbiotic root microbiota. Lotus plants with different symbiotic abilities, grown in unfertilized or nitrate-supplemented soils, display three nitrogen-dependent nutritional states: starved, symbiotic, or inorganic. We find that root and rhizosphere microbiomes associated with these states differ in composition and connectivity, demonstrating that symbiosis and inorganic nitrogen impact the legume root microbiota differently. Finally, we demonstrate that selected bacterial genera characterizing state-dependent microbiomes have a high level of accurate prediction.


Conflict of interest statement

The authors declare no competing interests.

Figures

Fig. 1
Fig. 1. Wild-type and Nod factor signaling mutants grown in soil show symbiosis-defective phenotypes compensated for by nitrate addition to the soil.
a Experimental design. Shoot fresh weight per plant of wild type, nfre, chit5, and nfr5 grown in unfertilized Cologne soil (b) or soil supplemented with 10 mM KNO3 (c). The number of pink nodules (d) and the total number of nodules (e) per plant of wild type, nfre, and chit5 grown in unfertilized Cologne soil. The total number of nodules (f) per plant of wild type, nfre, and chit5 grown in Cologne soil supplemented with 10 mM KNO3. Each dot represents a value for individual plants. The number of analyzed plants are shown in brackets. The shape of the violins illustrates the density of the data in the analysed samples. Boxplots within the violin plots show the median, 75th percentile, and 25th percentile data sets. Letters within the plots (bf) indicate statistically significant differences (Tukey HSD test, p < 0.05).
Fig. 2
Fig. 2. Nitrate supplementation changes the soil, root, and rhizosphere community structures.
a Alpha diversity by Chao1 index for soil, rhizosphere, and root compartments of Gifu, nfre, chit5, and nfr5. b Constrained PCoAs of rhizosphere and root (c) communities show that Nod factor signaling and nitrate supplementation have a major effect on the associated bacteria. The analysis is constrained by both genotype and nitrate application. d Relative abundance of bacterial families for rhizosphere and root (e) samples. Boxplots of alpha diversity show the median, 75th percentile, and 25th percentile data sets. Asterisks within the alpha diversity plot indicate statistically significant differences between the two genotypes (Mann–Whitney U test, p < 0.05, n = 3 biological samples each analysed in 3 technical replica for unfertilized condition, n = 3 biological samples analysed in 2 technical replica for 10 mM KNO3 fertilized condition). Columns indicate the replica and colors indicate the taxonomic assignment.
Fig. 3
Fig. 3. Nod factor signaling contributes to root-associated microbiota of Lotus plants grown in unfertilized Cologne soil.
a Constrained PCoA of communities associated with roots of wild-type, nfr5, nfre, and chit5. b Cumulative relative abundance of selected ASVs (RA > 0.3% in roots of Gifu) in soil and roots of the four genotypes. c The ratio of RA between Gifu and mutants of the top three taxa in the roots based on selected ASVs: RA > 0.3% in roots of Gifu. d Distinct ASVs have a significantly different RA in mutant roots compared to wild-type Gifu. Selected ASVs are presented in a phylogenetic tree constructed on the basis of 16S rRNA V5–V7 region. The taxonomic information is shown by color on the name of the ASV (order) and by color on the tree branch (family). The heatmap shows the log2-transformed RA of each ASVs in the roots of Gifu, nfre, chit5, and nfr5 plants. Triangles on the outer layer of the heatmap point out ASVs that have a significantly different abundance compared to wild-type plants.
Fig. 4
Fig. 4. Nitrogen nutritional status and source drive distinct correlation networks between ASVs into the rhizosphere and roots of Lotus.
Correlation networks of ASVs in the rhizosphere (a) and root (b) compartments of plants supplemented with sources of either inorganic nitrogen (a1, b1) or symbiotic nitrogen (a2, b2) or starved (a3, b3) status. Only positive correlations are marked out by red lines between nodes on the networks. The nodes of the networks are colored by modularity class. Each node represents an ASV, and the size of the node is given by its degree (the degree of a node refers to the number of other nodes it is connected to). The modularity classes are denoted M1, M2, M3, M4, M5, and M6, and the numbers of ASVs in each module are shown in brackets. For each module, the proportion of ASVs at the taxonomic order level is shown by donut plots. The main taxonomic genus in each modularity is pointed out by text on the donuts (a1, b1) or dots below the modularity (a2, a3, b2, b3). The color of the dots represents the taxonomic order. The size of the dots represents the percentage of ASVs in the module.
Fig. 5
Fig. 5. Specific bacterial taxa enriched in the three nutritional statuses are identified as predictors with high accuracy.
Ternary plots illustrating the RA of all ASVs identified in the rhizosphere (a) or root (b) compartments of nitrogen-replete (inorganic nitrate- KNO3 or symbiotic nitrogen) or -depleted (starved) samples. Starved conditions are represented by the nfr5 and chit5 grown in unfertilized Cologne soil, symbiotic nitrogen conditions are represented by the wild type and nfre grown in unfertilized Cologne soil, and inorganic-nitrogen conditions are represented by all genotypes grown in nitrate-supplemented Cologne soil. The ASVs are presented by dots; the size of the dots is determined by the mean RA across all three conditions in the ternary plots. The position of the dots in the ternary plot is determined by the mean RA of the ASVs within the three states. Green ASVs are enriched in symbiotic nitrogen condition, blue in starved condition, and pink in inorganic-nitrogen condition. The numbers of enriched ASVs are marked at the corners. Pie charts show the order-level taxonomic composition of the enriched ASVs. c Scheme of the process to identify predictor taxa in the rhizosphere and d root. The triangle in the scheme is a simplified symbol of the ternary plot in (a) and (b). Pink indicates inorganic-nitrogen conditions, green indicates symbiotic nitrogen conditions, and blue indicates nitrogen-starved conditions. Numbers in the circles indicate the number of enriched (upwards) or depleted (downwards) bacterial genera. The tables display the confusion matrices.
Fig. 6
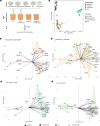
Fig. 6. Nod factor-producing symbiont structures Lotus root-associated microbiota composition.
a Experiment design. b PCoA analysis based on Bray-Curtis distances on all samples. Principal component analysis biplot of ASVs on rhizosphere (c, d) and root samples (e, f) from plants grown in the absence (c, e) or presence of KNO3 (d, f). ASVs in each sample are shown as variables. The arrows point out which condition is driven by the variable. The PCA plots are shown by the first and second dimensions.
Fig. 7
Fig. 7. Distinct metabolites are identified in Lotus root exudates grown in symbiotic, starved, or inorganic-nitrogen conditions.
a PCA analysis of the chemical features identified in root exudates; the nitrogen nutritional status of samples is marked by colors. b Barplot illustrates the absolute abundance of chemical features in each of the nutritional status. The mean intensity of chemical features within samples is shown. c Boxplot shows the abundance of metabolite intensity within the individual pathway (median, 75th percentile, and 25th percentile), and statistical analysis is conducted within the individual pathway (p < 0.05, n = 6 biologically independent samples). d Ternary plot illustrates statistically enriched features in the three nitrogen nutritional status, donut plots at each corner of the triangle show the composition of metabolite intensity at the pathway level. e Heatmap shows enriched chemical compounds identified according to the nitrogen nutritional status. The chemical compound intensity in each of the samples is illustrated by color intensity.
Fig. 8
Fig. 8. Nitrogen nutrition and signaling during root nodule symbiosis impact the community assemblies.
Lotus plants grown in the presence of inorganic nitrogen secrete specific metabolites and assemble a microbial community with low connectivity. Lotus plants grown in symbiosis-permissive conditions secrete metabolites such as flavonoids (1) that induce Nod factor production in compatible nitrogen-fixing Rhizobium isolates (2). Nod factors are recognized by the Lotus host which initiates a signaling pathway (3) to accommodate the symbiont. Symbiotically active roots have an exudate profile (4) and associated microbial communities that differ from plants grown in the presence of inorganic nitrogen. It remains to be determined how bacterial communities associated with symbiotically active plants impact the host to promote the symbiotic association and plant growth (5).

References

    1. Lundberg DS, et al. Defining the core Arabidopsis thaliana root microbiome. Nature. 2012;488:86–90. doi: 10.1038/nature11237. - DOI - PMC - PubMed
    1. Bulgarelli D, et al. Revealing structure and assembly cues for Arabidopsis root-inhabiting bacterial microbiota. Nature. 2012;488:91–95. doi: 10.1038/nature11336. - DOI - PubMed
    1. Bai Y, et al. Functional overlap of the Arabidopsis leaf and root microbiota. Nature. 2015;528:364–369. doi: 10.1038/nature16192. - DOI - PubMed
    1. Bulgarelli D, et al. Structure and functions of the bacterial microbiota of plants. Annu. Rev. Plant. Biol. 2013;64:807–838. doi: 10.1146/annurev-arplant-050312-120106. - DOI - PubMed
    1. Zgadzaj R, et al. A legume genetic framework controls infection of nodules by symbiotic and endophytic bacteria. PLoS Genet. 2015;11:e1005280. doi: 10.1371/journal.pgen.1005280. - DOI - PMC - PubMed

Publication types