. 2024 Apr 23;15(1):3432.
doi: 10.1038/s41467-024-47166-y.

Lineage specific transcription factor waves reprogram neuroblastoma from self-renewal to differentiation

Affiliations

Lineage specific transcription factor waves reprogram neuroblastoma from self-renewal to differentiation

Deblina Banerjee et al. Nat Commun. .

Abstract

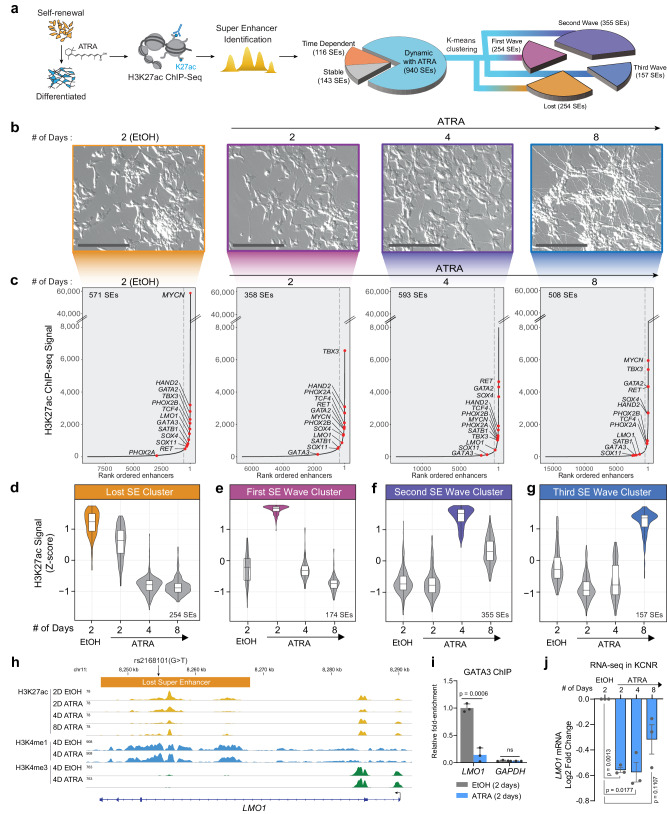
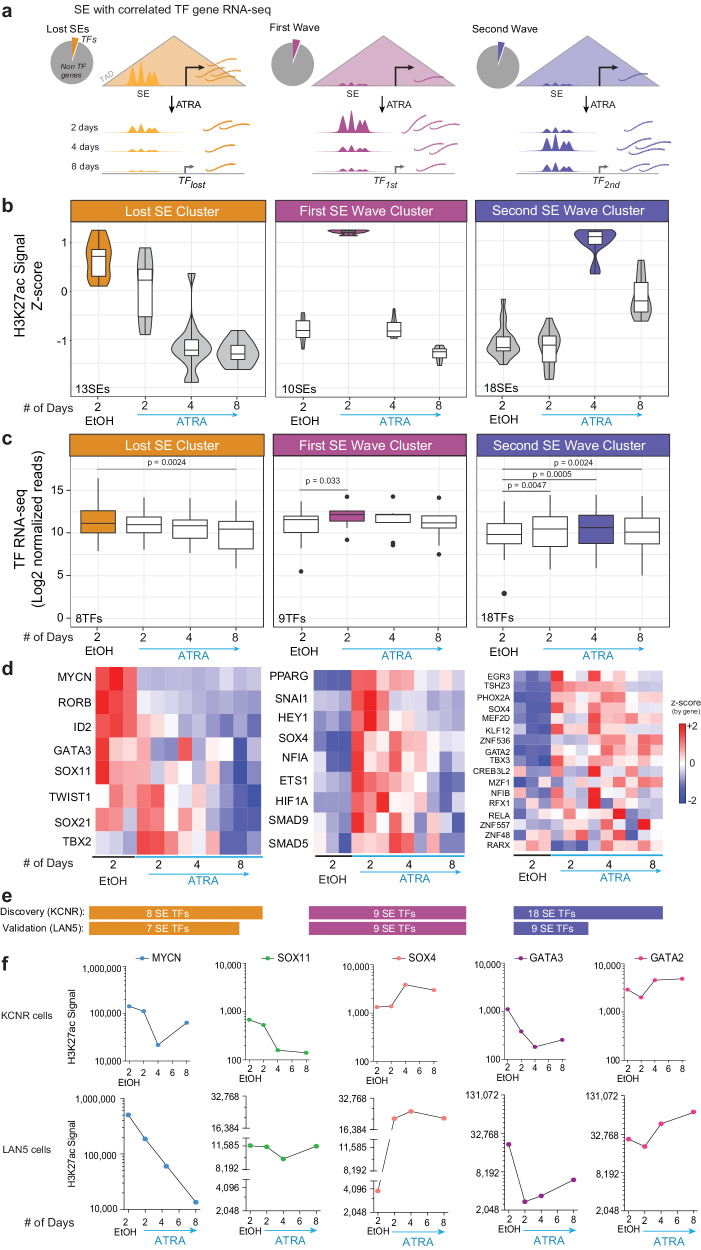
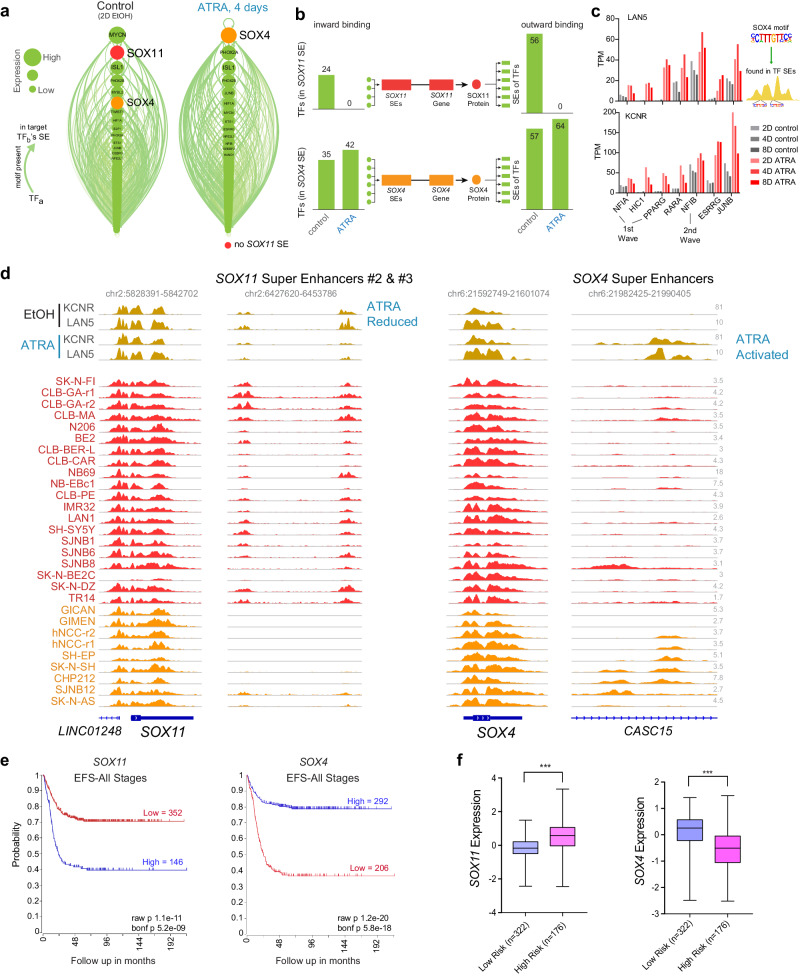
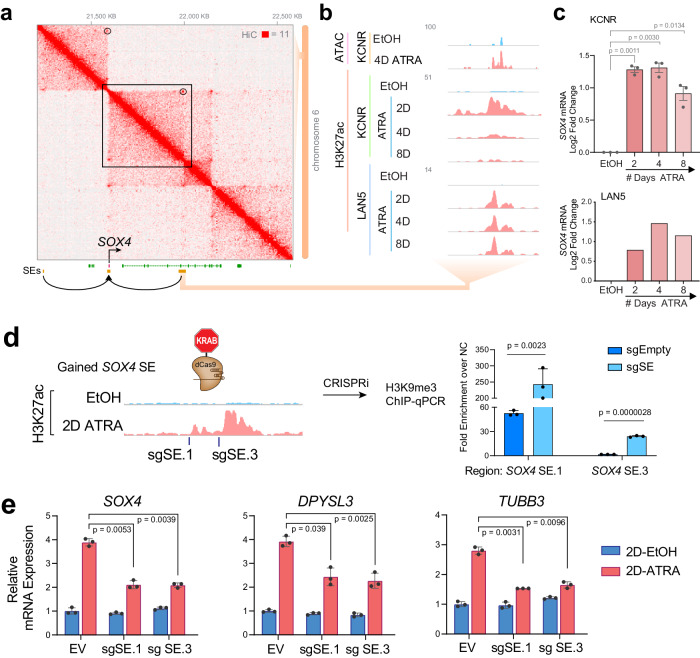
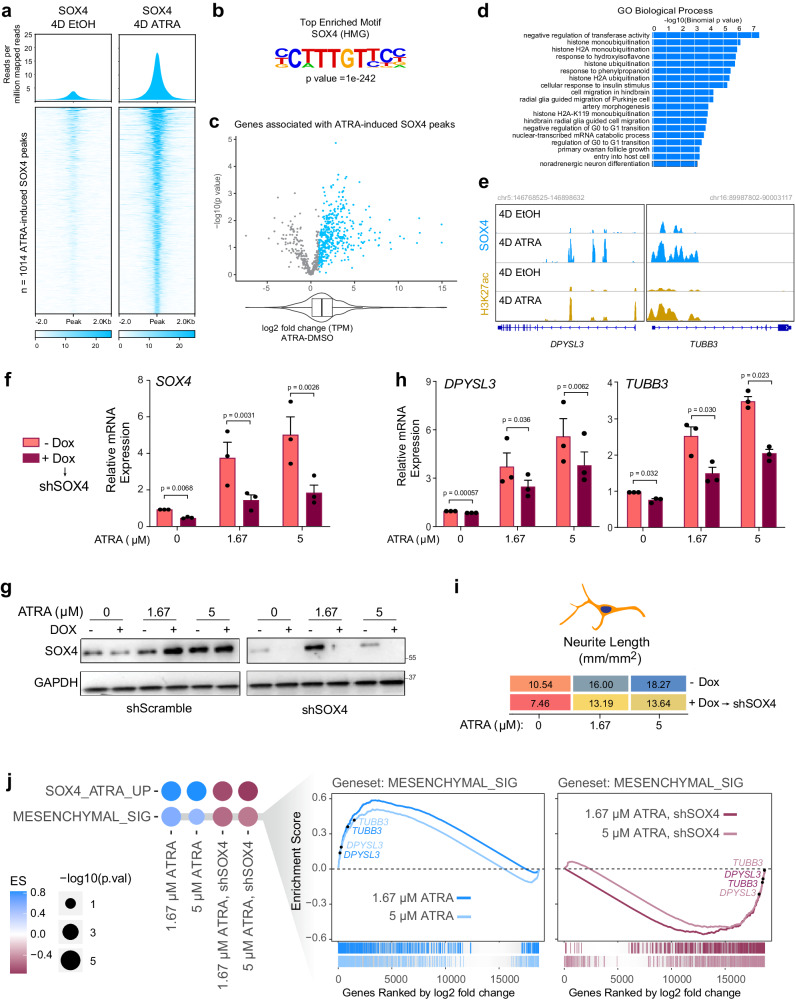
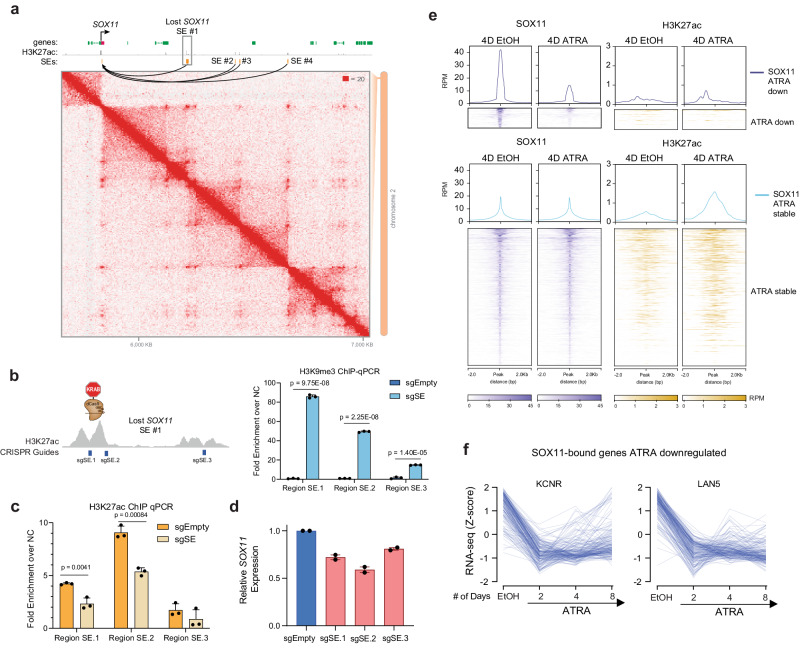
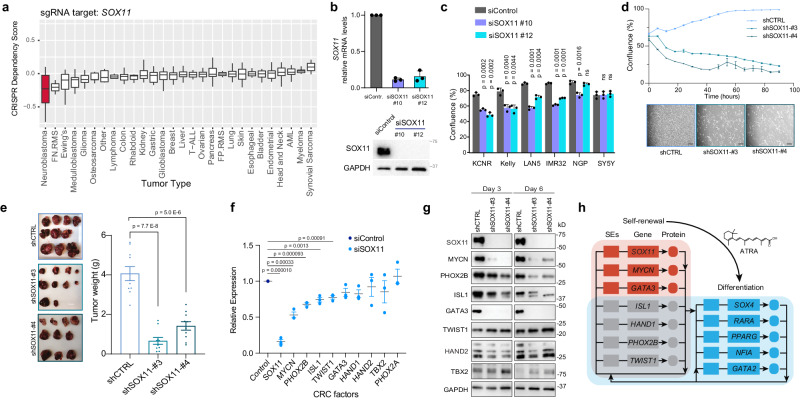
Temporal regulation of super-enhancer (SE) driven transcription factors (TFs) underlies normal developmental programs. Neuroblastoma (NB) arises from an inability of sympathoadrenal progenitors to exit a self-renewal program and terminally differentiate. To identify SEs driving TF regulators, we use all-trans retinoic acid (ATRA) to induce NB growth arrest and differentiation. Time-course H3K27ac ChIP-seq and RNA-seq reveal ATRA coordinated SE waves. SEs that decrease with ATRA link to stem cell development (MYCN, GATA3, SOX11). CRISPR-Cas9 and siRNA verify SOX11 dependency, in vitro and in vivo. Silencing the SOX11 SE using dCAS9-KRAB decreases SOX11 mRNA and inhibits cell growth. Other TFs activate in sequential waves at 2, 4 and 8 days of ATRA treatment that regulate neural development (GATA2 and SOX4). Silencing the gained SOX4 SE using dCAS9-KRAB decreases SOX4 expression and attenuates ATRA-induced differentiation genes. Our study identifies oncogenic lineage drivers of NB self-renewal and TFs critical for implementing a differentiation program.


Conflict of interest statement

The authors declare no competing interests.

Figures

Fig. 1
Fig. 1. ATRA treatment of NB cells reveals a dynamic change in the super-enhancer (SE) landscape.
a Schematic representation of the study design and step-by-step approach to identify SEs and downstream clusters after ATRA treatment. SEs were divided into subgroups: Stable with ATRA: SD <30% over 2, 4, and 8 days of ATRA treatment; Time Dependent: - Max variance <200 H3K27Ac signal in control (EtOH) and ATRA conditions. The remaining SEs were defined as Dynamic with ATRA and subjected to K-means clustering to identify temporal pattern. Four clusters of SEs were identified. b Images of NB cells showing the time-dependent effect of 5 µM ATRA treatment on cell morphology, representative of biological triplicate experiments. Scale bars are 200 µM. c H3K27ac binding at super-enhancers ranked by increasing signal. SEs were identified beyond the inflection point of increasing H3K27ac load (indicated by a gray dashed line). Select SE target genes are highlighted. The SEs were linked to putative target genes by proximity to expressed genes. dg Violin plot showing the four clusters of SEs identified by z-score normalized H3K27ac signal. The bar on the right shows the number of SEs in that cluster. d A group of n = 254 SEs is highly active in the control or self-renewing cells and is gradually lost in the ATRA-treated differentiated cells. e A group of n = 174 SEs is specifically activated 2 Days after ATRA treatment. f A group of n = 355 SEs is specifically activated 4 Days after ATRA treatment. g A group of n = 157 SEs is specifically activated 8 Days after ATRA treatment. Box plots show the median with quartiles, whiskers show the 1.5 × interquartile range in the data, are from a single ChIP-seq experiment per time point, and are overlaid with the distribution shown as a violin plot. h Representative ChIP-Seq tracks for H3K27ac, H3K4me1, and H3K4me3 in EtOH and ATRA-treated cells in KCNR cells, showing loss of LMO1 SE after ATRA treatment harboring the protective rs2168101(G > T) SNP. i Bar graph of GATA3 ChIP-qPCR showing a relative decrease in GATA3 binding at specific LMO1 SE region following 4 days of ATRA treatment. P values were calculated with an unpaired, two-tailed t-test. Bars show the mean, with error bars representing the standard deviation. Source data are provided as a Source Data file. j Bar graph showing a relative decrease in LMO1 mRNA expression. P values were calculated with a paired two-sided student’s t-test. Bars show the mean, with error bars representing the standard error of measurement. Source data are provided as a Source Data file.
Fig. 2
Fig. 2. SE-driven transcription factors drive the proliferation and differentiation of neuroblastoma cells.
a A schematic representation of the analysis steps following SEs identification in each cluster. As TFs drive the core regulatory circuitry of a cell, analysis was further restricted to SEs linked only to TFs (Pie charts), and their expression was evaluated at the mRNA level. b Violin plot showing the four clusters of SEs driving TFs (r2 ≥ 0.45) normalized by z-score of H3K27ac signal. The lost cluster consists of 13 SEs, the first wave cluster has 10 SEs, and the second wave cluster consists of 18 SEs. Data were from a single ChIP-seq experiment per time point. Box plots overlapping the violin plot depict the center line = median, box bounds = quartiles, whiskers = 1.5*interquartile range. c Box plots showing expression of the TFs driven by the SEs in each cluster. The 13 SEs in the lost cluster drives eight TFs where the loss in SE signal leads to a significant decrease in the expression of the corresponding TFs after 8 days of ATRA treatment. Similarly, gain in 10 SEs in the first wave cluster significantly increased expression of its downstream 9 TFs after 2 days and 4 days of ATRA treatment. And 18 SEs gained in the second wave led to significant gain in the expression of the downstream 18 TFs. P values were calculated with a paired, two-tailed t-test. Box plots depict the center line = median, box bounds = quartiles, and whiskers = 1.5*interquartile range. d Heatmap showing expression of individual TFs in each cluster in controls and after 2, 4, and 8 days of ATRA treatment in three biological replicates for each condition. Source data are provided as a Source Data file. e Number of SE-regulated TFs discovered in KCNR and validated in LAN5. f Line graph showing dynamic changes at specific SE with ATRA treatment in KCNR and LAN5 cells. H3K27ac signal at the SE associated with MYCN, SOX11, and GATA3 is decreased, whereas the signal at SOX4 and GATA2 are increased. ChIP-seq signal is normalized as reads per million mapped reads (RPM) summed over the entire SE region.
Fig. 3
Fig. 3. Switching of lineage-specific transcription factors induces differentiation in NB cells.
a LEAF (Linked Enhancer-Activated Factors) plots of CRC linked by motif presence in their active enhancers, with nodes ranked by mRNA expression in descending order, in controls (EtOH treated), and 4 days of ATRA treatment. b Inward binding of NB TFs in SOX4 and SOX11 SEs (left) and outward binding in all TF proximal SEs (right) before and after ATRA treatment. Data were from day 4 in KCNR cells and is similar to connectivity at day 2, and is similar to observed changes in LAN5 cells. c Bar graph showing an increase in expression of the seven transcription factors that gain SOX4 inward binding after ATRA treatment. d ChIP-seq track of H3K27ac in ATRA-treated KCNR and LAN5 cells (top, gold), compared to group state epigenomics of H3K27ac in other Adrenergic NB cell lines and primary tumors (middle, red) and Mesenchymal NB cell lines and tumors (bottom, orange) at both SOX11 with one of its SEs, and SOX4 with its SE. e Kaplan–Meier plots based on the expression of SOX11 (left panel) and SOX4 (right panel) in tumors from NB patients at all stages (R2 database: SEQC dataset). P values were calculated with a log-rank test, with Bonferroni correction. f RNA expression of SOX11 and SOX4 among low and high-risk NB patients. ***P < 0.0001, two-sided students t-test with Welch’s correction. Data from R2 database: SEQC dataset. Box plots show a median with quartiles, and whiskers show the 1.5 × interquartile range.
Fig. 4
Fig. 4. SOX4 silencing leads to inhibition of RA-mediated differentiation of KCNR cells.
a Hi-C contact profile surrounding SOX4 locus in KCNR cells with gained SEs shown in both adjacent TADs. b Zoom in on the SE gained, intronic to CASC15. Representative ATAC-seq and ChIP-Seq tracks for H3K27ac in control (EtOH: blue) and ATRA-treated cells (pink), showing an increase in H3K27ac peaks at SOX4 SE in KCNR and LAN5 cells. c Bar graph showing relative mRNA levels (as normalized reads) of SOX4 after ATRA treatment in KCNR and LAN5 cells. A log2-fold change increase in SOX4 expression was observed post-ATRA treatment. In KCNR, data were means ± SD for n = 3 replicates; P values were generated from paired t-test with Welch’s correction. d Guided suppression of the gained SOX4 SE. Bar graph of H3K9me3 ChIP-qPCR showing increased H3K9me3 at specific gained SOX4 SE regions following CRISPR-dCas9-KRAB targeting of SOX4 SE. sgRNAs targeting SOX4 SEs were compared to empty vector (sgEmpty) and were performed in KCNR cells. P values were generated from paired t-test with Welch’s correction across n = 3 replicates. Bars show the mean, with error bars showing the standard deviation. Source data are provided as a Source Data file. e Bar graph showing suppressed SOX4 (left panel), DPYSL3 (middle panel) and TUBB3 (right panel) mRNA induction following CRISPR-dCas9-KRAB targeting of SOX4 SE. sgRNAs targeting SOX4 SEs were introduced into KCNR cells treated with control or ATRA for 2 days. EV empty vector. P values were generated from paired t-test with Welch’s correction across n = 3 replicates. Bars show the mean with error bars showing SEM. Source data are provided as a Source Data file.
Fig. 5
Fig. 5. ATRA-mediated differentiation leads to enhanced SOX4 binding on differentiation genes.
a SOX4 Cut and Run analyses showing an increase in SOX4 genome-wide binding after 4 days of ATRA treatment. Upper panel: Composite plots showing SOX4 signal intensities (reads per million mapped reads) at SOX4 high confidence peaks (n = 1014) in 4D EtOH (left) and 4D ATRA (right) treated cells. Lower panel: Heatmaps of SOX4 peak intensity at SOX4 high confidence peaks (n = 1014). Each row represents a genomic location and is centered around SOX4 peaks, extended 2 kb in each direction, and sorted by SOX4 signal strength. b Hypergeometric Optimization of Motif Enrichment (HOMER) analysis identified SOX4 binding motifs at SOX4 peaks using the HOMER package (homer.salk.edu/homer/ngs/peakMotifs.html). p statistic is calculated using the HOMER statistical comparison against size-matched DNA sequences from randomly selected background genomic sequences. c Volcano plot of log2 fold change (L2FC) of genes associated with ATRA-induced SOX4 peaks in KCNR cells. The box plot underneath and the overlapping violin plot depict the center line = median, box bounds = quartiles, and whiskers = 1.5*interquartile range. P values were calculated using the Wald test with Deseq2 across three biologically independent experiments. d Gene ontology terms associated with genes found using GREAT analysis (great.stanford.edu) on SOX4 constituent peaks. e Tracks showing an increase in SOX4 (blue) and H3K27ac (yellow) peaks after ATRA treatment at DPYSL3 and TUBB3 locus in KCNR cells. f qRT-PCR analysis showing relative mRNA levels of SOX4 (left) after doxycycline-induced inhibition. 50% inhibition of SOX4 mRNA was obtained after doxycycline treatment. The ATRA-mediated increase in SOX4 levels were also reduced ~60–70% on doxycycline treatment. P value were calculated using a paired ratio t-test across n = 3 replicates. Bars show the mean, error bars represent the standard error of measurement. g Western blots showing DOX-induced downregulation of SOX4 (via shRNA SOX4, right) during ATRA-induced expression of SOX4 (with shRNA scramble control on the left). Data were representative of n = 2 biological replicates. h SOX4 reduction slowed ATRA-induced activation of differentiation marker genes DPYSL3 (left panel) and TUBB3 (right panel). P value were calculated using a paired ratio t-test across n = 3 replicates. Bars show the mean, error bars represent the standard error of measurement. i Heatmap showing differentiation index as measured by neurite length. SOX4 silencing reduced ATRA-mediated differentiation of KCNR cells. j GSEA showing inhibition of ATRA-mediated mesenchymal signature upon silencing of SOX4.
Fig. 6
Fig. 6. SOX11 expression is regulated by SEs in NB cells.
a Hi-C contact map surrounding SOX11 locus in KCNR cells. Two lost SEs connected to the SOX11 TSS are highlighted, with the SOX11 gene and the largest lost SE (#1) labeled. b Left panel: Guided suppression of the lost SOX11 SE. Right panel: Bar graph of H3K9me3 ChIP-qPCR showing the mean relative increase in H3K9me3 peaks at specific SOX11 SE regions following CRISPR-dCas9-KRAB targeting, compared to empty vector (sgEmpty) in KCNR cells. P values were generated from paired t-test across n = 3 replicates. Bars show the mean, error bars represent the standard deviation. c Bar graph of H3K27ac ChIP-qPCR showing a relative decrease in H3K27ac at specific SOX11 SE region following CRISPR-dCas9-KRAB targeting. sgRNAs targeting SOX4 SEs led to a significant decrease in H3K27ac peaks compared to empty vector (EV) in KCNR cells. P values were generated from paired t-test across n = 3 replicates. Bars show the mean, error bars represent the standard deviation. d SOX11 mRNA levels (measured by RT-qPCR) decreased upon CRISPR-dCas9-KRAB mediated repression of SOX11 SEs in KCNR cells. Bars show the mean, error bars represent the standard deviation of n = 2 biological replicates. e Upper panel: Composite plots showing SOX11 (left) and H3K27ac (right) signal intensities (reads per million mapped reads) at SOX11 high confidence peaks in 4D EtOH (left) and 4D ATRA (right) treated cells. Middle and Lower panel: Heatmaps of SOX11 and H3K27ac peak intensity at SOX11 high confidence peaks. Each row represents a genomic location and is centered around SOX11 peaks, extended 2 kb in each direction, and sorted by SOX11 signal strength. f Line graph showing a decrease in expression of genes bound by SOX11 following 2, 4, and 8 days of ATRA treatment.
Fig. 7
Fig. 7. SOX11 drives cell growth and proliferation of neuroblastoma cells.
a Bar graph showing the dependency of different cancer cells -on SOX11 for cell growth and proliferation. NB cells are most preferentially dependent on SOX11 for growth and proliferation compared to other tumor types. Data mined from Project Achilles genome-wide CRISPR-Cas9 screen. The number of cell lines in each tumor type are listed in Supplementary Dataset 9. Box plots show a median with quartiles, and whiskers show the 1.5 × interquartile range. b Upper panel: qRT-PCR analysis showing relative mRNA levels of the SOX11 after silencing for 48 h. Bars show the mean ± SEM of three replicates. Lower panel: The western blot shows inhibition of SOX11 at the protein level. c Multiple NB cells demonstrate significantly decreased cell growth after siRNA-mediated silencing of SOX11. Graph showing representative data from n = 3 biological replicates. P values were calculated with an unpaired, two-sided student’s t-test across three technical replicates. Bars show the mean, with error bars representing the standard deviation. d Upper panel: Line graph showing decreased cell growth after shRNA-mediated genetic inhibition of SOX11 (shSOX11#3 and shSOX11#4) in KCNR cells. Data were presented as the mean with error bars showing the standard deviation. Lower panel: Representative images of KCNR cells following genetic silencing either with control (shCTRL) or SOX11 specific shRNA (shSOX11#3 and shSOX11#4) at the 48 h time point. Scale bars are 200 µM. e Representative mouse tumor (left panel) and a bar graph (right panel) showing a significant decrease in tumor volume (weight) following shRNA-mediated genetic inhibition of SOX11. P values were calculated with an unpaired, two-sided student’s t-test with Welch’s correction. Bars show the mean, with error bars representing the standard deviation. f RT-qPCR analysis showing relative mRNA levels of known NB regulatory TFs after silencing of SOX11 for 48 h. Graph showing representative data from three biological replicates. P values were calculated with an unpaired, two-sided student’s t-test with Welch’s correction. The center line shows the mean, with error bars representing the standard deviation. g Western blot analysis showing protein levels of known NB regulatory TFs after 3 and 6 days of genetic inhibition of SOX11. h Model of CRC network swapping during ATRA-induced differentiation of NB. Genes highlighted were those which were consistently called in KCNR and LAN5 cells, both by enhancer analysis and gene expression changes. Lines represent inferred or verified binding by ChIP-seq, and do not necessarily indicate that such SE binding is an essential positive regulation event.

References

    1. Maris JM. Recent advances in neuroblastoma. N. Engl. J. Med. 2010;362:2202–2211. doi: 10.1056/NEJMra0804577. - DOI - PMC - PubMed
    1. Gryder, B., Scacheri, P. C., Ried, T. & Khan, J. Chromatin mechanisms driving cancer. Cold Spring Harb. Perspect. Biol. 10.1101/cshperspect.a040956 (2021). - PMC - PubMed
    1. Koche RP, et al. Extrachromosomal circular DNA drives oncogenic genome remodeling in neuroblastoma. Nat. Genet. 2020;52:29–34. doi: 10.1038/s41588-019-0547-z. - DOI - PMC - PubMed
    1. Guo X, Chen QR, Song YK, Wei JS, Khan J. Exon array analysis reveals neuroblastoma tumors have distinct alternative splicing patterns according to stage and MYCN amplification status. BMC Med. Genomics. 2011;4:35. doi: 10.1186/1755-8794-4-35. - DOI - PMC - PubMed
    1. Maris JM. The biologic basis for neuroblastoma heterogeneity and risk stratification. Curr. Opin. Pediatr. 2005;17:7–13. doi: 10.1097/01.mop.0000150631.60571.89. - DOI - PubMed

Publication types

MeSH terms