. 2024 Apr 23;15(1):3422.
doi: 10.1038/s41467-024-47771-x.

Targeting NRAS via miR-1304-5p or farnesyltransferase inhibition confers sensitivity to ALK inhibitors in ALK-mutant neuroblastoma

Affiliations

Targeting NRAS via miR-1304-5p or farnesyltransferase inhibition confers sensitivity to ALK inhibitors in ALK-mutant neuroblastoma

Perla Pucci et al. Nat Commun. .

Abstract

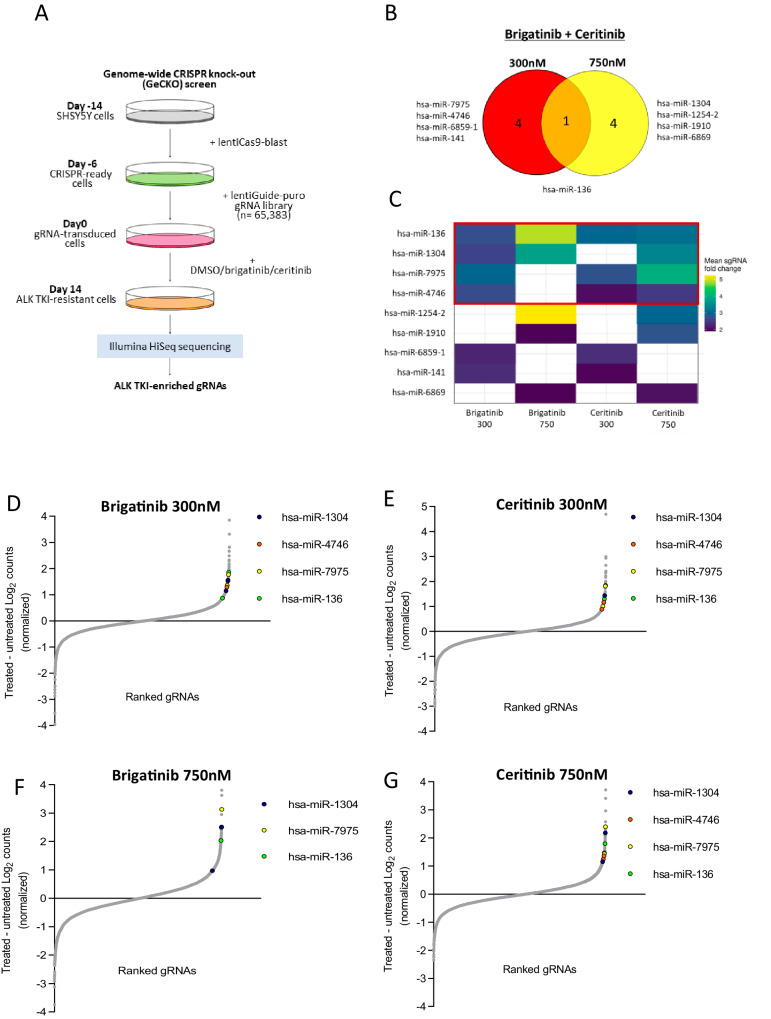
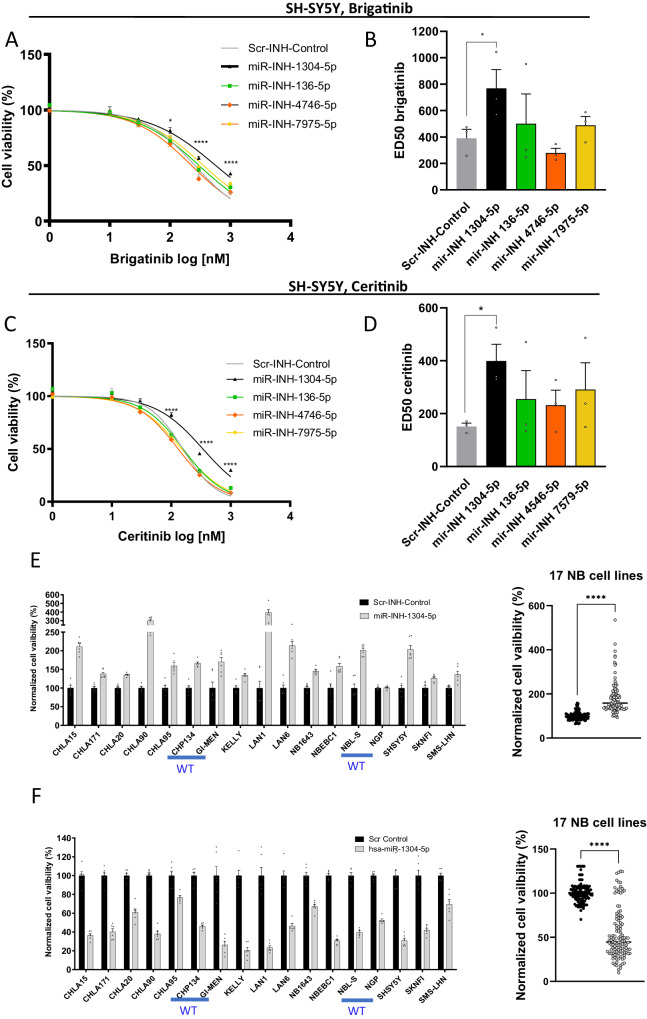
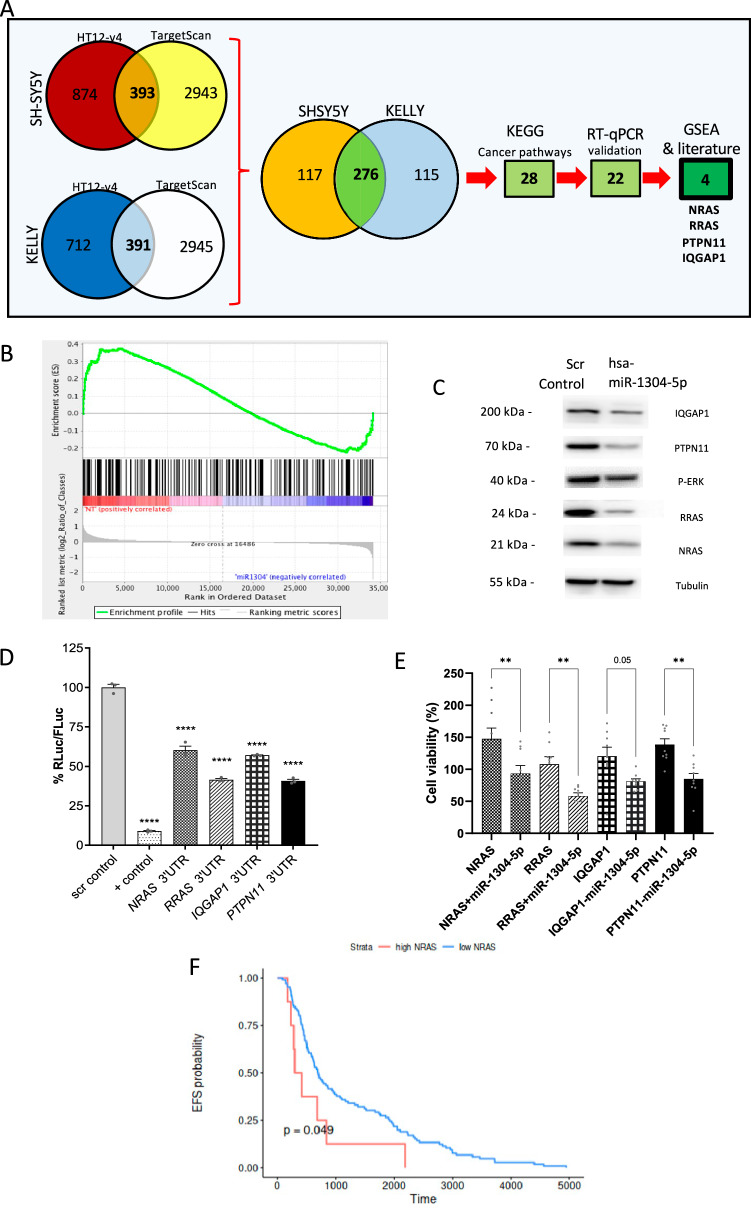
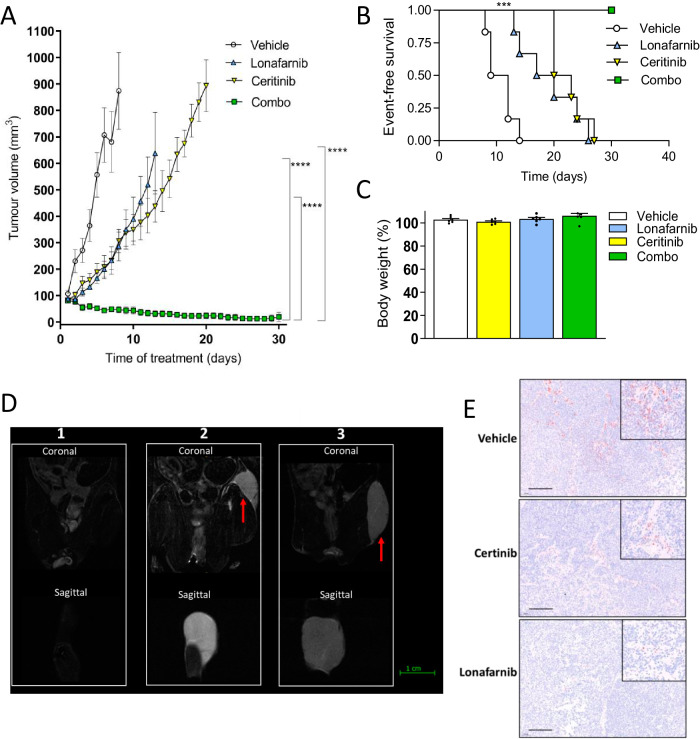
Targeting Anaplastic lymphoma kinase (ALK) is a promising therapeutic strategy for aberrant ALK-expressing malignancies including neuroblastoma, but resistance to ALK tyrosine kinase inhibitors (ALK TKI) is a distinct possibility necessitating drug combination therapeutic approaches. Using high-throughput, genome-wide CRISPR-Cas9 knockout screens, we identify miR-1304-5p loss as a desensitizer to ALK TKIs in aberrant ALK-expressing neuroblastoma; inhibition of miR-1304-5p decreases, while mimics of this miRNA increase the sensitivity of neuroblastoma cells to ALK TKIs. We show that miR-1304-5p targets NRAS, decreasing cell viability via induction of apoptosis. It follows that the farnesyltransferase inhibitor (FTI) lonafarnib in addition to ALK TKIs act synergistically in neuroblastoma, inducing apoptosis in vitro. In particular, on combined treatment of neuroblastoma patient derived xenografts with an FTI and an ALK TKI complete regression of tumour growth is observed although tumours rapidly regrow on cessation of therapy. Overall, our data suggests that combined use of ALK TKIs and FTIs, constitutes a therapeutic approach to treat high risk neuroblastoma although prolonged therapy is likely required to prevent relapse.


Conflict of interest statement

G.A.A.B. has received institutional consultancy fees from Roche, Takeda, Novartis, and Janssen. All other authors have no conflicts of interest to declare.

Figures

Fig. 1
Fig. 1. A GeCKO screen conducted in SH-SY5Y NB cells identifies genes that following CRISPR cas9-induced excision, alter sensitivity to ALK TKIs.
A Experimental schema of the CRISPR GeCKO screen conducted on SH-SY5Y cells stably expressing Cas9 and transduced with the GeCKO Version 2 sgRNA library before incubation with the indicated ALK inhibitors, followed by high throughput sequencing. B Venn diagram of miRNA genes identified by the CRISPR GeCKO screens, whose loss of expression desensitizes SH-SY5Y cells to brigatinib and ceritinib (at 300 nM and/or 750 nM concentrations of each drug). C Heatmap of miRNA hits identified in both brigatinib and ceritinib screens (at 300 nM and/or 750 nM of each drug) showing the top 4 miRNAs that were identified in ≥3 screens (in the red square). Colored squares represent the mean values of fold changes (ALKI TKI versus DMSO treated) of the selected sgRNAs, from lower (blue) to higher (yellow) fold changes. DG gRNAs ranked by fold-change vs difference in log2 normalized read counts between DMSO and ALK TKI-treated SH-SY5Y cells. Only miRNA sgRNAs common to brigatinib and ceritinib treatments in at least three GeCKO screens are shown (has-miR-1304, has-miR-136, hsa-miR-7975, has-miR-4746). Source data are provided in a Source Data file.
Fig. 2
Fig. 2. miR-1304 inhibition affects viability of a range of NB cell lines and decreases sensitivity of ALK mutant NB cells to brigatinib and ceritinib.
AD SH-SY5Y cell viability and ALK TKI ED50s, 5 days post transfection of the indicated miRNA inhibitors followed by 72 h exposure to either brigatinib (A, B) or ceritinib (C, D). All results are normalized to the viability of the untreated (DMSO) control for each miRNA inhibitor treatment conducted. ED50s were calculated using a non-linear regression curve. Results are shown as means ± SEM from three biological replicates each conducted with technical triplicates. Statistical comparison was conducted using a two-tailed Student’s t test of the means of three biological replicates in B, D; B *p = 0.037, D *p = 0.019. E, F Cell viability 72 h following transfection with E the miR-1304-5p inhibitor or F a miR-1305-5p mimic in a panel of 17 NB cell lines. ALK WT cells are highlighted in blue = CHP-134, GIMEN, NBL-S, NGP. The other cell lines have activating ALK mutations, as specified in Supplementary Table 2. Data points (n = 6) shown in the graphs on the left are from six technical replicates (independent transfections). Statistics were conducted using the means ± SEM from 17 different cell lines (biological replicates) with a two-tailed Student’s t test; ****p < 1015. Source data are provided in a Source Data file.
Fig. 3
Fig. 3. miR-1304-5p inhibits NRAS expression.
A Experimental schema to identify target genes of miR-1304-5p with selection of the top-target genes (NRAS, PTPN11, IQGAP1, RRAS). B GSEA of ‘Hallmark_KRAS_signaling_up’. GSEA was performed to rank the genes based on their differential expression levels between cells transduced with a non-targeting control (NT) compared to a miR-1304-5p mimic (miR1304). A deviation from an enrichment score (ES) of 0 in the profile (green line) reflects the degree of overrepresentation of genes at the top (positive ES score) or bottom (negative ES score) of the ranked gene list. Expression profiles derived from biological triplicate samples were analyzed by GSEA. C Western blot of the indicated proteins 72 h post transfection of SH-SY5Y with a miR-1304-5p mimic representative of two independent experiments with similar results. D Dual luciferase assay signal driven from the 3′UTR of the 4 target genes transfected into SH-SY5Y, upon miR-1304-5p mimic transfection (ratio of target gene-firefly luciferase (Fluc) to the Renilla luciferase (Rluc) control vector and normalized to the negative control (Scr control)). Data points of n = 3 biological replicates are shown with bars representing the means ± SEM of the three biological replicates. E Cell viability (CTG) of SH-SY5Y cells transduced to express each of the 4 target genes on the left panel and the 4 target genes ± a miR-1304-5p mimic normalized to empty vector transduced cells in the right panel. Data points of n = 3 biological replicates (each with three technical replicates) are shown with bars representing the means ± SEM of three biological replicates. Statistical comparison was conducted using a one-way ANOVA with Tukey’s post-test (D, E); D ****p = 3.3 × 1013, ****p = 2.52 × 109, ****p = 1.03 × 1011, ****p = 9.99 × 10−10, ****p = 8.99 × 1012; E **p = 0.0034, **p = 0.0083, **p = 0.0039. F EFS of 143 NB patients with high or low expression of NRAS (z-score=1), measured by bulk RNA Sequencing (Log-rank test, *p = 0.049). Source data are provided in a Source Data file.
Fig. 4
Fig. 4. The miR-1304-5p mimic is a therapeutic target when used in combination with ALK TKIs.
AD SH-SY5Y (A, B) and KELLY (C, D) cell viability (measured via CTG) and ED50 upon a combination of miR-1304-5p mimic transfection and brigatinib (SH-SY5Y (A) and KELLY (C)) or ceritinib (SH-SY5Y (B) and KELLY (D)) treatment for 72 h at the indicated doses. Graphs on the left show technical triplicates and are representative of three biological replicates. ED50 values shown in the graphs on the right are calculated from the non-linear fit curves represented on the left and show the means ± SEM of biological triplicates. Statistical comparisons were conducted with a Student’s t test of the three biological replicates. E, F Apoptosis determined by caspase 3/7 activity in SH-SY5Y (E) and KELLY (F) cell lines treated with a combination of a miR-1304-5p mimic and brigatinib (1–1000 nM) or ceritinib (1–1000 nM). Data points (n = 3 technical replicates of each of three biological replicates) are shown with columns representing the means ± SEM of three biological replicates. Significance was determined using a one-way ANOVA with Tukey’s post-test. A **p = 0.0063; B *p = 0.045; C *p = 0.045; D *p = 0.027; E ***p = 0.00026, ***p = 0.00045; F ***0.00044. Source data are provided in a Source Data file.
Fig. 5
Fig. 5. ALK inhibitors and FTI act synergistically in ALK-aberrant MYCN non-amplified NB cell lines.
AC SH-SY5Y, KELLY, and FELIX cell viability (CTG) upon treatment with brigatinib, ceritinib, or lonafarnib for 72 h. DG Dose-response matrices of lonafarnib plus brigatinib or ceritinib in SH-SY5Y (D, E) and KELLY (F, G), treated for 72 h with the combination of agents or agents alone. The synergy scores and viability levels shown result from the average of two independent experiments. Loewe synergy scores were calculated with Synergy Finder and are shown in each square for each dose pair. Color gradients represent cell viability as a % compared to the DMSO vehicle control treated cells (from green 100% viability to red 0%). Synergy scores >10 represent synergism in activity of the inhibitors. H, I Apoptosis determined by caspase 3/7 activity per cell population, normalized for the untreated (DMSO) control, in SH-SY5Y (H) and KELLY (I) cells treated with a combination of lonafarnib (1 µM) and brigatinib (1 µM) or ceritinib (1 µM), or each agent alone for 48 h. Data points (n = 3 technical replicates of each of three biological replicates) are shown with columns representing the means ± SEM of three biological replicates. Significance was determined using a one-way ANOVA with Tukey’s post-test of the means of the three biological replicates. H ****p = 2.32 × 106, ****p = 6.58 × 1011, ****p = 1.3 × 105, ****p = 2.6 × 107; I *p = 0.0104, ***p = 0.0002, ****p = 4.5 × 1011. Source data are provided in a Source Data file.
Fig. 6
Fig. 6. A combination of an ALK inhibitor and an FTI act synergistically in PDX cell models via induction of apoptosis.
A Dose-response matrix of lonafarnib (1–3000 nM) and ceritinib (1–1000 nM) alone or in combination, following 72 h incubation with COG-N-426 (FELIX) PDX cells. Loewe synergy scores (Synergy Finder) and cell viability (CTG) result from two biological replicates. Color gradients: % cell viability normalised to DMSO (from green: 100%, to red: 0%). Scores >10 represent synergism. B Apoptosis (caspase 3/7 activity per cell population normalized to DMSO) of COG-N-426 cells treated with a combination of lonafarnib (1 µM) and ceritinib (1 µM), or single agents (same doses), for 48 h. Data points of biological replicates (each with three technical replicates) are shown with columns representing means ± SEM of biological triplicates. C, E Dose-response matrix of lonafarnib (1–1000 nM) and ceritinib (1–1000 nM) alone or in combination, following 72 h incubation in COG-N-557 (C) and COG-N-415 (E) PDX cells. Loewe synergy scores (Synergy Finder) and cell viability (CTG) results are the average from two biological replicates, each conducted with two technical replicates. Color gradients: % cell viability normalised to DMSO (from green: 100%, to red: 0%). Scores >10 represent synergism. D, F Apoptosis (caspase 3/7 activity per cell population normalized to DMSO) of COG-N-557 (D) and COG-N-415 (F) cells treated with a combination of lonafarnib (1 µM) and ceritinib (1 µM), or single agents (same doses), for 72 h. Data points of biological replicates (each with three technical replicates) are shown with columns representing means ± SEM of biological triplicates. One-way ANOVA with Tukey’s post-test of the means of biological triplicates have been used for statistical analysis. B ****p = 3.5 × 108, ****p = 6.15 × 105; D ****p = 1.17 × 106, **p = 0.002; F ****p = 4.14 × 107, ****p = 5.48 × 106. Source data are provided in a Source Data file.
Fig. 7
Fig. 7. A combination of an ALK inhibitor (ceritinib) with a FTI (lonafarnib) significantly reduces PDX tumour growth in vivo.
A Tumour volume over time of NSG mice injected sub-cutaneously with COG-N-426x primary NB cells which reached 75 mm3 before daily administration of either vehicle (20% hydroxypropyl beta cyclodextrin), ceritinib (30 mg/kg), lonafarnib (40 mg/kg), or ceritinib and lonafarnib (combo, same doses). The study endpoint is tumours reaching 15 mm diameter or following 30 days of treatment, whichever came first. Data shown represent means ± SEM from 6 mice (n = 6) at each time point. The one-way ANOVA with Tukey’s post-test was used to determine significance at each experimental endpoint in A. ****p = 1.22 × 1013, ****p = 3.77 × 108, ****p < 10−15. B Kaplan–Meier EFS analysis. Data points (n = 6) represent means ± SEM, shown until the experimental endpoint (as defined above) of the first animal within each treatment group, ***p = 0.0007 (Log-rank test). C Mouse body weight at the experimental endpoint relative to baseline weights for each treatment group. Data points (n = 6) are shown with means ± SEM. The one-way ANOVA with Tukey’s post-test was used to determine significance at each experimental endpoint in C and significance was not reached in any case. D MRI scan of coronal and sagittal sections of animals treated with a combination of lonafarnib and ceritinib at the end of treatment (left panel) compared to relapses after 9 (central panel) and 10 (right panel) days following the end of treatment. Red arrows = tumour mass; green bar = 1 cm. E Immunohistochemistry (pERK) in tumours from mice treated with vehicle (20% hydroxypropyl-beta-cyclodextrin), ceritinib (30 mg/kg) or lonafarnib (40 mg/kg) at the study endpoint. Images are representative of three independent replicates with similar results. Magnification bar = 100 µm. Inserts = ×200 magnification. Source data are provided in a Source Data file.

References

    1. Redaelli S, et al. Lorlatinib treatment elicits multiple on- and off-target mechanisms of resistance in ALK-driven cancer. Cancer Res. 2018;78:6866–6880. doi: 10.1158/0008-5472.CAN-18-1867. - DOI - PubMed
    1. Mehlman C, et al. Ceritinib ALK T1151R resistance mutation in lung cancer with initial response to brigatinib. J. Thorac. Oncol. 2019;14:e95–e96. doi: 10.1016/j.jtho.2018.12.036. - DOI - PubMed
    1. Friboulet L, et al. The ALK inhibitor ceritinib overcomes crizotinib resistance in non-small cell lung cancer. Cancer Discov. 2014;4:662–673. doi: 10.1158/2159-8290.CD-13-0846. - DOI - PMC - PubMed
    1. Sharma GG, et al. A compound L1196M/G1202R ALK mutation in a patient with ALK-positive lung cancer with acquired resistance to brigatinib also confers primary resistance to lorlatinib. J. Thorac. Oncol. 2019;14:e257–e259. doi: 10.1016/j.jtho.2019.06.028. - DOI - PubMed
    1. Trigg RM, et al. The targetable kinase PIM1 drives ALK inhibitor resistance in high-risk neuroblastoma independent of MYCN status. Nat. Commun. 2019;10:5428. doi: 10.1038/s41467-019-13315-x. - DOI - PMC - PubMed

Publication types

MeSH terms