. 2024 Apr 23;15(1):3440.
doi: 10.1038/s41467-024-47837-w.

Temporal coordination of the transcription factor response to H2O2 stress

Affiliations

Temporal coordination of the transcription factor response to H2O2 stress

Elizabeth Jose et al. Nat Commun. .

Abstract

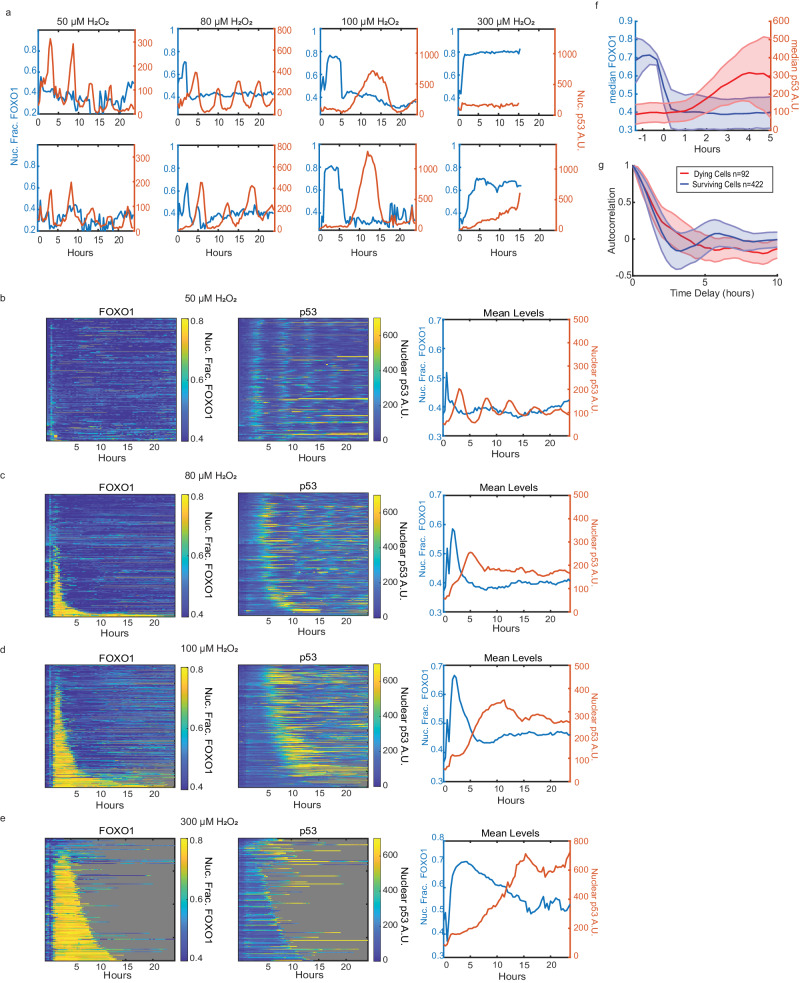
Oxidative stress from excess H2O2 activates transcription factors that restore redox balance and repair oxidative damage. Although many transcription factors are activated by H2O2, it is unclear whether they are activated at the same H2O2 concentration, or time. Dose-dependent activation is likely as oxidative stress is not a singular state and exhibits dose-dependent outcomes including cell-cycle arrest and cell death. Here, we show that transcription factor activation is both dose-dependent and coordinated over time. Low levels of H2O2 activate p53, NRF2 and JUN. Yet under high H2O2, these transcription factors are repressed, and FOXO1, NF-κB, and NFAT1 are activated. Time-lapse imaging revealed that the order in which these two groups of transcription factors are activated depends on whether H2O2 is administered acutely by bolus addition, or continuously through the glucose oxidase enzyme. Finally, we provide evidence that 2-Cys peroxiredoxins control which group of transcription factors are activated.


Conflict of interest statement

The authors declare no competing interests.

Figures

Fig. 1
Fig. 1. Mutually exclusive activation of FOXO1 and p53 in response to H2O2.
a Immunofluorescence images of MCF7 cells treated with indicated concentrations of H2O2 for 5 h and stained for FOXO1 (top row) and p53 (bottom row). Green arrow indicates a cell with nuclear FOXO1 and low levels of p53. Red arrow shows a cell with cytoplasmic FOXO1 and increased levels of p53. Experiments were repeated over 10 times with similar results. b Density colored scatter plots (n ≥ 2000 cells) of the log of nuclear p53 levels (x-axis) and the nuclear fraction of FOXO1 (y-axis). c Percentage of cells activating both FOXO1 and p53, only FOXO1, only p53 and neither at the indicated concentrations at 5 h of H2O2 treatment. Thresholds are indicated by dashed lines in (b). d Box and whisker plots of γH2AX and (e) nuclear p53 levels measured by immunofluorescence (n ≥ 10,000 cells) after 3 h of H2O2 treatment at indicated concentrations. γH2AX and nuclear p53 levels were measured in the same experiment. The central line indicates the median, bottom and top edges of the box are the 25th and 75th percentiles respectively. The whiskers indicate the extreme data points not considered as outliers and outliers are indicated by a red plus sign. f Median tail DNA content for alkaline and (g) neutral comet assay for indicated H2O2 concentrations (µM) and NCS concentrations (ng/mL). Crosses are values for 2 replicates. h Median p53 intensities measured by immunofluorescence for cells (n ≥ 3000 cells) treated with NCS (+ = 800 ng/mL) and indicated concentrations of H2O2 (µM). Error bars are the median absolute deviation. A.U. Arbitrary Units. Nuc. Frac. - Nuclear Fraction. Source data are provided in Source Data Fig. 1.
Fig. 2
Fig. 2. FOXO1 activation precedes p53 activation at high concentration of acute H2O2 treatment.
a Representative single-cell traces of nuclear fraction of FOXO1 (blue, left y-axis) and nuclear levels of p53 (red, right y-axis) of cells treated with 50 µM, 80 µM, 100 µM and 300 µM of H2O2 for 24 h. be Heat maps of single-cell traces of nuclear fraction of FOXO1-mVenus (left), nuclear p53-mCherry (middle), and mean of both (right) for 24 h following H2O2. Each row of the heat maps is a single cell over time. Both FOXO1 and p53 heat maps are sorted by the duration that FOXO1-mVenus remained in the nucleus. Gray indicates cell death. b 50 µM H2O2 (n = 188 cells, 1% cell death). c 80 µM H2O2 (n = 238 cells, 11% cell death). d 100 µM H2O2 (n = 288 cells, 34% cell death). e 300 µM H2O2 (n = 186 cells, 97% cell death). f Median levels of FOXO1 and p53 of all cells in 80 µM and 100 µM treatments with traces aligned to when FOXO1 exited the nucleus. g Autocorrelation of p53 trajectories of dying (red, n = 92) vs surviving (blue, n = 422) cells, treated with 80 µM and 100 µM of H2O2 from Figs. 2C and 2D. Shaded error bars in (f, g) represent the median absolute deviation. A.U. - Arbitrary Units. Nuc. Frac. - Nuclear Fraction. Source data are provided in Source Data Fig. 2.
Fig. 3
Fig. 3. p53 accumulation precedes FOXO1 activation under continuous H2O2 production.
a Representative single-cell traces of nuclear fraction of FOXO1-mVenus (blue, left y-axis) and nuclear levels of p53-mCherry (red, right y-axis) of cells treated with .5 mU/mL (milliunits per milliliter), .75 mU /mL, 1 mU/mL, and 2 mU/mL of glucose oxidase (GOX) for 24 h. be nuclear fraction of FOXO1-mVenus (left) the derivative or rate of p53-accumulation in A.U. per hour (2nd from left), Heat maps of single-cell traces for nuclear p53-mCherry (3rd from left) and mean of FOXO1-mVenus and p53-mCherry (right) for 24 h following GOX treatment. Each row of the heat maps is a single cell over time. All heat maps are sorted from top to bottom by the time in which FOXO1 entered the nucleus. Gray indicates cell death. b 0.5 mU/mL GOX (n = 176 cells, 27% cell death). c 0.75 mU/mL (n = 154 cells, 50% cell death). d 1 mU/mL GOX (n = 232 cells, 63% cell death). e 2 mU/mL GOX (n = 195 cells, 97% cell death). f Median levels of FOXO1 and median rate of p53 accumulation of all cells treated with GOX. Traces are aligned to when FOXO1 entered the nucleus. g same as (f), but median p53 levels are plotted. Shaded error bars in (f, g) represent the median absolute deviation. A.U. - Arbitrary Units. Nuc. Frac. - Nuclear Fraction. Source data are provided in Source Data Fig. 3.
Fig. 4
Fig. 4. Additional H2O2 induced transcription factors are activated with either FOXO1 or p53.
a Uniform manifold approximation and projection (UMAP) plot of cells treated with PBS, 50 µM and 75 µM of H2O2 after unsupervised clustering (n ≥ 10,000). Colors for cells based on the six clusters obtained. b UMAP of the same cells in A but colored based on sample. c UMAPs of cells from A colored by deviation scores for FOXO1 (left), RelA (middle) and HSF1 motifs (right) (d) UMAPs of cells from A showing deviation scores for p53 (left), Jun(middle) and NRF2 motifs (right) (e) Density colored scatter plots of log nuclear p53 (x-axis) and nuclear fraction of RelA (y-axis) at indicated levels of H2O2 treatment for 5 h (f) Percentage of cells activating both RelA and p53 (Both), RelA only, p53 only or neither for all concentrations of H2O2 (g) Density colored scatter plots of log nuclear p53 (x-axis) and nuclear fraction of NFAT1 (y-axis) at indicated levels of H2O2 treatment for 5 h (h) Percentage of cells activating both NFAT1 and p53 (Both), NFAT1 only, p53 only or neither for all concentrations of H2O2. i Density colored scatter plots of log nuclear NRF2 (x-axis) and nuclear fraction of FOXO1(y-axis) at indicated levels of H2O2 treatment for 5 h (j) Percentage of cells activating both FOXO1 and NRF2 (Both), FOXO1 only, NRF2 only or neither for all concentrations of H2O2. k Density colored scatter plots of log nuclear JUN (x-axis) and nuclear fraction of FOXO1 (y-axis) at indicated levels of H2O2 treatment for 5 h (l) Percentage of cells activating both FOXO1 and JUN (Both), FOXO1 only, JUN only or neither for all concentrations of H2O2. A.U. - Arbitrary Units. Nuc. Frac. - Nuclear Fraction. Source data are provided in Source Data Fig. 4.
Fig. 5
Fig. 5. The role of the Peroxiredoxin/Sulfiredoxin system in controlling the switch between p53 and FOXO1 activation.
a Schematic of the redox cycle of PRDXs. H2O2 oxidizes the peroxidatic cysteine to sulfenic acid (SOH), which can form a disulfide bond in trans with the resolving cysteine. At high H2O2 concentrations, the peroxidatic cysteine is further oxidized to SO2H. PRDX-SO2H can be repaired by SRXN1 to sulfenic acid. Oxidized peroxiredoxins can be reduced by the Thioredoxin system or can transfer oxidative equivalents to other proteins as depicted by protein X in the diagram. b Western Blot stained for hyperoxidized (SO2/SO3) PRDX1/2/3/4 and Actin in MCF7 cells treated with indicated concentrations of H2O2 for 3 h. Experiment was one of 3 biological replicates with similar results. Non-reducing western blots of (c) PRDX1 and (d) PRDX2, exposed to different concentrations of H2O2. Actin was used as a loading control. Experiments are one of two biological replicates with similar results. Density colored scatter plots (e, g, i, k) and percentage of cells activating both FOXO1 and p53, only FOXO1, only p53 or neither (f, h, j, l). e, f Cells treated with H2O2 used as a control at the indicated concentrations of H2O2 for 5 h. g, h PRDX1 knockout cells treated with H2O2 at indicated concentrations for 5 h. i, j Cells treated with 20 µM of J14, an inhibitor of SRXN1, along with H2O2 at the indicated concentrations for 5 h. k, l Cells overexpressing SRXN1 (SRXN1 OE) treated with indicated concentrations of H2O2 for 5 h. A.U. - Arbitrary Units. Nuc. Frac. - Nuclear Fraction. Source data are provided in Source Data Fig. 5.
Fig. 6
Fig. 6. The two temporal phases of transcription factor activation cause distinct transcriptional changes.
a Significantly up and downregulated genes (P < 0.0001, Wald test, |Log2Fold Change | > 0.2) in H2O2 treated cells vs. PBS controls, H2O2 + J14 treated cells vs J14 treated controls and H2O2 treated SRXN1 OE cells vs. SRXN1 OE PBS controls. H2O2 concentration is 50 μM, J14 20 μM. b Volcano plot showing log2 fold-change and -log10 adjusted p value (Wald test) of SRXN1 OE cells treated with H2O2 vs J14 treated with H2O2. c GSEA of KEGG pathways upregulated in cells treated with J14 + H2O2 as compared to SRXN1-OE + H2O2. d GSEA of KEGG pathways upregulated in SRXN1 OE cells treated with H2O2 as compared to cells treated with J14 + H2O2. SRXN1 OE - SRXN1 overexpression. P values in (c, d) were calculated by permutation test and adjusted using the Benjamini-Hochberg correction.
Fig. 7
Fig. 7. Temporal activation of transcription factors by H2O2 stress.
a Model showing early FOXO1 activation followed by p53 activation in response to acute H2O2 stress (left). Lower levels of H2O2 induce p53 oscillations whereas higher levels of H2O2 cause p53 to become more sustained in cells. The duration of FOXO1 increases as the dose of H2O2 is increased. In response to continuous H2O2 from glucose oxidase (right), p53 accumulates before FOXO1 but stops accumulating once FOXO1 is active. b Different transcription factors are activated with FOXO1 (left) and p53 (right). The two transcription factor groups upregulate very distinct transcriptional programs.

Update of

Similar articles

Cited by

References

    1. Sies H, Jones DP. Reactive oxygen species (ROS) as pleiotropic physiological signalling agents. Nat. Rev. Mol. Cell Biol. 2020;21:363–383. doi: 10.1038/s41580-020-0230-3. - DOI - PubMed
    1. Arnold RS, et al. Hydrogen peroxide mediates the cell growth and transformation caused by the mitogenic oxidase Nox1. Proc. Natl Acad. Sci. 2001;98:5550–5555. doi: 10.1073/pnas.101505898. - DOI - PMC - PubMed
    1. Sigaud S, Evelson P, González-Flecha B. H2O2-induced proliferation of primary alveolar epithelial cells is mediated by MAP kinases. Antioxid. Redox Signal. 2005;7:6–13. doi: 10.1089/ars.2005.7.6. - DOI - PubMed
    1. Niethammer P, Grabher C, Look AT, Mitchison TJ. A tissue-scale gradient of hydrogen peroxide mediates rapid wound detection in zebrafish. Nature. 2009;459:996–999. doi: 10.1038/nature08119. - DOI - PMC - PubMed
    1. Sena LA, Chandel NS. Physiological roles of mitochondrial reactive oxygen species. Mol. cell. 2012;48:158–167. doi: 10.1016/j.molcel.2012.09.025. - DOI - PMC - PubMed

Publication types

MeSH terms