. 2024 Apr 23;10(1):30.
doi: 10.1038/s41523-024-00638-2.

Peripheral immune cells in metastatic breast cancer patients display a systemic immunosuppressed signature consistent with chronic inflammation

Affiliations

Peripheral immune cells in metastatic breast cancer patients display a systemic immunosuppressed signature consistent with chronic inflammation

Sudhir Kumar Chauhan et al. NPJ Breast Cancer. .

Abstract

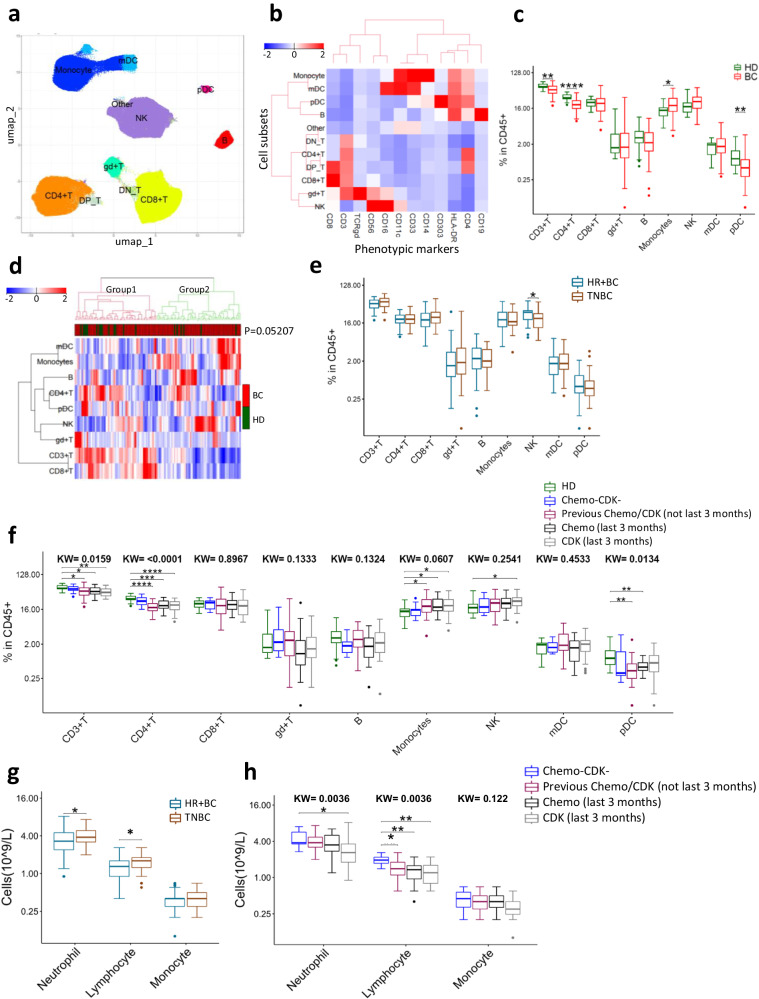
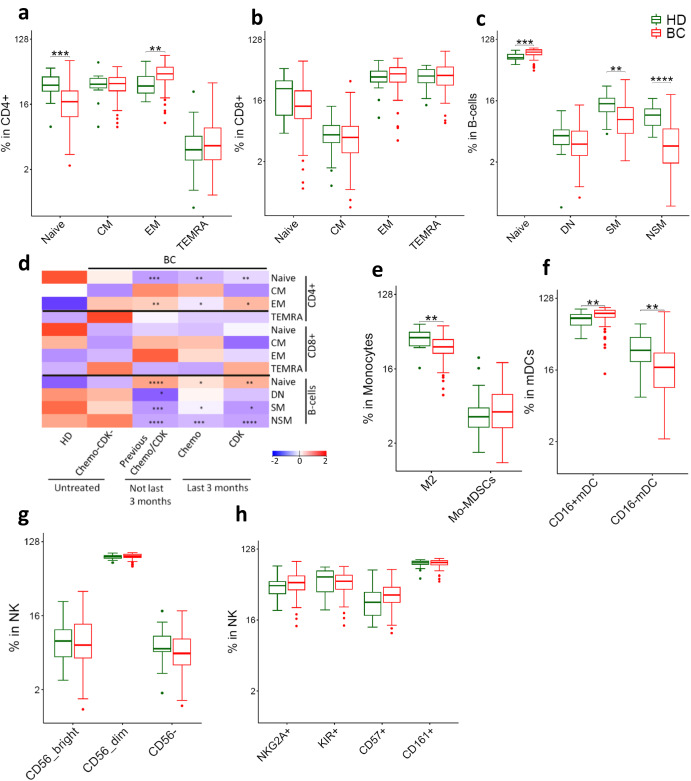
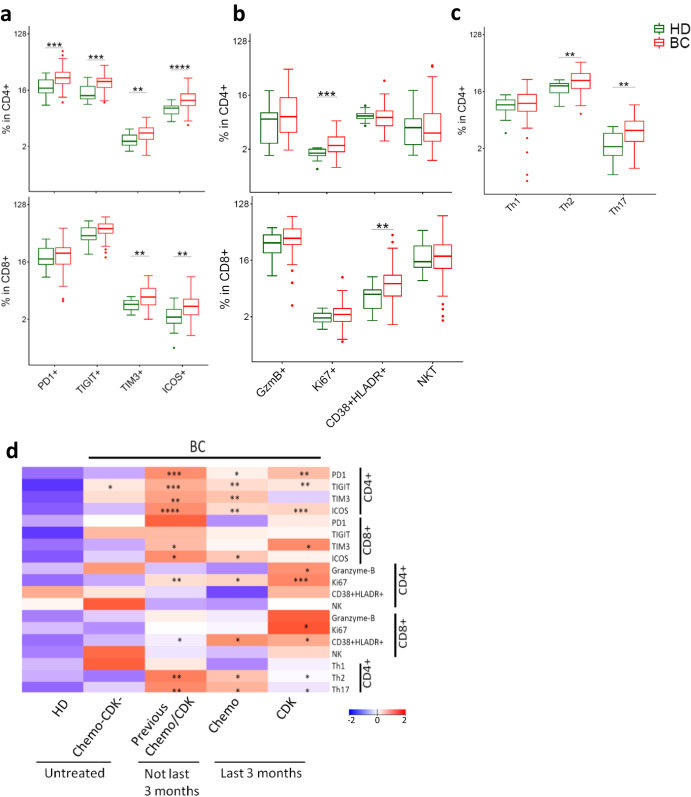
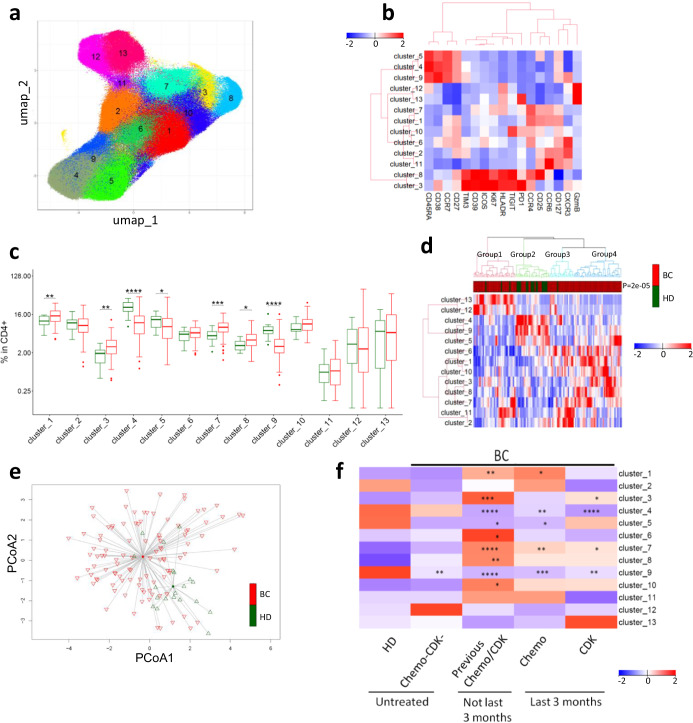
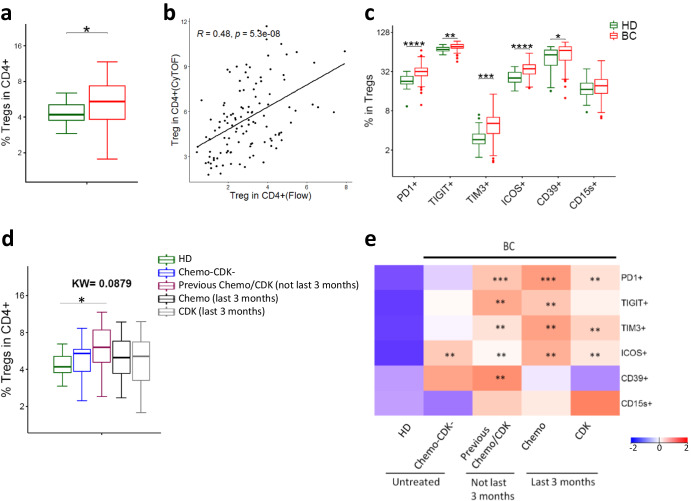
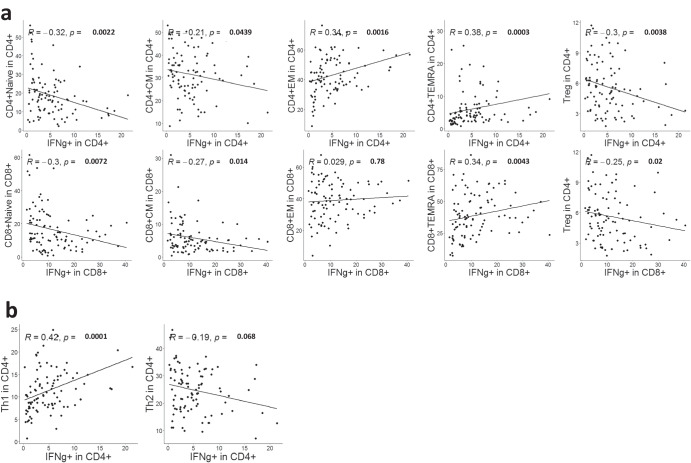
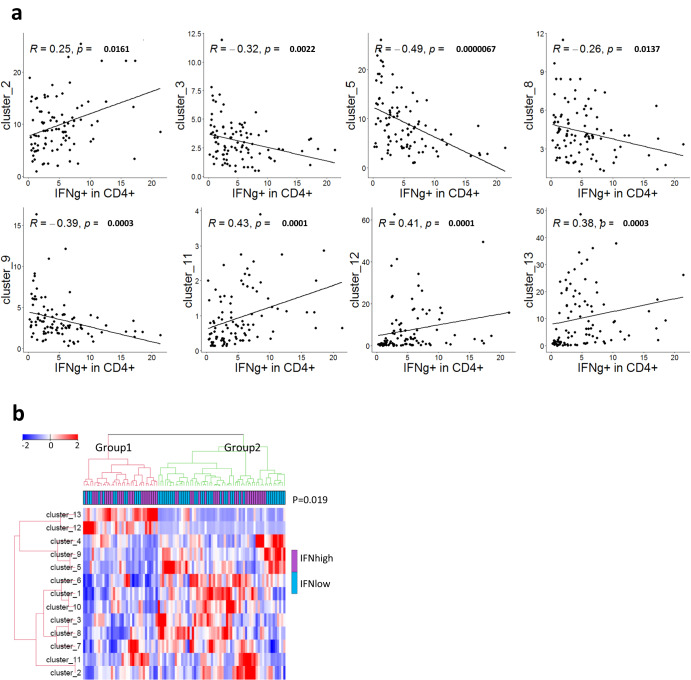
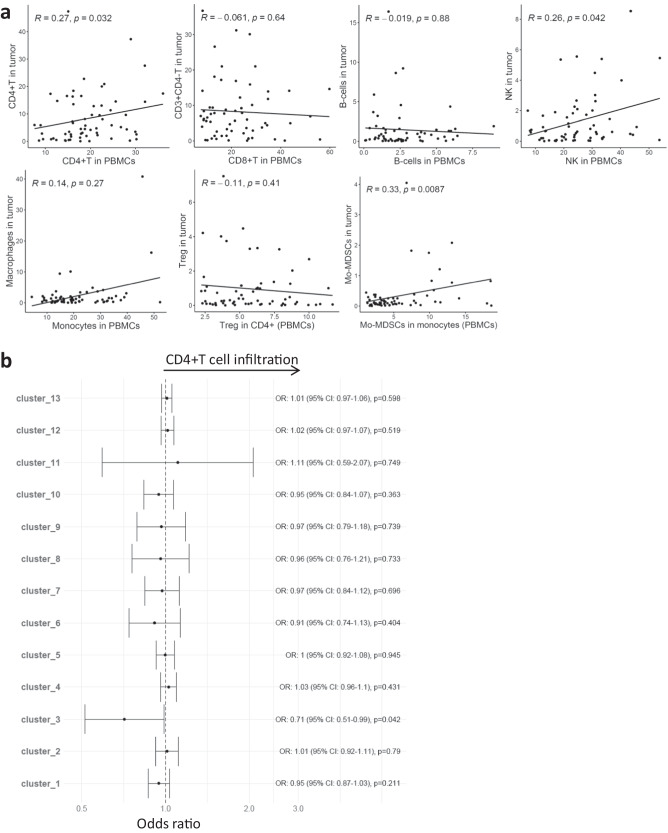
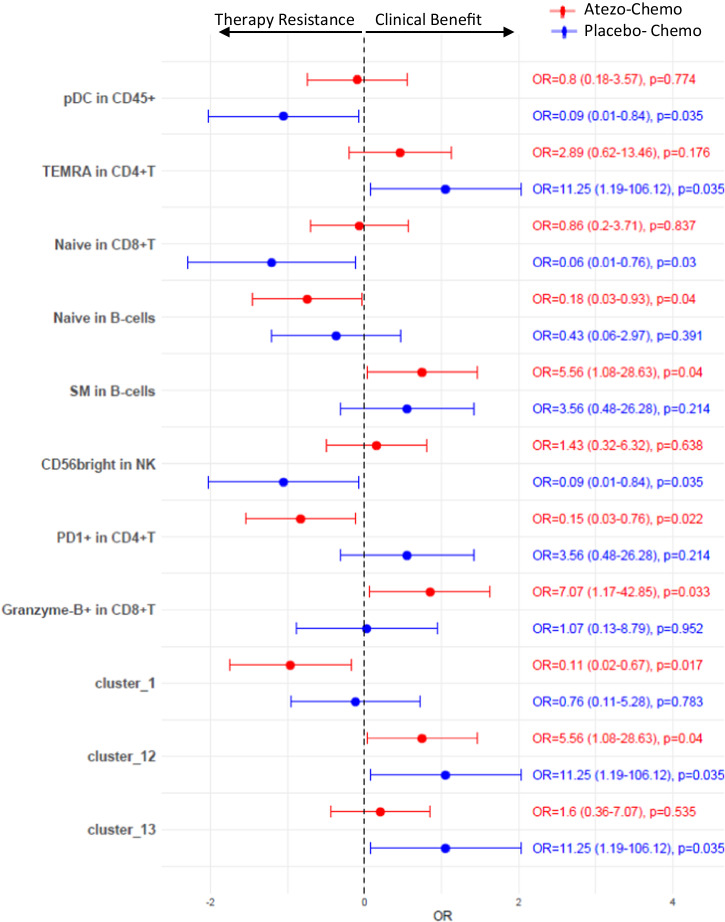
Immunotherapies blocking the PD-1/PD-L1 checkpoint show some efficacy in metastatic breast cancer (mBC) but are often hindered by immunosuppressive mechanisms. Understanding these mechanisms is crucial for personalized treatments, with peripheral blood monitoring representing a practical alternative to repeated biopsies. In the present study, we performed a comprehensive mass cytometry analysis of peripheral blood immune cells in 104 patients with HER2 negative mBC and 20 healthy donors (HD). We found that mBC patients had significantly elevated monocyte levels and reduced levels of CD4+ T cells and plasmacytoid dendritic cells, when compared to HD. Furthermore, mBC patients had more effector T cells and regulatory T cells, increased expression of immune checkpoints and other activation/exhaustion markers, and a shift to a Th2/Th17 phenotype. Furthermore, T-cell phenotypes identified by mass cytometry correlated with functionality as assessed by IFN-γ production. Additional analysis indicated that previous chemotherapy and CDK4/6 inhibition impacted the numbers and phenotype of immune cells. From 63 of the patients, fresh tumor samples were analyzed by flow cytometry. Paired PBMC-tumor analysis showed moderate correlations between peripheral CD4+ T and NK cells with their counterparts in tumors. Further, a CD4+ T cell cluster in PBMCs, that co-expressed multiple checkpoint receptors, was negatively associated with CD4+ T cell tumor infiltration. In conclusion, the identified systemic immune signatures indicate an immune-suppressed environment in mBC patients who had progressed/relapsed on standard treatments, and is consistent with ongoing chronic inflammation. These activated immuno-suppressive mechanisms may be investigated as therapeutic targets, and for use as biomarkers of response or treatment resistance.


Conflict of interest statement

The authors declare no competing interests.

Figures

Fig. 1
Fig. 1. Mass cytometry analysis of major immune subsets in peripheral blood of breast cancer (BC) patients and healthy donors (HD).
a UMAP analysis of PBMCs using 12 phenotypic markers (CD3, CD4, CD8, TCRgd, CD19, CD56, CD16, CD33, CD14, CD11c, HLA-DR, and CD303). Different immune subsets were identified by phenograph clustering. b Heat map depicting mean expression of phenotypic markers on different immune subsets. c Abundance of lymphocyte and myeloid immune cell subsets in BC patients (n = 104) and HD (n = 20). d Heat map representing hierarchical clustering of all samples based on abundance of different immune subsets. Groups were compared with Fisher’s exact test. e Abundance of lymphocyte and myeloid cell subsets in patients with HR+ BC (n = 57) or TNBC (n = 47). f Effect of previous therapy on immune cells: Received no chemotherapy/CDK inhibitors (ChemoCDK; n = 10), received chemotherapy/CDK inhibitors > 3 months before sample collection [Previous Chemo/CDK (not last 3 months); n = 40], received chemotherapy within 3 months before sample collection [Chemo (last 3 months); n = 26], received CDK inhibitors within 3 months before sample collection [CDK (last 3 months); n = 28]. g Absolute numbers of immune cell subsets per liter blood of HR+ BC (n = 57) and TNBC patients (n = 47). h Absolute numbers of immune cell subsets per liter blood of patients grouped based on previous treatments. Two groups were compared by Wilcoxon Mann–Whitney Rank Sum Test. More than two groups were compared by Kruskal–Wallis test, followed by pair-wise comparisons using Wilcoxon Mann–Whitney Rank Sum Test using HD (ChemoCDK for Fig. 1h) as a reference group. FDR-adjusted p-value (p.adj) <0.05 was considered statistically significant. *p.adj < 0.05, **p.adj < 0.01, ***p.adj < 0.001, ****p.adj < 0.0001. Box plots show median (center line), 25th and 75th percentiles (box), data within 1.5 IQR (whiskers), and outliers (dots). Abbreviations: T, T cells, B, B cells, NK Natural Killer cells, mDC myeloid dendritic cells, pDC plasmacytoid dendritic cells, DN double negative, DP double positive.
Fig. 2
Fig. 2. Differentiation subsets of immune cells in BC patients and HD.
ad Adaptive immune cells (a) CD4+ T (b) CD8+ T (c) B-cells (d) Effect of previous chemotherapy and CDK inhibitors on phenotype of adaptive immune cells in BC patients. Heatmap represents relative median of each cell subset across HD and different patient groups. eh Innate immune cells (e) Monocytes (f) mDCs (g-h) NK cells. Two groups were compared by Wilcoxon Mann-Whitney Rank Sum Test. More than two groups were compared by kruskal wallis test, followed by pair-wise comparisons using Wilcoxon Mann–Whitney Rank Sum Test with HD as a reference group. p.adj < 0.05 was considered statistically significant. *p.adj < 0.05, **p.adj < 0.01, ***p.adj < 0.001, ****p.adj < 0.0001. BC: n = 104. HD: n = 20. Box plots show median (center line), 25th and 75th percentiles (box), data within 1.5 IQR (whiskers), and outliers (dots). Abbreviations: CM central memory, EM effector memory, TEMRA effector memory re-expressing CD45RA, SM switched memory, NSM non-switched memory, DN double negative, Mo-MDSCs Monocytic myeloid derived suppressor cells.
Fig. 3
Fig. 3. Phenotypic characterization of T cells in BC patients and HD.
Expression of immune checkpoint receptors (a) and functional/phenotypic markers (b) in CD4+ and CD8+ T cells. c Abundance of Th1/Th2/Th17 subsets in CD4+ T cells. d Effect of previous chemotherapy and CDK inhibitors on phenotype of T cells in BC patients. Heatmap represents relative median of each cell subset across HD and different patient groups. Two groups were compared by Wilcoxon Mann–Whitney Rank Sum Test. More than two groups were compared by Kruskal–Wallis test, followed by pair-wise comparisons using Wilcoxon Mann-Whitney Rank Sum Test using HD as a reference group. *p.adj < 0.05, **p.adj < 0.01, ***p.adj < 0.001, ****p.adj < 0.0001. BC: n = 104. HD: n = 20. Box plots show median (center line), 25th and 75th percentiles (box), data within 1.5 IQR (whiskers), and outliers (dots). Abbreviations: NKT natural killer T cells.
Fig. 4
Fig. 4. Unsupervised analysis identified CD4+ T cell clusters with different abundance in patients and HD.
a CD4+ T cells from patients and HD were subjected to UMAP followed by automated clustering using phenograph. 13 unique clusters were identified. b Heat map showing expression of phenotypic/functional markers in CD4+ T cell clusters. c Comparative abundance of CD4+ T cell clusters between HD and BC patients. Groups were compared by Wilcoxon Mann-Whitney Rank Sum Test. d Heat map representing hierarchical clustering of all samples based on CD4+ T cell clusters. Proportions of each cluster were scaled and centered. Groups were compared with Fisher’s exact test. e Principal coordinate analysis (PCoA) of BC patients and HD using all 13 CD4+ T cell clusters. f Effect of previous therapy on identified CD4+ T cell clusters. Heatmap represents relative median of each cell subset. *p.adj < 0.05, **p.adj < 0.01, ***p.adj < 0.001, ****p.adj < 0.0001. Box plots show median (center line), 25th and 75th percentiles (box), data within 1.5 IQR (whiskers), and outliers (dots). BC: n = 104. HD: n = 20.
Fig. 5
Fig. 5. Phenotypic characterization of regulatory T cells (Tregs) in BC patients.
a Tregs (CD25+CD127) in CD4 compartment identified by mass cytometry. b Correlation between Tregs identified by CyTOF (CD25+CD127) and Flow cytometry (CD25+Foxp3+) (BC = 99, HD = 16). Spearman rank correlation. c Expression of immune checkpoints and functional markers on Tregs. d Effect of previous chemotherapy and CDK inhibitors on abundance of Tregs. e Effect of previous therapy on expression of immune checkpoints and functional markers on Tregs. Heatmap represents relative median of each cell subset across HDs and different patient groups. Two groups were compared by Wilcoxon Mann-Whitney Rank Sum Test. More than two groups were compared by Kruskal–Wallis test, followed by pair-wise comparisons using Wilcoxon Mann-Whitney Rank Sum Test with HD as a reference group. *p.adj < 0.05, **p.adj < 0.01, ***p.adj < 0.001, ****p.adj < 0.0001. Box plots show median (center line), 25th and 75th percentiles (box), data within 1.5 IQR (whiskers), and outliers (dots).
Fig. 6
Fig. 6. IFNγ production correlates with T cell subsets identified by manual gating.
PBMCs from BC patients (n = 95) were stimulated by CD3/CD28 beads. IFNγ production was determined by flow cytometry. a Correlation of IFNγ production by CD4 (upper) and CD8 (lower) T cells with differentiation subsets of T cells (Naive, CM, EM, and TEMRA) and Tregs. b Correlation of IFNγ production by CD4 (upper) and CD8 (lower) T cells with Th subsets identified by CyTOF. Spearman rank correlation. FDR-adjusted p-values are shown.
Fig. 7
Fig. 7. IFNγ production correlates with CD4+ T cell clusters identified by unsupervised analysis.
PBMCs from BC (n = 95) patients were stimulated by CD3/CD28 beads and IFNγ production was determined by flow cytometry. a Spearman rank correlation of CD4+ T cell clusters (shown in Fig. 4) with IFNγ production by CD4+ T cells. Only T cell clusters with a significant correlation are shown. FDR-adjusted p-values are shown. b Heat map (hierarchical clustering) representing relative abundance of the 13 CD4+ T clusters in IFNhigh and IFNlow BC patients. Groups were compared with Fisher’s exact test.
Fig. 8
Fig. 8. Association of immune cell types in PBMCs with immune cells infiltration in tumor.
a Correlation of immune cells between peripheral blood and tumor. Spearman correlation. b Odds ratios (OR) for associations between CD4+ T cell clusters in PBMCs and CD4+ T cell infiltration in tumor. Odds ratios were derived from univariate logistic regression. Immune cells in tumor were shown as their proportion within live cells as determined by flow cytometry. Unadjusted p-values are shown. BC (n = 63).
Fig. 9
Fig. 9. Association of peripheral immune cells with clinical benefit in mTNBC patients treated with atezolizumab with/without anthracycline-based chemotherapy.
Forest plot showing odds ratios (OR). Clinical benefit was defined as patients who had either an objective response or stable disease lasting at least until the radiological evaluation at 24 weeks ± 7 days. Odds ratios were derived from univariate logistic regression. Unadjusted p-values are shown. Only factors with p-values < 0.05 in one or both treatment arms are shown. Atezo-Chemo; patients receiving combined Atezolizumab plus anthracycline-based chemotherapy (n = 29), Placebo-Chemo; patients receiving anthracycline-based chemotherapy only (n = 18).

References

    1. Sung H, et al. Global cancer statistics 2020: GLOBOCAN estimates of icidence and mortality worldwide for 36 cancers in 185 Countries. CA Cancer J. Clin. 2021;71:209–249. doi: 10.3322/caac.21660. - DOI - PubMed
    1. Harbeck N, et al. Breast cancer. Nat. Rev. Dis. Primers. 2019;5:66. doi: 10.1038/s41572-019-0111-2. - DOI - PubMed
    1. Cardoso F, et al. Global analysis of advanced/metastatic breast cancer: decade report (2005-2015) Breast. 2018;39:131–138. doi: 10.1016/j.breast.2018.03.002. - DOI - PubMed
    1. Howlader, N. et al. US incidence of breast cancer subtypes defined by joint hormone receptor and HER2 status. J. Natl Cancer Inst.106, dju055 (2014). - PMC - PubMed
    1. Waks AG, Winer EP. Breast cancer treatment: a review. JAMA. 2019;321:288–300. doi: 10.1001/jama.2018.19323. - DOI - PubMed