. 2024 Apr 23;15(1):3431.
doi: 10.1038/s41467-024-45332-w.

The gut microbiome-prostate cancer crosstalk is modulated by dietary polyunsaturated long-chain fatty acids

Affiliations

The gut microbiome-prostate cancer crosstalk is modulated by dietary polyunsaturated long-chain fatty acids

Gabriel Lachance et al. Nat Commun. .

Abstract

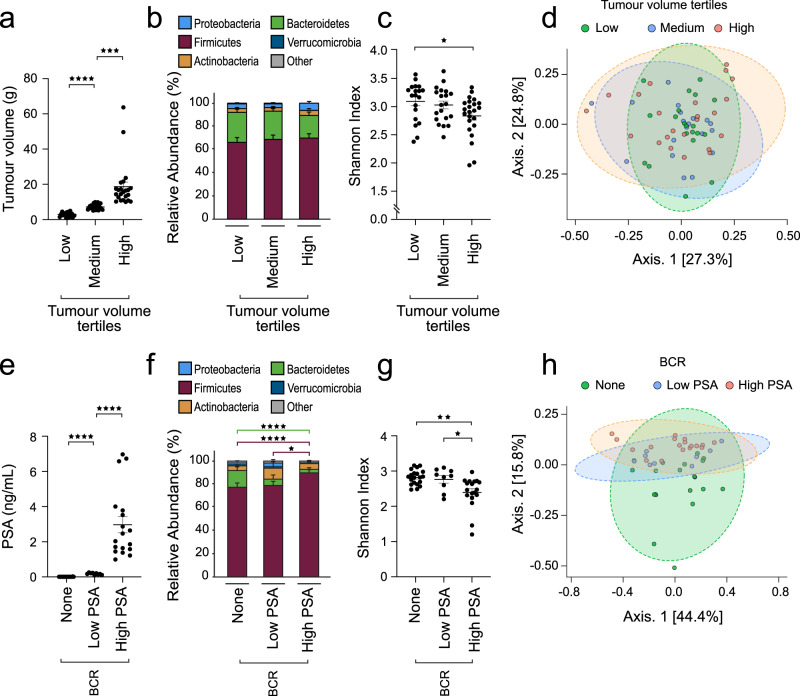
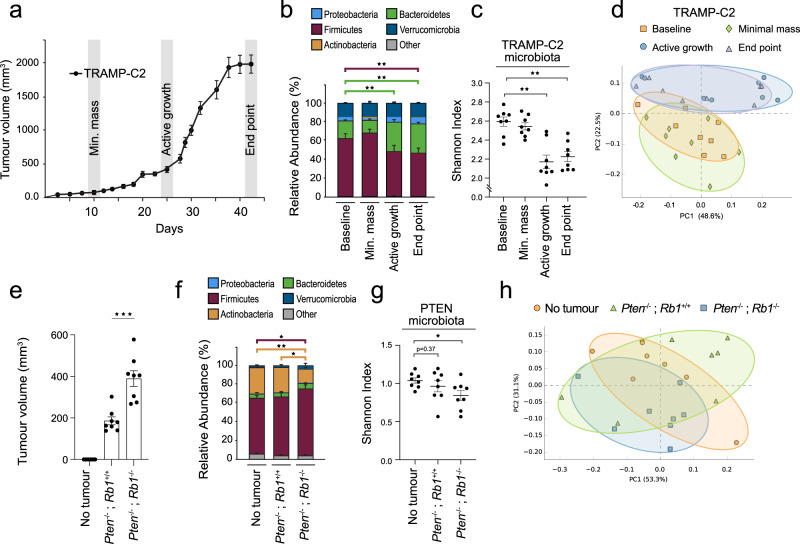
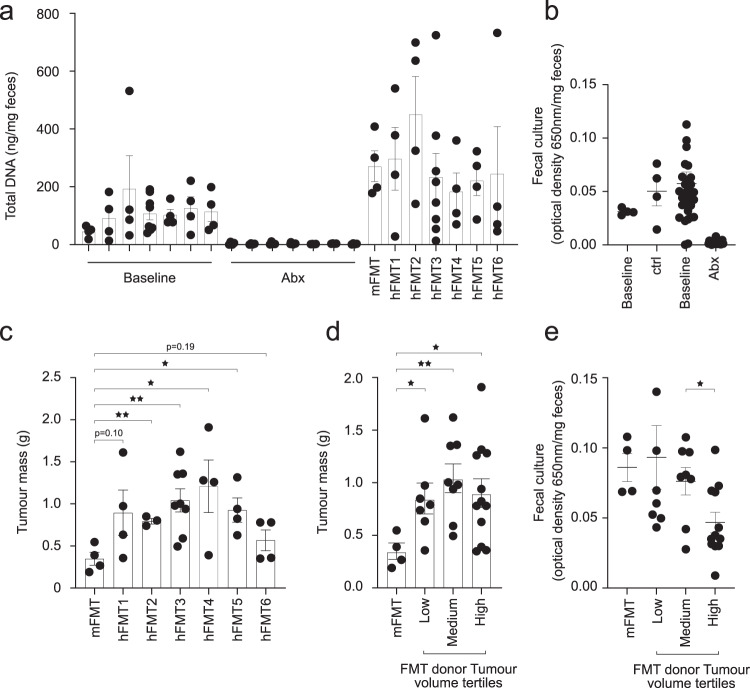
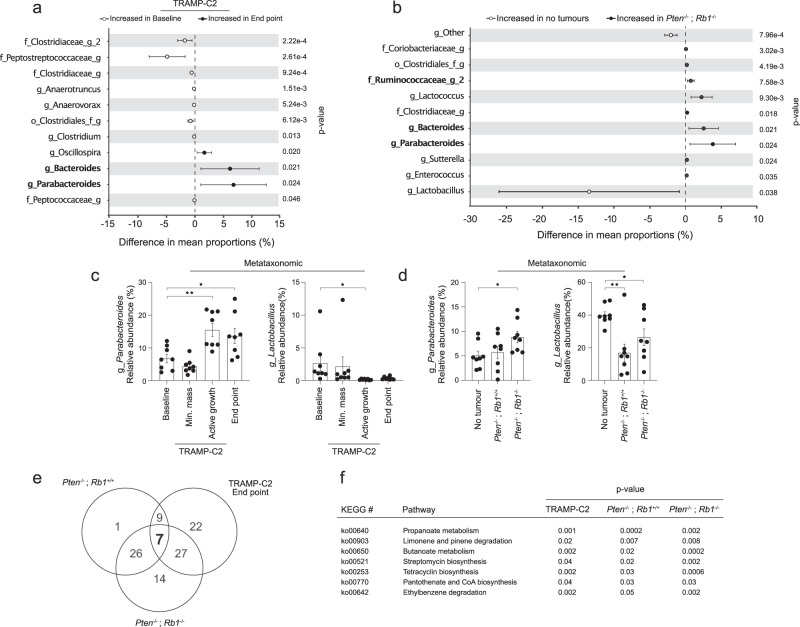
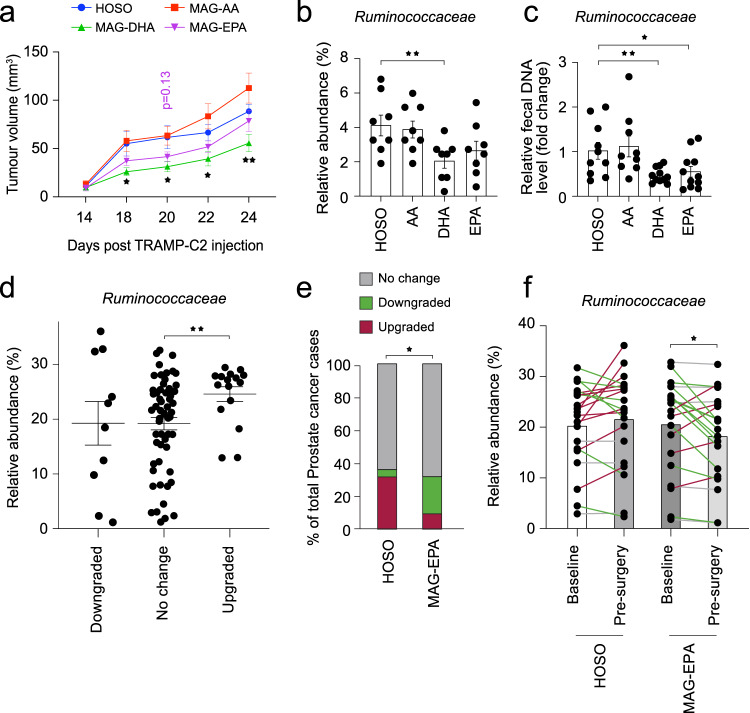
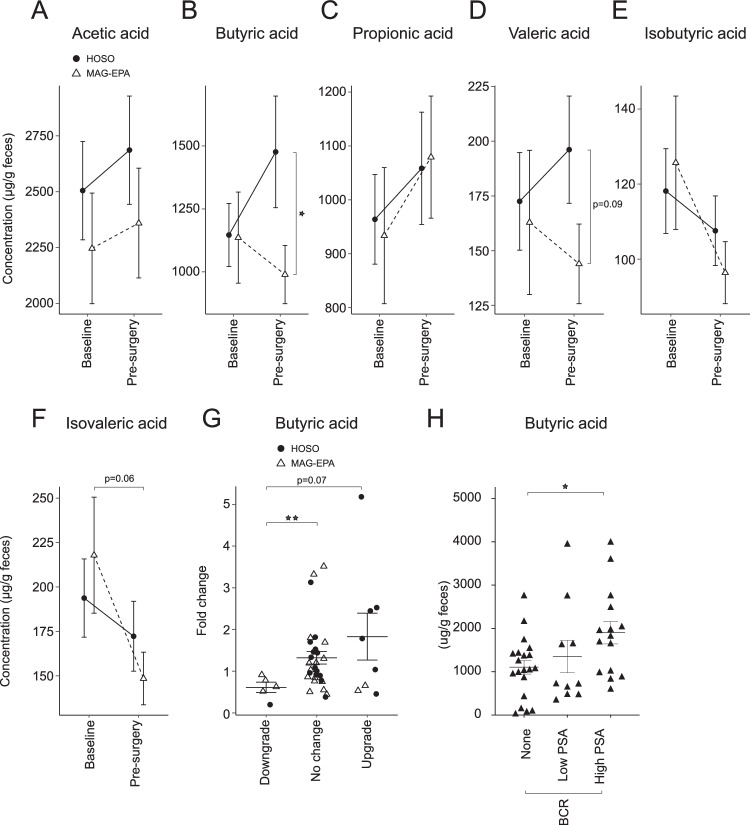
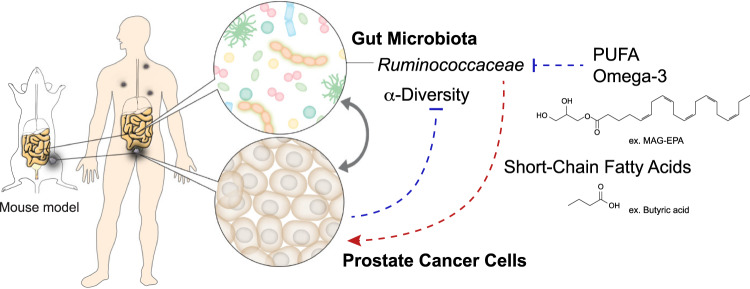
The gut microbiota modulates response to hormonal treatments in prostate cancer (PCa) patients, but whether it influences PCa progression remains unknown. Here, we show a reduction in fecal microbiota alpha-diversity correlating with increase tumour burden in two distinct groups of hormonotherapy naïve PCa patients and three murine PCa models. Fecal microbiota transplantation (FMT) from patients with high PCa volume is sufficient to stimulate the growth of mouse PCa revealing the existence of a gut microbiome-cancer crosstalk. Analysis of gut microbial-related pathways in mice with aggressive PCa identifies three enzymes responsible for the metabolism of long-chain fatty acids (LCFA). Supplementation with LCFA omega-3 MAG-EPA is sufficient to reduce PCa growth in mice and cancer up-grading in pre-prostatectomy PCa patients correlating with a reduction of gut Ruminococcaceae in both and fecal butyrate levels in PCa patients. This suggests that the beneficial effect of omega-3 rich diet is mediated in part by modulating the crosstalk between gut microbes and their metabolites in men with PCa.


Conflict of interest statement

The authors declare no competing interests.

Figures

Fig. 1
Fig. 1. Association of the gut microbiota with tumour volume and aggressiveness in prostate cancer patients.
a Tumour volume from prostate cancer patients treated by radical prostatectomy was estimated based on the % of cancer tissue identified at the pathological examination and the total prostate mass (g) at surgery (n = 62 total, low n = 19, medium n = 20, high n = 23). Two-sided Welch’s t-test was used for comparing groups. b Metataxonomic analysis at the phylum level of fecal samples from patients with different prostate tumour burden described in (a), fecal samples were harvested 5.0 ± 0.5 weeks before surgery. c Shannon diversity index at family taxonomic level of 16S rRNA sequences associated with fecal samples from prostate cancer patients with different tumour burden described in (a). Two-sided Welch’s t-test was used for comparing groups. d Bray-Curtis beta-diversity analysis at the family taxonomic level and Principal Component Analysis (PCA) representation for the fecal microbiota corresponding to samples in (a). e Blood PSA levels from prostate cancer patients recently treated by radical prostatectomy, either without any biochemical recurrence (BCR-None, n = 20), with early (Low PSA 0.05–0.49 ng/mL, mean PSA 0.17 ng/mL, SE ± 0.02, n = 9) or definitive BCR (PSA > 0.5 ng/mL, mean 2.96 ng/mL, SE ± 0.46, n = 18). Two-sided Welch’s t-test was used for comparing groups. f Metataxonomic analysis at the phylum level of fecal samples from patients in (e). Two-sided Welch’s t-test was used for comparing groups. g Shannon diversity index at family taxonomic level of 16S rRNA sequences associated with fecal samples from prostate cancer patients described in (e). Two-sided Welch’s t-test was used for comparing groups. h Bray-Curtis beta-diversity analysis at the family taxonomic level and PCA representation for the fecal microbiota corresponding to sample in (e). Graphs are mean ± SEM.
Fig. 2
Fig. 2. Ectopic prostate tumour development triggers changes in the fecal microbiota in independent syngeneic mouse models.
a Growth phases analysis of TRAMP-C2 tumour cells injected into the flank of immunocompetent single-housed C57BL/6 N mice (n = 12/group). b Relative abundance of bacterial phyla of fecal samples harvested from tumour-free animals (baseline) and three time points corresponding to minimal masses (first detectable tumour), actively growing and late stage (end point) TRAMP-C2 tumours (n = 8/group). p = 8e−4, two-sided Welch’s t-test was used for comparing groups. c Shannon diversity index at family taxonomic level of 16S rRNA sequences associated with fecal samples harvested from single-housed C57BL/6 N mice injected with TRAMP-C2 prostate tumour at different development stages (n = 8/group). p = 3e−4, p = 2e−4, for active growth and end point, respectively, two-sided Welch’s t-test was used for comparing groups. d Bray-Curtis beta diversity analysis and PCA visualization of 16S rRNA sequences associated with fecal samples from mice injected with TRAMP-C2 prostate cancer cells and at different phases of tumour development (n = 8/group). e Tumour volume analysis at the 4 week time-point of immunocompetent C57BL/6 J mice injected with syngeneic Pten−/− or Pten−/−; Rb1−/− prostate tumour cells or control animals without tumour cells (n = 8/group). p = 6e−4, two-sided Welch’s t-test was used for comparing groups. f Relative abundance of bacterial phyla of fecal samples harvested from tumour-free animals (no tumour) and mice bearing Pten−/− or Pten−/−; Rb1−/− prostate tumours (n = 8/group) 4 weeks after tumour cell injections. p = 0.01 for firmicutes and p = 0.001 for actinobacteria, two-sided Welch’s t-test was used for comparing groups. g Shannon diversity index at family taxonomic level of 16S rRNA sequences associated with fecal samples from single-housed tumour-free C57BL/6 J animals (no tumour) and animals with either Pten−/− or Pten−/−; Rb1−/− prostate tumours (n = 8/group). p = 0.02, two-sided Welch’s t-test was used for comparing groups. h Bray-Curtis beta diversity analysis and PCA visualization of 16S DNA sequences associated with fecal samples from mice injected with Pten−/− and Pten−/−; Rb1−/− prostate tumour cells and different tumour burden (n = 8/group). Graphs are mean ± SEM.
Fig. 3
Fig. 3. Causal impact of the gut microbiota on prostate cancer.
a Total DNA was extracted from feces of C57BL/6 N mice at baseline, after 1 week of antibiotic (Abx) treatment and after series of two fecal microbiota transplants (FMT). Microbiota depletion was performed by Abx treatment and mice were rescued with their pre-Abx fecal microbiota transplant (mFMT, n = 4 mice) or transplanted with fecal samples from six independent patients with grade group ≥2 localized prostate cancer (n = 4 mice/group for hFMT1, 2, 4, 5, 6 and n = 8 mice for hFMT3). The hFMT3 was repeated twice in two different experiments. b Gifu Anaerobic Media (GAM) broth cultures of fecal samples from mice before (baseline) and after 4 days of Abx treatments (Abx, n = 16), controls were mice untreated (n = 4). c C57BL/6 N Abx-pretreated mice received two FMT from 6 independent patients with localized prostate tumor. After the FMTs, mice were injected with TRAMP-C2 prostate tumour cells and tumour mass was measured at sacrifice, 5 weeks after tumour cells injections (n = 4 mice/group for hFMT1, 4, 5, 6, n = 3 mice for hFMT2 and n = 8 mice for hFMT3). p = 0.006 (hFMT2), p = 0.007 (hFMT3), p = 0.04 (hFMT4) and p = 0.01 (hFMT5), Student’s t-test. d The data in (c) was compiled based on the donor’s tumor volume at the pathological analysis and corresponding to the tertiles defined in Fig. 1a (n = 4 mice for mFMT, n = 7 low tumour volume hFMTs, n = 8 medium tumour volume hFMTs and n = 12 High tumour volume hFMTs), p = 0.04 (Low), p = 0.007 (Medium) and p = 0.04 (High), Student’s t-test. e GAM broth cultures of fecal samples from mice before corresponding to (d) (n = 4 mice for mFMT, n = 7 low tumour volume hFMTs, n = 8 medium tumour volume hFMTs and n = 12 High tumour volume hFMTs), p = 0.03, two-sided Welch’s t-test. Graphs are mean ± SEM.
Fig. 4
Fig. 4. Common fecal 16S rRNA-related signatures in three independent models of prostate cancer.
a Differential enrichment of bacterial genera from mice with TRAMP-C2 tumours at the end point growth stage (late tumour growth) and the baseline before tumour cell injection (n = 8 mice/group). b Differential enrichment of bacterial genera corresponding to mice with Pten−/−; Rb1−/− tumours and tumour-free mice (n = 8 mice/group). c Relative abundance, in percentage (%) of total 16S rRNA sequences, of Parabacteriodetes 16S rRNA (left, p = 0.003 (Active growth) and p = 0.02 (End point), Welch’s t-test) and Lactobacillus 16S rRNA (right, p = 0.05 (Active growth), Welch’s t-test) from fecal samples of mice with TRAMP-C2 tumour harvested at different stages of prostate cancer development (n = 8 mice/group). d Relative abundance, in % of total 16S rRNA sequences, of Parabacteriodetes 16S rRNA (left, p = 0.02, Welch’s t-test) and Lactobacillus 16S rRNA (right, p = 0.003 (Pten−/−; Rb1+/+) and p = 0.04 (Pten−/−; Rb1−/−), Welch’s t-test) from fecal samples of mice without tumour, with Pten−/−; Rb1+/+ or Pten−/−; Rb1−/−, tumours (n = 8 mice/group). e Ven diagram of a PICRUSt analysis of functions predicted to be enriched in fecal samples from TRAMP-C2 tumours at end point compared to baseline controls. The enrichment of predicted function was also performed for Pten−/−; Rb1+/+ and Pten−/−; Rb1−/− tumours and compared to no-tumour controls is also shown. f The 7 predicted functions between fecal tumour samples and controls that were commonly enriched between mice bearing TRAMP-C2, Pten−/−; Rb1+/+ and Pten−/−; Rb1−/− tumours, following a PICRUSt analysis are displayed. Graphs in (a, b) are mean ± SD. Graphs in (c, d) are mean ± SEM, Welch’s t-test.
Fig. 5
Fig. 5. Functional interactions between long-chain polyunsaturated fatty acid, gut microbiota and prostate cancer development.
a TRAMP-C2 tumour growth in mice pre-treated with different purified versions of long-chain polyunsaturated fatty acids (PUFA); monoglyceride arachidonic acid (MAG-AA), MAG-docosahexaenoic acid (DHA) or MAG-eicosapentaenoic acid (EPA) and control high oleic sunflower oil (HOSO) (n = 12/group). p ≤ 0.05, Welch’s t-test. b Relative abundance, in % of total 16S rRNA sequences, of Ruminococcaceae 16srRNA from fecal DNA samples of mice with TRAMP-C2 pre-treated with different PUFA molecules (n = 8/group). p ≤ 0.05, Welch’s t-test. c qPCR validation of Ruminococcaceae 16S rRNA levels from fecal DNA samples of mice with TRAMP-C2 pre-treated with PUFA molecules. Data is presented as relative levels (fold change) normalized to total 16S rRNA sequences (n = 12/group). p ≤ 0.05, Welch’s t-test. d Relative abundance of Ruminococcaceae from fecal DNA samples of patients in relation to their prostate tumour grade change (Gleason score from histopathological analysis of prostate tumour at surgery compared to histological score of the biopsy of study enrolment), p ≤ 0.05, Welch’s t test. e A randomized clinical trial (NCT02333435) was performed at our clinical facility testing the effect of MAG-EPA PUFA on prostate cancer patients before radical prostatectomy. A subset of 41 patients donated fecal samples for research at study baseline and the morning before surgery, 7.2 ± 0.37 weeks later. Change in prostate tumour grade was compared between patients receiving MAG-EPA or placebo 7 weeks prior to surgery. The percentage of patients without any change in their cancer grade, with apparent downgrade or upgrade in their prostate cancer grade group score is shown as a fraction of the total cases per group. Statistical test was Chi square comparing % for the 3 categories between MAG-EPA (n = 21) and placebo control (n = 20). p ≤ 0.05, chi square test. f Using DNA extracted from fecal samples corresponding to (e), we used 16S rRNA metataxonomic to compare the profiles corresponding to men before and after 7.2 ± 0.37 weeks of MAG-EPA (n = 21) supplementation or placebo (n = 20). The relative abundance of sequences corresponding to Ruminococcaceae is shown, p ≤ 0.05, Paired–Wilcoxon test. Line colors represent Ruminococcaceae enrichment (red), depletion (green) or no change (grey). Graphs are mean ± SEM.
Fig. 6
Fig. 6. A dietary intervention reduces fecal short-chain fatty acid (SCFA) levels in prostate cancer patients.
Gas chromatography coupled with flame ionization detection (GC-FID) was used to measure the levels of different SCFA from feces of prostate cancer patients at baseline and after daily supplementation of monoglyceride eicosapentaenoic acid (MAG-EPA) PUFA (n = 21) or control of high oleic sunflower oil (HOSO) (n = 21) for 7.2 ± 0.37 weeks before radical prostatectomy. The different SCFAs measured were; (a) Acetic acid, (b) Butyric acid (p = 0.04, Welch’s t-test). c Propionic acid, (d) Valeric acid, (e) Isobutyric acid, (f) Isovaleric acid. g Fecal butyric acid levels were compared between baseline and pre-surgery for prostate cancer patients (n = 41). Fold change in butyric acid levels was associated with downgrade, no change or an upgrade of prostate cancer between radical prostatectomy and enrolment biopsy (p = 0.002, Welch’s t-test). h Fecal butyric acid levels were measured in patient samples corresponding to Fig. 1e and presented in relation to PSA biochemical recurrence (BCR) status (p = 0.02, Welch’s t-test). Graphs are mean ± SEM.
Fig. 7
Fig. 7. Proposed mechanism of gut microbiome-prostate cancer crosstalk.
Schematic representation for the proposed interaction between dietary long-chain polyunsaturated fatty acids (PUFA) omega-3, the gut microbiota and prostate cancer.

Similar articles

Cited by

References

    1. Golombos DM, et al. The role of gut microbiome in the pathogenesis of prostate cancer: a prospective, pilot study. Urology. 2018;111:122–128. doi: 10.1016/j.urology.2017.08.039. - DOI - PubMed
    1. Liss MA, et al. Metabolic biosynthesis pathways identified from fecal microbiome associated with prostate cancer. Eur. Urol. 2018;74:575–582. doi: 10.1016/j.eururo.2018.06.033. - DOI - PMC - PubMed
    1. Porter CM, Shrestha E, Peiffer LB, Sfanos KS. The microbiome in prostate inflammation and prostate cancer. Prostate Cancer Prostatic Dis. 2018;21:345–354. doi: 10.1038/s41391-018-0041-1. - DOI - PubMed
    1. Daisley BA, et al. Abiraterone acetate preferentially enriches for the gut commensal Akkermansia muciniphila in castrate-resistant prostate cancer patients. Nat. Commun. 2020;11:4822. doi: 10.1038/s41467-020-18649-5. - DOI - PMC - PubMed
    1. Sfanos KS, et al. Compositional differences in gastrointestinal microbiota in prostate cancer patients treated with androgen axis-targeted therapies. Prostate Cancer Prostatic Dis. 2018;21:539–548. doi: 10.1038/s41391-018-0061-x. - DOI - PMC - PubMed

Publication types

Substances