. 2024 Jun;31(6):779-791.
doi: 10.1038/s41418-024-01295-5. Epub 2024 Apr 23.

Zeb1-controlled metabolic plasticity enables remodeling of chromatin accessibility in the development of neuroendocrine prostate cancer

Affiliations

Zeb1-controlled metabolic plasticity enables remodeling of chromatin accessibility in the development of neuroendocrine prostate cancer

Deng Wang et al. Cell Death Differ. 2024 Jun.

Abstract

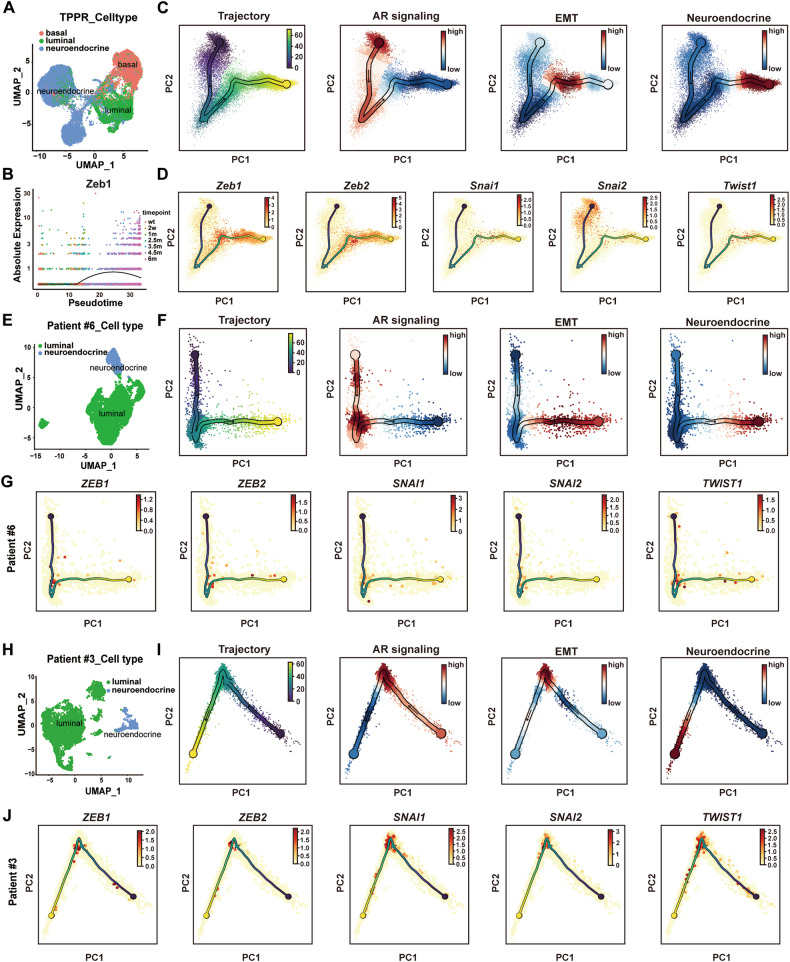
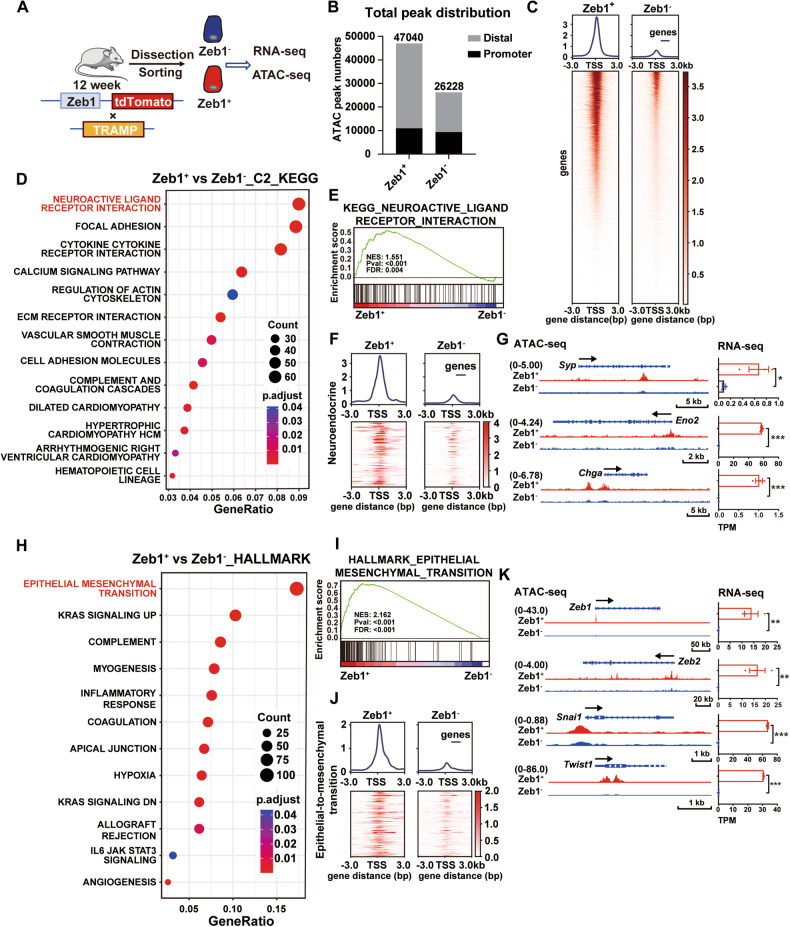
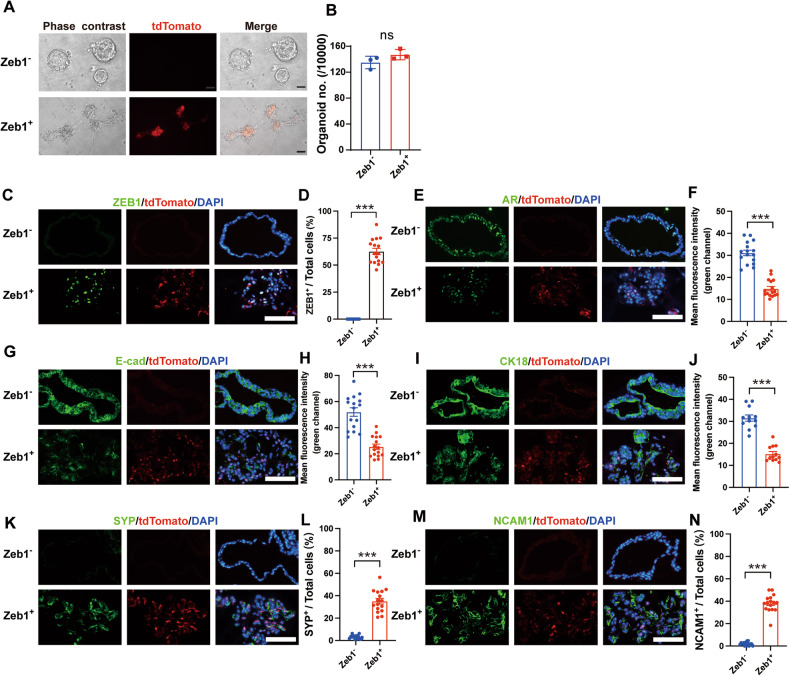
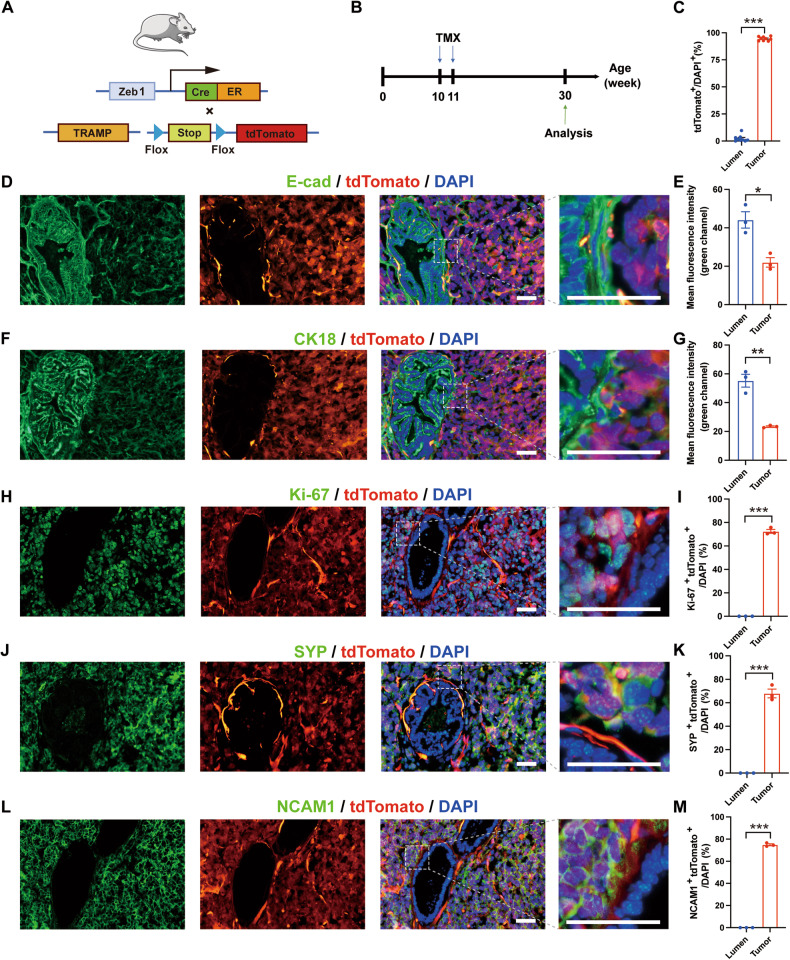
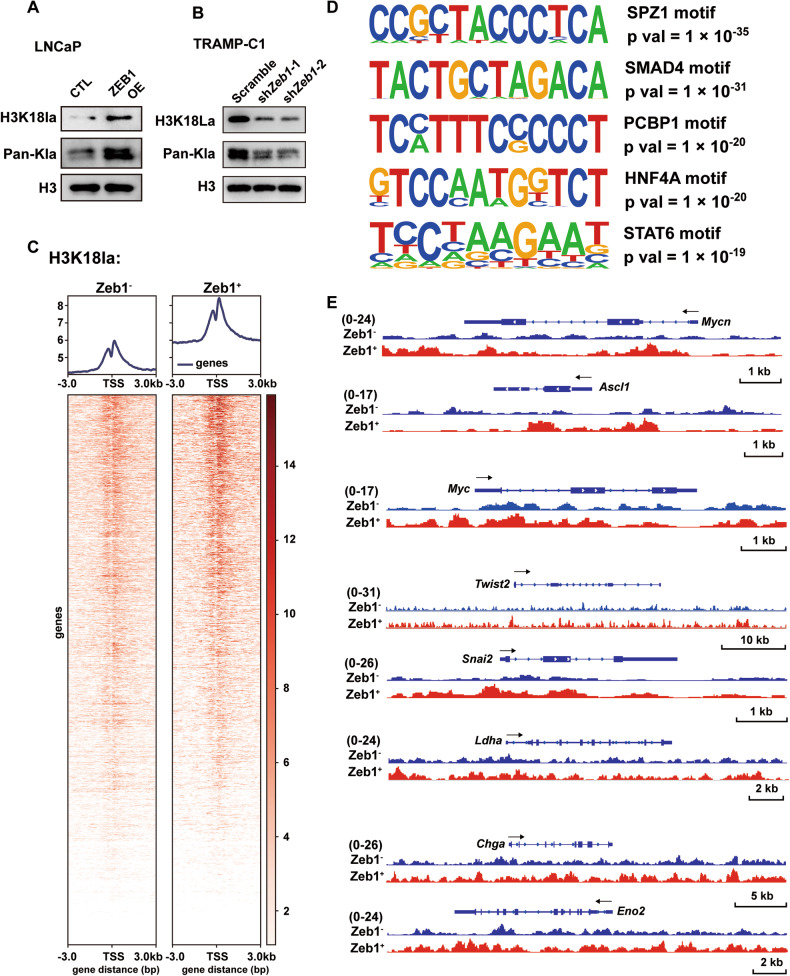
Cell plasticity has been found to play a critical role in tumor progression and therapy resistance. However, our understanding of the characteristics and markers of plastic cellular states during cancer cell lineage transition remains limited. In this study, multi-omics analyses show that prostate cancer cells undergo an intermediate state marked by Zeb1 expression with epithelial-mesenchymal transition (EMT), stemness, and neuroendocrine features during the development of neuroendocrine prostate cancer (NEPC). Organoid-formation assays and in vivo lineage tracing experiments demonstrate that Zeb1+ epithelioid cells are putative cells of origin for NEPC. Mechanistically, Zeb1 transcriptionally regulates the expression of several key glycolytic enzymes, thereby predisposing tumor cells to utilize glycolysis for energy metabolism. During this process, lactate accumulation-mediated histone lactylation enhances chromatin accessibility and cellular plasticity including induction of neuro-gene expression, which promotes NEPC development. Collectively, Zeb1-driven metabolic rewiring enables the epigenetic reprogramming of prostate cancer cells to license the adeno-to-neuroendocrine lineage transition.


Conflict of interest statement

The authors declare no competing interests.

Figures

Fig. 1
Fig. 1. Zeb1 is dynamically expressed during the course of NEPC development.
A Image of prostates or prostate tumors of Zeb1/tdTomato; TRAMP mice at 4 weeks, 8 weeks, 12 weeks, 5 months and 7 months of age. Scale bars = 1 cm. B H&E staining showing typical histology of prostates or prostate tumors in Zeb1/tdTomato; TRAMP mice at different ages. Scale bars = 2 mm (top panel), scale bars = 50 μm (bottom panel). C, D Proportion (C) and statistics (D) of tdTomato+ (Zeb1+) cells in the Lineage CD49f+ Sca-1 luminal cells of prostates or prostate tumors of Zeb1/tdTomato; TRAMP mice at different ages by flow cytometry (n = 4 mice) (Two-tailed Student’ s t-test was used for the statistical analysis: *P < 0.05; **P < 0.01; ***P < 0.001. Data are presented as mean ± SEM). E, F Immunofluorescent staining images of tdTomato and CK18 (E) or SYP (F) in the prostates or prostate tumors of Zeb1/tdTomato; TRAMP mice at different ages. Representative images are presented. Scale bars = 50 μm.
Fig. 2
Fig. 2. Single-cell sequencing data reveal dynamic changes of Zeb1 expression during human and mouse NEPC development.
A UMAP visualization of epithelial cell profiles in TPPR mouse scRNA-seq. Data were obtained from Han et al. [25] (OMIX: OMIX001928). B Zeb1 expression levels in pseudotime analysis of TPPR mice scRNA-seq [25] using Monocle 2. C, D Trajectory inference using scFates to analyze gene expression dynamics in prostate epithelial cells of TPPR mice [25]. Pseudotime analysis of gene sets of AR signaling, EMT and neuroendocrine signatures (C) and expression of specific EMT genes (D). E UMAP visualization of epithelial cell profiles from human PCa patient #6. Data were obtained from Baijun Dong et al.[3] (GEO: GSE137829). F, G Trajectory inference using scFates to analyze gene expression dynamics in PCa epithelial cells of patient #6 [3]. Pseudotime analysis of gene sets of AR signaling, EMT and neuroendocrine signatures (F) and expression of specific EMT genes (G). H UMAP visualization of epithelial cell profiles from human PCa patient #3. Data were obtained from Wang et al. [31] (GSA-Human: HRA002145). I, J Trajectory inference using scFates to analyze gene expression dynamics in PCa epithelial cells of patient #3 [31]. Pseudotime analysis of gene sets of AR signaling, EMT and neuroendocrine signatures (I) and expression of specific EMT genes (J).
Fig. 3
Fig. 3. Zeb1+ epithelioid cells exhibit a more accessible chromatin with an expression characteristic of neuroactive and EMT program.
A Experimental strategy for epigenetic and transcriptional profiling of flow cytometry-sorted Lineage CD49f+ tdTomato (Zeb1) and Lineage CD49f+ tdTomato+ (Zeb1+) cells from prostates of Zeb1/tdTomato; TRAMP mice around 12 weeks of age. B Total number of ATAC-seq peaks in Zeb1 and Zeb1+ epithelioid cells, separated into promoter (<±3 kb transcription start site [TSS]) and distal regions (>±3 kb TSS). C Heatmaps depicting chromatin accessibility based on ATAC-seq peaks from Zeb1 and Zeb1+ epithelioid cells. D Gene sets enriched in Zeb1+ epithelioid cells compared to the Zeb1 counterpart in KEGG enrichment analysis of RNA-seq. E GSEA analysis of RNA-seq of Zeb1+ epithelioid cells versus the Zeb1 counterpart in neuroactive ligand receptor interaction. F Heatmap depicting chromatin accessibility based on peaks of neuroendocrine gene set in ATAC-seq of Zeb1+ epithelioid cells and the Zeb1 counterpart. G ATAC-seq and RNA-seq of neuroendocrine indicator genes in Zeb1+ epithelioid cells and the Zeb1 counterpart. H Gene sets enriched in Zeb1+ epithelioid cells compared to the Zeb1 counterpart in Hallmark enrichment analysis of RNA-seq. I GSEA analysis of RNA-seq of Zeb1+ epithelioid cells versus the Zeb1 counterpart in epithelial-mesenchymal transition. J Heatmap depicting chromatin accessibility based on peaks of EMT gene set in ATAC-seq of Zeb1+ epithelioid cells and the Zeb1 counterpart. K ATAC-seq and RNA-seq of EMT lineage genes in Zeb1+ epithelioid cells and the Zeb1 counterpart (n = 2 mice for the ATAC-seq, n = 3 mice for the RNA-seq. Two-tailed Student’ s t-test was used for the statistical analysis: *P < 0.05; **P < 0.01; ***P < 0.001. Data are presented as mean ± SEM).
Fig. 4
Fig. 4. Zeb1+ epithelioid cells can generate organoids with neuroendocrine characteristics.
A Representative brightfield (phase contrast) and fluorescence images of organoids derived from flow cytometry-sorted Lineage CD49f+ tdTomato (Zeb1) and Lineage CD49f+ tdTomato+ (Zeb1+) cells from prostates of Zeb1/tdTomato; TRAMP mice around 12 weeks of age. The passage number is P1. Scale bars = 50 μm. B Quantification of the number of organoids derived from Zeb1 and Zeb1+ epithelioid cells. 10,000 Zeb1 or Zeb1+ epithelioid cells sorted by flow cytometry were seeded in a low-adsorption 96-well plate, cultured in organoid culture medium for 6 days, and then image acquisition and organoids counting were performed. Organoids larger than 50 μm in diameter were counted. The passage number is P1 (n = 3 replicates). C, E, G, I, K, M Immunofluorescent staining images of tdTomato with ZEB1 (C), AR (E), E-cad (G), CK18 (I), SYP (K), or NCAM1 (M) in frozen sections of organoids derived from Zeb1 and Zeb1+ epithelioid cells. Representative images are presented. The passage number is P2. Scale bars = 50 μm. D, L, N Proportion of ZEB1+ cells (D), SYP+ cells (L), or NCAM1+ cells (N) in frozen sections of organoids derived from Zeb1 and Zeb1+ epithelioid cells. 16 organoids (over 1200 cells) from each group were analyzed. F, H, J Fluorescence intensity of AR (F), E-cad cells (H), or CK18 cells (J) in frozen sections of organoids derived from Zeb1 and Zeb1+ epithelioid cells. 16 organoids from each group were analyzed. (Two-tailed Student’ s t-test was used for the statistical analysis: ns, not significant; *P < 0.05; **P < 0.01; ***P < 0.001. Data are presented as mean ± SEM).
Fig. 5
Fig. 5. Lineage tracing indicates that Zeb1+ epithelioid cells are the cellular origin of NEPC.
A Strategy for tracing tdTomato expression in Zeb1 progeny cells in vivo. B Illustration of protocols to track the fate of Zeb1+ cells during prostate tumorigenesis. C Ratios of tdTomato+ cells in the normal lumen and tumor areas of cryosections of mouse prostate tumors in the Zeb1-creERT2; tdTomato; TRAMP mice lineage tracing experiment (n = 9 mice). D, F, H, J, L Immunofluorescent staining of tdTomato with E-cad (D), CK18 (F), Ki-67 (H), SYP (J), or NCAM1 (L) in cryosections of mouse prostate tumors in the lineage tracing experiment. Representative images are presented. Scale bar = 50 μm. E, G Fluorescence intensity of E-cad (E) and CK18 (G) in the normal lumen and tumor areas of cryosections of mouse prostate tumors in the lineage tracing experiment (n = 3 mice). I, K, M Proportion of Ki-67+ tdTomato+ cells (I), SYP+ tdTomato+ cells (K), or NCAM1+ tdTomato+ (M) in the normal lumen and tumor areas of frozen sections of mouse prostate tumors in lineage tracing experiments (n = 3 mice).
Fig. 6
Fig. 6. Zeb1 promotes glycolysis and accumulation of lactate in PCa.
A Rank of hallmark metabolic pathways in flow cytometry-sorted Lineage CD49f+ tdTomato (Zeb1) and Lineage CD49f+ tdTomato+ (Zeb1+) cells from prostates of Zeb1/tdTomato; TRAMP mice around 12 weeks of age based on normalized enrichment score. B, C GSEA analysis of RNA-seq (B) and ATAC-seq (C) of Zeb1+ epithelioid cells versus the Zeb1 counterpart in the hallmark glycolysis gene set. D Schematic diagram of the glucose metabolic pathway. E qRT-PCR analysis of Zeb1, Hk1, Hk2, Pfkp, Pkm, Gapdh, Ldha and Pdha1 mRNA levels in Zeb1 and Zeb1+ epithelioid cells. Gene expression was normalized to the expression of Actb (n = 3 replicates). F, G Protein levels of ZEB1, HK1, HK2, PFKP, PKM1/2, GAPDH, LDHA and PDHA1 in control and Zeb1-overexpressing LNCaP cells (F), and in scramble and Zeb1-knockdown TRAMP-C1 cells (G) were determined by immunoblotting. H Genome views of ZEB1 enrichment at the HK2, PFKP, LDHA genes in MDA-MB231 cells from analysis of published ChIP-seq data [34]. ZEB1 peaks are depicted in red. I ChIP-q-PCR analysis showing enrichment levels of ZEB1 at the HK2, PFKP and LDHA promoters in Zeb1-overexpressing LNCaP cells (n = 3 replicates). J Lactate levels in Zeb1 and Zeb1+ epithelioid cells in flow cytometry-sorted 4-month-old Zeb1/tdTomato; TRAMP mice (n = 3 replicates). K Lactate levels in control and Zeb1-overexpressing LNCaP cells (n = 3 replicates) (Two-tailed Student’ s t-test was used for the statistical analysis: ns not significant; *P < 0.05; **P < 0.01; ***P < 0.001. Data are presented as mean ± SEM).
Fig. 7
Fig. 7. Lactate accumulation in Zeb1+ epithelioid cells enhances histone lactylation conferring lineage plasticity in PCa.
A, B Immunoblotting of Pan-Kla and H3K18 lactylation levels in control and Zeb1-overexpressing LNCaP cells (A), and in scramble and Zeb1-knockdown TRAMP-C1 cells (B). C Tag density pileups of H3K18la peaks in flow cytometry-sorted Lineage CD49f+ tdTomato (Zeb1) and Lineage CD49f+ tdTomato+ (Zeb1+) cells from prostates of Zeb1/tdTomato; TRAMP mice around 4 months of age. Two replicates were used for the CUT & Tag assay (n = 2 mice). D Motif analysis of H3K18la signal peaks in Zeb1+ epithelioid cells compared to the Zeb1 counterpart. SPZ1, SMAD4, PCBP1, HNF4A and STAT6 were matched to known motifs. E Genome views of H3K18la tag density at NEPC driver genes (Mycn and Ascl1), pluripotent gene (Myc), EMT genes (Twist2, Snai2), glycolysis-related gene (Ldha) and NE markers (Chga and Eno2) in Zeb1 and Zeb1+ epithelioid cells.

References

    1. Quintanal-Villalonga A, Chan JM, Yu HA, Pe’er D, Sawyers CL, Sen T, et al. Lineage plasticity in cancer: a shared pathway of therapeutic resistance. Nat Rev Clin Oncol. 2020;17:360–71. doi: 10.1038/s41571-020-0340-z. - DOI - PMC - PubMed
    1. Davies AH, Beltran H, Zoubeidi A. Cellular plasticity and the neuroendocrine phenotype in prostate cancer. Nat Rev Urol. 2018;15:271–86. doi: 10.1038/nrurol.2018.22. - DOI - PubMed
    1. Dong B, Miao J, Wang Y, Luo W, Ji Z, Lai H, et al. Single-cell analysis supports a luminal-neuroendocrine transdifferentiation in human prostate cancer. Commun Biol. 2020;3:778. doi: 10.1038/s42003-020-01476-1. - DOI - PMC - PubMed
    1. Soundararajan R, Paranjape AN, Maity S, Aparicio A, Mani SA. EMT, stemness and tumor plasticity in aggressive variant neuroendocrine prostate cancers. Biochim Biophys Acta Rev Cancer. 2018;1870:229–38. doi: 10.1016/j.bbcan.2018.06.006. - DOI - PMC - PubMed
    1. Zou M, Toivanen R, Mitrofanova A, Floch N, Hayati S, Sun Y, et al. Transdifferentiation as a mechanism of treatment resistance in a mouse model of castration-resistant prostate cancer. Cancer Discov. 2017;7:736–49. doi: 10.1158/2159-8290.CD-16-1174. - DOI - PMC - PubMed

MeSH terms

LinkOut - more resources