. 2024 Apr 24;19(1):37.
doi: 10.1186/s13024-024-00725-9.

Regulation of human microglial gene expression and function via RNAase-H active antisense oligonucleotides in vivo in Alzheimer's disease

Affiliations

Regulation of human microglial gene expression and function via RNAase-H active antisense oligonucleotides in vivo in Alzheimer's disease

Lina Vandermeulen et al. Mol Neurodegener. .

Abstract

Background: Microglia play important roles in maintaining brain homeostasis and neurodegeneration. The discovery of genetic variants in genes predominately or exclusively expressed in myeloid cells, such as Apolipoprotein E (APOE) and triggering receptor expressed on myeloid cells 2 (TREM2), as the strongest risk factors for Alzheimer's disease (AD) highlights the importance of microglial biology in the brain. The sequence, structure and function of several microglial proteins are poorly conserved across species, which has hampered the development of strategies aiming to modulate the expression of specific microglial genes. One way to target APOE and TREM2 is to modulate their expression using antisense oligonucleotides (ASOs).

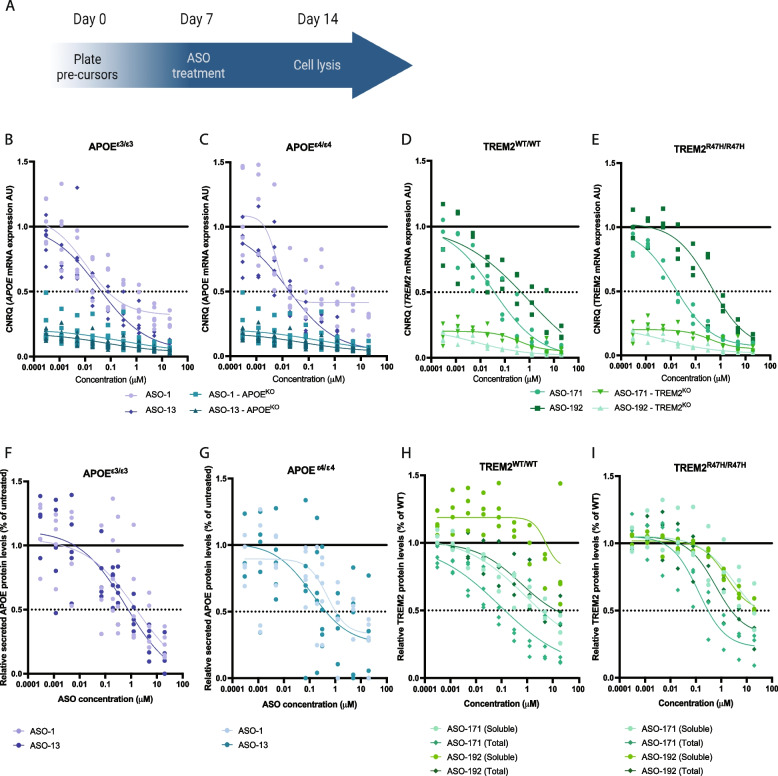
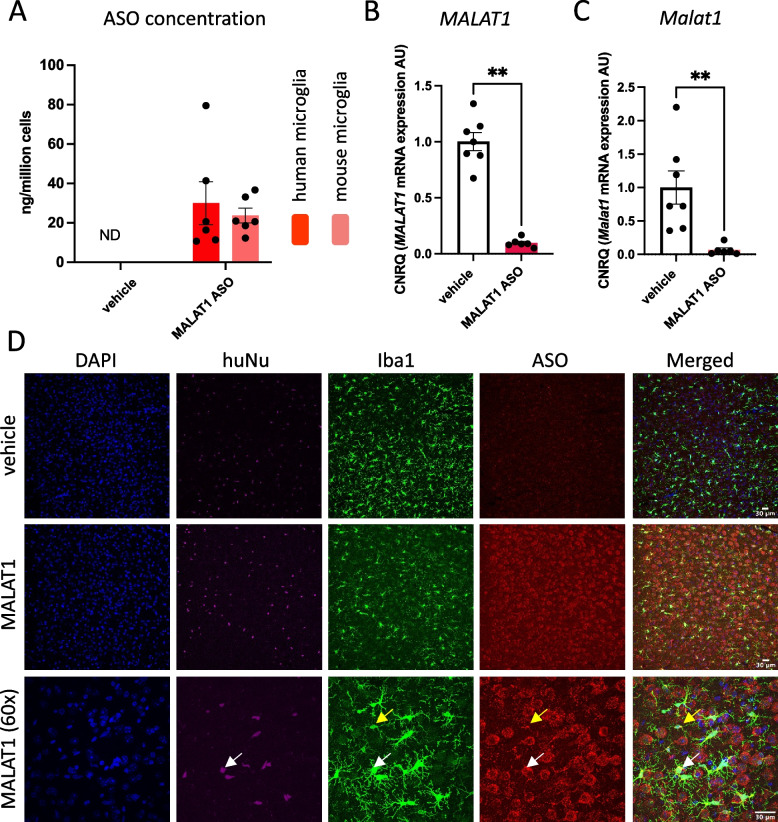
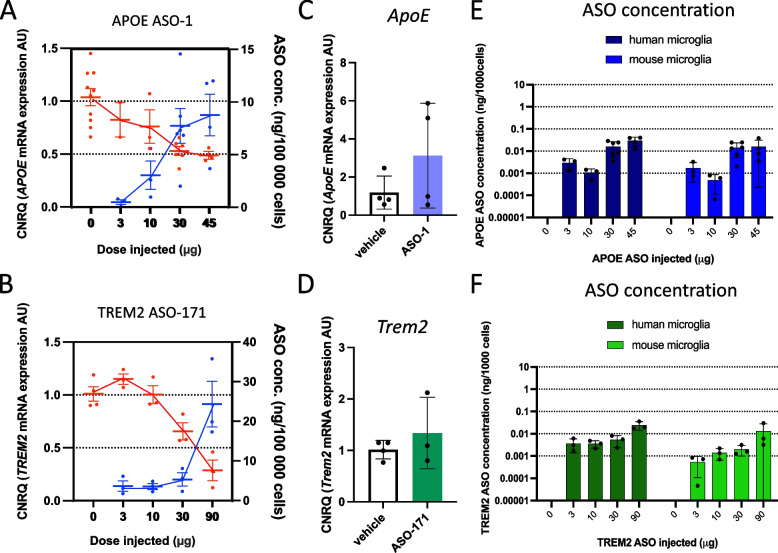
Methods: In this study, we identified, produced, and tested novel, selective and potent ASOs for human APOE and TREM2. We used a combination of in vitro iPSC-microglia models, as well as microglial xenotransplanted mice to provide proof of activity in human microglial in vivo.

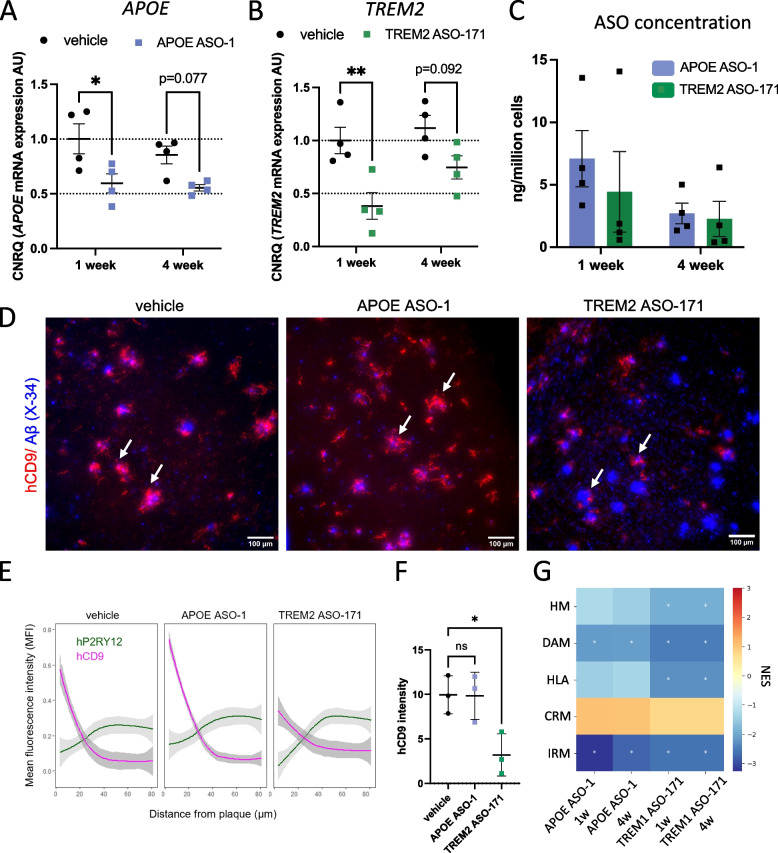
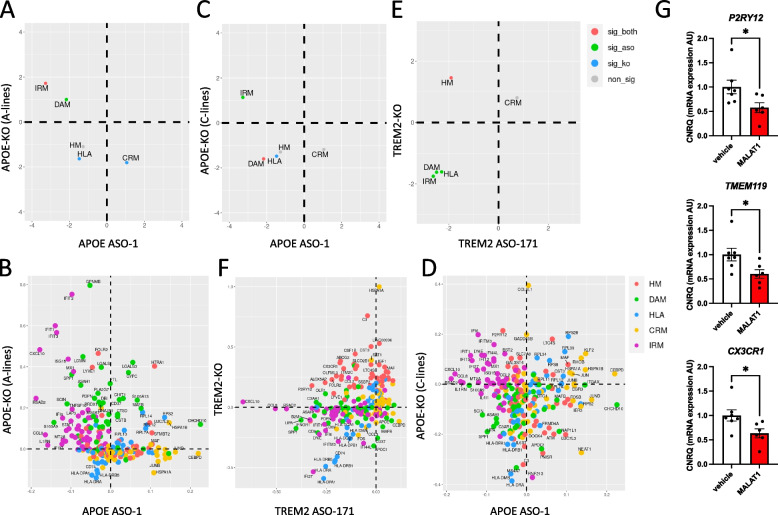
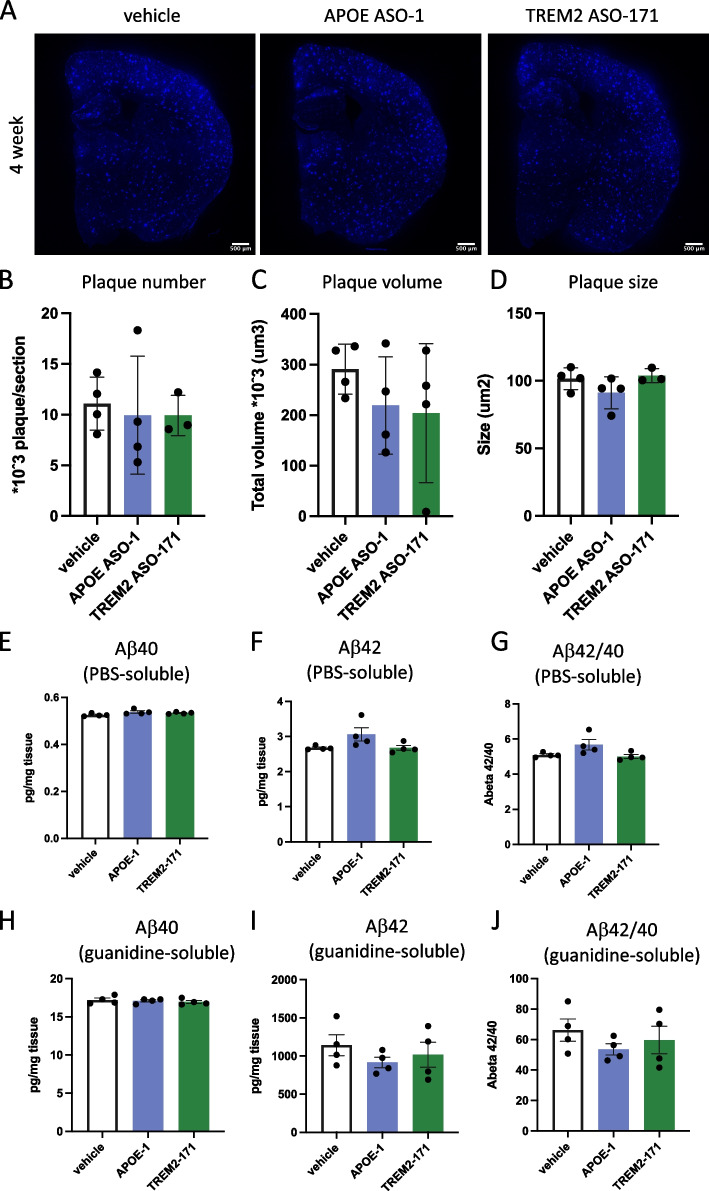
Results: We proved their efficacy in human iPSC microglia in vitro, as well as their pharmacological activity in vivo in a xenografted microglia model. We demonstrate ASOs targeting human microglia can modify their transcriptional profile and their response to amyloid-β plaques in vivo in a model of AD.

Conclusions: This study is the first proof-of-concept that human microglial can be modulated using ASOs in a dose-dependent manner to manipulate microglia phenotypes and response to neurodegeneration in vivo.

Keywords: APOE; Alzheimer’s disease; Antisense oligonucleotide; Microglia; Neuroinflammation; TREM2.


Conflict of interest statement

L.V., A.N., M.K., A.D.B., I.V.D.W. and C.D.Y. are employees of Janssen Pharmaceutica, pharmaceutical companies of Johnson&Johnson. I.G. and A.L. are employees of Muna Therapeutics since October 2022. B.D.S. is or has been a consultant for Eli Lilly, Biogen, Janssen Pharmaceutica, Eisai, AbbVie and other companies. B.D.S is also a scientific founder of Augustine Therapeutics and a scientific founder and stockholder of Muna Therapeutics. R.M. has scientific collaborations with Janssen Pharmaceutica, Alector and Nodthera and is consultant of Sanofi.

Figures

Fig. 1
Fig. 1
Target engagement of the lead APOE and TREM2 ASOs in cultured human microglia. A Experimental timelines for target engagement assessment of lead APOE and TREM2 ASOs in cultured iMGL. B,C Relative APOE mRNA levels were measured in cultured isogenic APOEε3/ε3 (B) and APOEε4/ε4 (C) iMGLs. Cultured isogenic APOEKO/KO iMGL were used as control. All iMGLs were treated with APOE ASO-1 or ASO-13. CNRQ = Calibrated Normalized Relative Quantities. N = 5. D,E Relative TREM2 mRNA levels were measured in cultured isogenic TREM2WT/WT (D) and TREM2R47H/R47H (E) iMGLs. Cultured isogenic TREM2KO/KO iMGL were used as control. All iMGLs were treated with TREM2 ASO-171 or ASO-192. CNRQ = Calibrated Normalized Relative Quantities. n = 3. F,G Relative secreted APOE protein levels medium were measured in culture media from isogenic APOEε3/ε3 (F) and APOEε4/ε4 (G) iMGLs treated with APOE ASO-1 or ASO-13. n = 6. H,I Relative soluble and total cellular TREM2 protein levels were measured in culture media and cellular extracts from cultured isogenic TREM2WT/WT (H) and TREM2R47H/R47H (I) iMGLs, respectively, treated with TREM2 ASO-171 or ASO-192. n = 4
Fig. 2
Fig. 2
ASOs are internalized and pharmacologically active in human microglia xenografted in mouse brain. A ASO concentration in human and mouse microglia isolated from 10–12-week-old xenotrasplanted mice 7 days after administration of 125µg MALAT1 targeting ASO. B,C Expression of human MALAT1 (B) and mouse Malat1 (C) in isolated human and mouse microglia, respectively, from mice treated with MALAT1 ASO compared to vehicle treated mice. D Representative images of widespread ASO distribution 7 days post MALAT1 ASO treatment. Human microglia were identified as Iba1 and huNu positive cells, and mouse microglia as Iba1 positive and huNu negative cells. Nuclei were visualized with DAPI. White arrow indicates an example of human microglia, while yellow arrow indicates a mouse microglia. Scale bars represent 30µm. CNRQ = Calibrated Normalized Relative Quantities. Bars represent mean ± SEM, n = 5–7/group. Statistical differences based on the Mann–Whitney test: **p < 0.01
Fig. 3
Fig. 3
(next page). Dose-dependent activity of APOE and TREM2 ASOs in human microglia xenografted in mouse brain. A,B Dose-dependent reduction in APOE (A) and TREM2 (B) expression in human microglia isolated from 10–12-week-old xenotransplanted mice 7 days after administration of APOE ASO-1 (A) or TREM2 ASO-171 (B) (red dots/line-knockdown level, blue dots/line-ASO concentration). (C,D) Expression of mouse ApoE (C) and Trem2 (D) in isolated mouse microglia after treatment with 45µg APOE ASO-1 (C) or 90µg TREM2 ASO-171 (D). CNRQ = Calibrated Normalized Relative Quantities Dots or bars represent mean ± SEM, n = 2–10/group. E–F ASO concentrations in human and mouse microglia isolated from 10–12-week-old xenotransplanted mice 7 days after administration of APOE ASO-1 (E) or TREM2 ASO-171 (F). Mean + SD, n = 3
Fig. 4
Fig. 4
Phenotypic and transcriptomic changes in human microglia upon ASO mediated APOE and TREM2 knockdown. A,B APOE (A) and TREM2 (B) expression in human microglia isolated from 6-month-old AppNL−G−F mice treated with 45ug APOE ASO-1 (A) or 90ug TREM2 ASO-171 (B) for 1 or 4 weeks. C ASO concentration in human microglia isolated from 6-month-old AppNL−G−F mice treated with APOE ASO-1 or TREM2 ASO-171 for 1 or 4 weeks. CNRQ = Calibrated Normalized Relative Quantities. Dots or bars represent mean ± SEM, n = 4/group. Statistical differences based on Two-way ANOVA test: *p < 0.05, **p < 0.01. D Representative images showing activated human microglia targeting X-34 positive amyloid-β fibrils 4 weeks post APOE and TREM2 knockdown. Arrow indicates an instance of activated human microglia around plaques. Scale bars = 100 µm (E) Quantification of mean fluorescence intensity for hP2RY12 and hCD9 at varying distances from the plaque assessed 4 weeks following ASOs treatment. F Quantification of hCD9 intensity at the plaque site (10 µm) normalized against signal intensity at the distal site from the plaque (74 – 81 µm) 4 weeks post ASOs treatment. Analysis was restricted to plaques surrounded by engrafted human microglia, determined by hP2RY12 signal (see Suppl Fig. 11A). Data represented as mean ± SD, n = 3/group. Statistical significance was evaluated with One-way ANOVA test (*p < 0.05, ns, not significant). G Gene set enrichment analysis (GSEA): Pre-ranked results of the microglial subtype gene sets (top 50 most significantly up-regulated genes of each microglial subtype [22]). The color represents the Normalized Enrichment Score (NES) of each gene set against the full list of genes ranked by the log-fold change when comparing the treatment group against the vehicle group. The asterisk indicates gene sets that are significantly enriched with FDR *p < 0.05. All analysis were performed on xenotransplanted microglia isolated from 6–7-month-old AppNL−G−F mice treated with APOE ASO-1 or TREM2 ASO-171 for 1 or 4 weeks
Fig. 5
Fig. 5
Comparison of transcriptional profiles between ASO mediated APOE and TREM2 knockdown with full APOE-KO and TREM2-KO human microglia. A,C,E Gene set enrichment analysis (GSEA): Pre-ranked enrichment scores of the microglial subtype marker gene sets under knockout and ASO treatment. Each point represents the GSEA Normalised Enrichment Score of the gene set (top 50 marker genes of the labelled microglial subtype) against the full list of genes ranked by the log-fold change when comparing the ASO treatment group against the vehicle group (x-axis) and the knockout group against the control group (y-axis). Significant GSEA enrichment is denoted by FWER < 0.05. B Scaled log fold changes in gene expression between APOE knockout and control A-lines (y-axis), and APOE ASO-1 treatment and the vehicle at 1 week (x-axis) of the top 50 marker genes from each microglial subtype. D Scaled log fold changes in gene expression between APOE knockout and control C-lines (y-axis), and APOE ASO-1 treatment and the vehicle at 1 week (x-axis) of the top 50 marker genes from each microglial subtype (F) Scaled log fold changes in gene expression between TREM2 knockout and control (y-axis), and TREM2 ASO-171 treatment and the vehicle at 1 week (x-axis) of the top 50 marker genes from each microglial subtype. Since the Knockout experiment and the ASO treatment experiments were performed under different experimental conditions, the Log2fold change of each DE analysis was scaled to -1 and 0 for LFC < 0 and 0 to 1 for LFC > 0. All analysis were performed on xenotransplanted microglia isolated from 6–7-month-old AppNL−G−F mice. G Expression of microglia homeostatic markers, P2RY12, TMEM119 and CX3CR1 in human microglia isolated from 10–12-week-old xenotrasplanted mice 7 days after administration of 125ug MALAT1 targeting ASO compared to vehicle treated mice. CNRQ = Calibrated Normalized Relative Quantities. Bars represent mean ± SEM, n = 5–7/group. Statistical differences based on the Mann–Whitney test: *p < 0.05
Fig. 6
Fig. 6
Treatment with ASO’s targeting APOE and TREM2 does not affect amyloid burden in APPNL−G−F mice. A Representative images of immunofluorescent analysis of amyloid plaques. Plaques were visualized with X-34. Scale bar represents 500um. B-C Quantification of X34-stained amyloid plaques; plaque numbers (B), total plaque volume (C) and average plaque size D was analyzed. E–G Levels of Ab40 (E) and Ab42 (F), and Ab42/40 (G) ratio in PBS-soluble fraction of brain homogenates. H-J Levels of Ab40 (H) and Ab42 (I), and Ab42/40 (J) ratio in guanidine-soluble fraction of brain homogenates. Bars represent mean ± SEM, n = 4/group

Similar articles

Cited by

References

    1. Sims R, et al. Rare coding variants in PLCG2, ABI3 and TREM2 implicate microglial-mediated innate immunity in Alzheimer’s disease. Nat Genet. 2017;49:1373. doi: 10.1038/ng.3916. - DOI - PMC - PubMed
    1. Colonna M, Butovsky O. Microglia Function in the Central Nervous System During Health and Neurodegeneration. Annu Rev Immunol. 2017;35:441–468. doi: 10.1146/annurev-immunol-051116-052358. - DOI - PMC - PubMed
    1. Schafer DP, Stevens B. Microglia Function in Central Nervous System Development and Plasticity. Cold Spring Harb Perspect Biol. 2015;7(10):a020545. doi: 10.1101/cshperspect.a020545. - DOI - PMC - PubMed
    1. Perry VH, Andersson PB, Gordon S. Macrophages and inflammation in the central nervous system. Trends Neurosci. 1993;16:268–273. doi: 10.1016/0166-2236(93)90180-T. - DOI - PubMed
    1. Kreutzberg GW. Microglia: a sensor for pathological events in the CNS. Trends Neurosci. 1996;19:312–318. doi: 10.1016/0166-2236(96)10049-7. - DOI - PubMed

Publication types

MeSH terms