. 2024 Apr 23:7:0365.
doi: 10.34133/research.0365. eCollection 2024.

Diabetes Primes Neutrophils for Neutrophil Extracellular Trap Formation through Trained Immunity

Affiliations

Diabetes Primes Neutrophils for Neutrophil Extracellular Trap Formation through Trained Immunity

Sanjeeb Shrestha et al. Research (Wash D C). .

Abstract

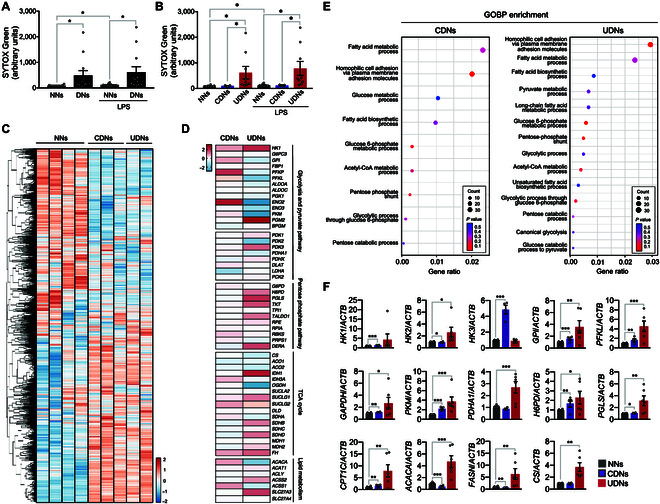
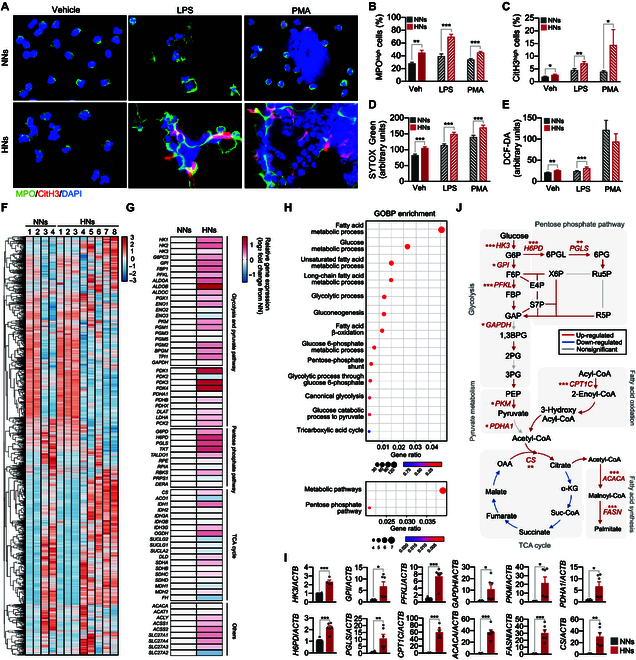
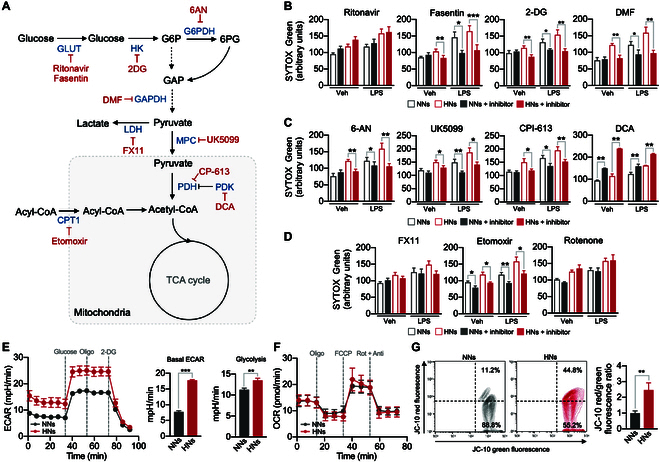
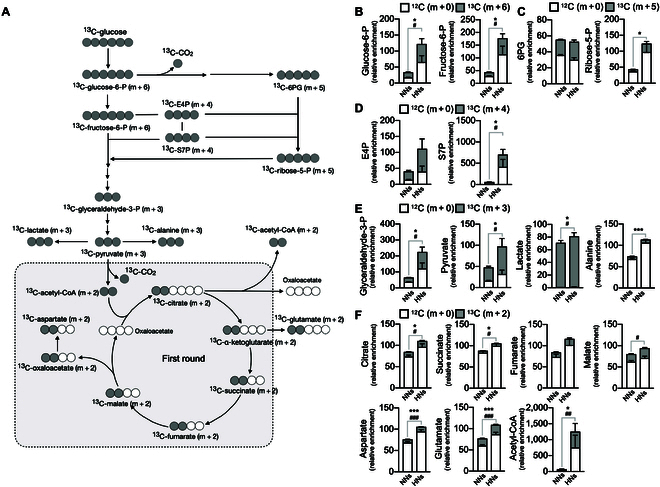
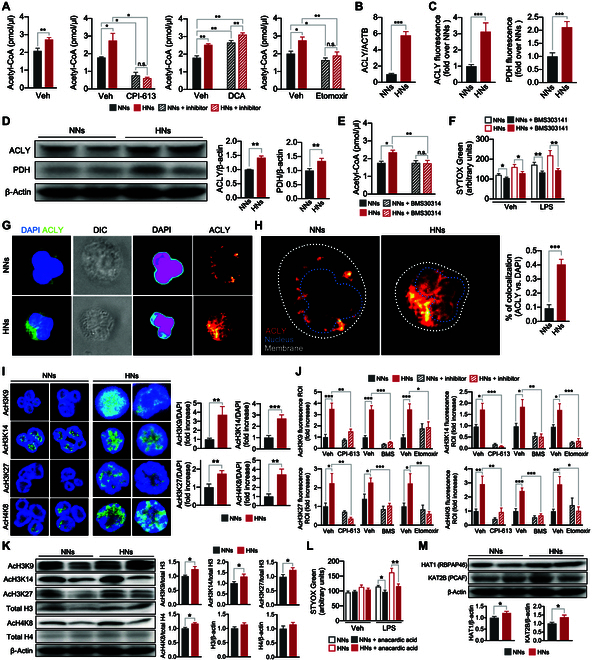
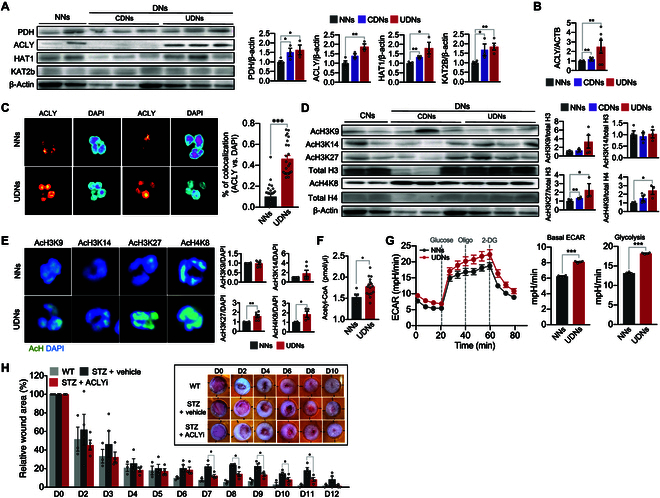
Neutrophils are primed for neutrophil extracellular trap (NET) formation during diabetes, and excessive NET formation from primed neutrophils compromises wound healing in patients with diabetes. Here, we demonstrate that trained immunity mediates diabetes-induced NET priming in neutrophils. Under diabetic conditions, neutrophils exhibit robust metabolic reprogramming comprising enhanced glycolysis via the pentose phosphate pathway and fatty acid oxidation, which result in the accumulation of acetyl-coenzyme A. Adenosine 5'-triphosphate-citrate lyase-mediated accumulation of acetyl-coenzyme A and histone acetyltransferases further induce the acetylation of lysine residues on histone 3 (AcH3K9, AcH3K14, and AcH3K27) and histone 4 (AcH4K8). The pharmacological inhibition of adenosine 5'-triphosphate-citrate lyase and histone acetyltransferases completely inhibited high-glucose-induced NET priming. The trained immunity of neutrophils was further confirmed in neutrophils isolated from patients with diabetes. Our findings suggest that trained immunity mediates functional changes in neutrophils in diabetic environments, and targeting neutrophil-trained immunity may be a potential therapeutic target for controlling inflammatory complications of diabetes.


Conflict of interest statement

Competing interests: The authors declare that they have no competing interests.

Figures

Fig. 1.
Fig. 1.
Metabolic reprogramming in neutrophils isolated from patients with diabetes. (A and B) Priming for NET formation in neutrophils isolated from patients with diabetes. Neutrophils were isolated from patients with diabetes (DNs) or healthy volunteers (NNs) in the presence or absence of LPS (10 μg/ml), and NET formation was analyzed using SYTOX Green staining. CDNs, neutrophils isolated from diabetic patients with controlled levels of HbA1c in serum; UDNs, neutrophils isolated from diabetic patients with uncontrolled levels of HbA1c. n = 12 per group. (C to E) RNA sequencing analysis of NNs (n = 4) and DNs (CDNs, n = 3; UDNs, n = 2). (C) Heatmap representations of DEGs in NNs and DNs. (D) Heatmap depicting DEG analysis of metabolic profiles of DNs with respect to NNs. (E) GO enrichment analysis of up-regulated genes in DNs. (F) A qPCR validation of enzymatic genes of metabolic pathways in DNs and NNs. NNs, n = 12; CDNs, n = 4; UDNs, n = 6. All results are expressed as means ± SEM. *P < 0.05; **P < 0.01; ***P < 0.001.
Fig. 2.
Fig. 2.
Metabolic pathways involved in high-glucose-induced NET priming. (A to E) The effect of high-glucose condition on the function of neutrophils. Human neutrophils were incubated in an RPMI medium supplemented with either 5.5 mM glucose (NNs) or 22 mM glucose (HNs) for 4 h. NNs and HNs were stimulated with LPS (10 μg/ml) or PMA (1 μg/ml) for 1 h. n = 4 to 7 per group. (A) Immunofluorescence images of NET formation in NNs and HNs. Representative images of 5 experiments are shown. Red, CitH3; green, MPO; blue, DAPI. (B and C) Percentages of MPOhigh (B) and CitH3high (C) neutrophils. (D) NET formation in NNs and HNs was determined by SYTOX Green staining. n = 7 per group. (E) ROS generation in NNs and HNs was determined by DCF-DA staining. n = 5 per group. (F to J) RNA sequencing analysis of NNs and HNs. n = 4 per group. (F) Heatmap representation of DEGs in NNs and HNs. (G) Heatmap depicting DEG analysis of metabolic profiles in NNs and HNs. (H) GO enrichment analysis of up-regulated genes in HNs. (I) A qPCR validation of the enzymatic genes of metabolic pathways in NNs and HNs. n = 6 per group. (J) Schematic depicting altered metabolic pathways in HNs based on KEGG metabolic pathway mapping and qPCR. Adjusted P < 0.05 was considered to indicate statistical significance for KEGG metabolic pathway mapping (colored arrows). The significant alterations in genes involved in metabolic pathways on qPCR analysis were denoted by asterisks. All results are expressed as means ± SEM. *P < 0.05; **P < 0.01; ***P < 0.001.
Fig. 3.
Fig. 3.
Metabolic modulation mediates NET priming. (A) Schematic depicting the inhibitors of the metabolic pathways. (B to D) The effects of inhibitors on metabolic pathways in high-glucose-induced NET priming. Neutrophils were incubated with either 5.5 mM glucose medium (NNs) or 22 mM glucose medium (HNs) in the presence or absence of the indicated inhibitors of metabolic pathways and then stimulated with LPS (10 μg/ml). The NET formation was analyzed using SYTOX Green staining. n = 5 to 7 per group. (E) Quantification of ECARs in NNs and HNs. Oligo, oligomycin. n = 15 per group. (F) Quantification of OCRs in NNs and HNs. Rot, rotenone; Anti, antimycin A. n = 12 per group. (G) Representative flow cytometry plots of the membrane potential of neutrophils as measured using JC-10 fluorescence. Red, JC-10 aggregates; green, JC-10 monomers. The bar graph shows the ratios of JC-10 aggregate and JC-10 monomer expression in neutrophils. n = 3 per group. All results are expressed as means ± SEM. *P < 0.05; **P < 0.01; ***P < 0.001.
Fig. 4.
Fig. 4.
Validation of metabolic modulation in HNs through U-13C glucose tracing. Metabolic flux analysis in NNs and HNs. Neutrophils were incubated in a medium supplemented with U-13C glucose, and the fates of labeled carbon were traced using LC-mass spectrometry. The relative enrichment with respect to concentration of each metabolite from NNs was shown. (A) The schematic diagram for incorporation and distribution patterns of U-13C glucose into downstream metabolites associated with glycolysis, PPP, and TCA cycle. (B to F) Distribution of U- 13C (m + 6) and 12C (m + 0) into different metabolites. (B) U-13C (m + 6) in glucose-6-phosphate (glucose-6-P) and fructose-6-phosphate (fructose-6-P). (C) U-13C (m + 5) in 6-phosphogluconate (6-PG) and ribose-5-phosphate (ribose-5P). (D) U-13C (m + 4) in erythose-4-phosphate (E4P) and seduheptulose-7-phosphate (seduheptulose-7-P). (E) U-13C (m + 3) in glyceraldehyde-3-phosphate (glyceraldehyde-3-P), pyruvate, lactate, and alanine. (F) U-13C (m + 2) in citrate, succinate, fumarate, malate, aspartate, glutamate, and acetyl-CoA. n = 3 to 5 per group. Data are presented as relative metabolite abundance and expressed as means ± SEM. *P < 0.05; ***P < 0.001; #P < 0.05; ##P < 0.01; ###P < 0.001.
Fig. 5.
Fig. 5.
ACLY mediates histone acetylation that primes NET priming in HNs. (A) Accumulation of acetyl-CoA in neutrophils. Neutrophils were incubated in a normal- or high-glucose medium in the presence or absence of the indicated inhibitors, and the intracellular concentrations of acetyl-CoA were examined using enzyme-linked immunosorbent assay. n = 4 to 8 per group. (B) Relative ACLY mRNA levels in NNs and HNs. n = 6 per group. (C) Quantification of ACLY and PDH fluorescence in NNs and HNs. n = 16 per group. (D) Western blotting of total ACLY and PDH (α1 and α2 subunits) in NNs and HNs. The bar graph shows the fold changes in the expression levels of total ACLY and PDH compared with β-actin. n = 9 to 10 per group. (E and F) Effects of ACLY inhibition on high-glucose-induced (E) acetyl-CoA accumulation and (F) NET priming. n = 8 per group. (G) Representative images of the subcellular localization of ACLY in neutrophils. The subcellular localization of reporters was analyzed using an EzColocalization analysis. Left: Immunofluorescence images showing reporter 1 (blue, DAPI) and reporter 2 (green, ACLY). Second: Differential interference contrast (DIC) images of cell identification; Third: Heatmaps for DAPI. Right: Heatmaps for ACLY. The signal intensities are indicated by the bar on each reporter image. Representative images of 5 independent experiments are shown. (H) The probability of the colocalization of ACLY with the nucleus determined using PCC metric in the EzColocalization analysis. Representative images of 5 independent experiments are shown. The bar graph denotes the percentages of colocalization between ACLY and the nucleus. n = 5 per group. (I) Representative confocal images depicting the levels of acetylation of the indicated histones in neutrophils. The bar graph shows the fold changes in the expression levels of the indicated acetylated histones in HNs compared to NNs. n = 4 to 7 per group. (J) Representative western blotting images and bar graphs of histone acetylation in NNs and HNs. n = 6 per group. (K) Effects of inhibitors on histone acetylation in neutrophils. Neutrophils were incubated under either normal- or high-glucose conditions in the presence or absence of the indicated inhibitors. n = 6 to 8 per group. (L) Effects of histone acetylase inhibition on high-glucose-induced NET priming. Neutrophils were incubated under either normal- or high-glucose conditions in the presence or absence of anacardic acid. n = 13 per group. (M) Representative Western blotting images and bar graphs of the expression levels of HAT1 (RBAP46) and KAT2B (PCAF). n = 9 to 10 per group. CPI-613, an inhibitor of PDH; DCA, an inhibitor of PDH kinase; BMS303141, an inhibitor of ACLY; etomoxir, an inhibitor of CPT-1. All results are expressed as means ± SEM. *P < 0.05; **P < 0.01; ***P < 0.001.
Fig. 6.
Fig. 6.
Diabetes primes NET formation via trained immunity. (A) Representative Western blotting images and bar graphs of the expression levels of PDH, ACLY, HAT1, and KAT2b in NNs and DNs. NNs, n = 4 to 5; CDNs, n = 3; UDNs, n = 4. (B) The expression levels of ACLY in NNs and DNs. NNs, n = 12; CDNs, n = 4; UDNs, n = 6. (C) Representative images of the subcellular localization of ACLY in DNs and CDNs using EzColocalization analysis. The bar graph denotes the probability of colocalization of ALCY with the nucleus in DNs and NNs using PCC metric. Each dot represents a single cell. Representative images of 3 independent experiments are shown. n = 3 per group. (D) Representative Western blotting images and bar graphs of the expression levels of acetylated histones in DNs and NNs. NNs, n = 4 to 6; CDNs, n = 4; UDNs, n = 3. (E) Representative confocal images depicting the levels of acetylation of the indicated histones in neutrophils. The bar graph shows the fold changes in the expression levels of the indicated acetylated histones in DNs compared to NNs. n = 2 to 3 per group. Each sample was analyzed in duplicates, resulting in 2 data point per sample. (F) The intracellular concentration of acetyl-CoA in NNs and DNs. NNs, n = 5; UDNs, n = 8. Each patient sample was analyzed in duplicates, resulting in 2 data point per patient. (G) Quantification of ECARs in DNs and NNs. n = 4 per group. (H) The effect of an inhibitor for ACLY on wound healing in a murine model of diabetes. The excisional dorsal full-thickness skin wounds (6 mm in diameter) were induced in the center of each dorsal skin of C57BL/6J mice. The wound closure results were quantified on days 1, 2, 4, 6, 8, and 10 after wounding. Inset: Representative photographs of wound healing. WT (wild-type control), n = 3; STZ + vehicle (vehicle-treated diabetic mice), n = 4; STZ + ACLYi (ACLY inhibitor-treated diabetic mice), n = 4. All results are expressed as means ± SEM. *P < 0.05; **P < 0.01; ***P < 0.001.

References

    1. Netea MG, Dominguez-Andres J, Barreiro LB, Chavakis T, Divangahi M, Fuchs E. Defining trained immunity and its role in health and disease. Nat Rev Immunol. 2020;20(6):375–388. - PMC - PubMed
    1. Pavlou S, Lindsay J, Ingram R, Xu H, Chen M. Sustained high glucose exposure sensitizes macrophage responses to cytokine stimuli but reduces their phagocytic activity. BMC Immunol. 2018;19(1):24. - PMC - PubMed
    1. Ayala TS, Tessaro FHG, Jannuzzi GP, Bella LM, Ferreira KS, Martins JO. High glucose environments interfere with bone marrow-derived macrophage inflammatory mediator release, the TLR4 pathway and glucose metabolism. Sci Rep. 2019;9(1):11447. - PMC - PubMed
    1. Choudhury RP, Edgar L, Ryden M, Fisher EA. Diabetes and metabolic drivers of trained immunity: New therapeutic targets beyond glucose. Arterioscler Thromb Vasc Biol. 2021;41(4):1284–1290. - PMC - PubMed
    1. Omori K, Ohira T, Uchida Y, Ayilavarapu S, Batista EL Jr, Yagi M, Iwata T, Liu H, Hasturk H, Kantarci A, et al. . Priming of neutrophil oxidative burst in diabetes requires preassembly of the NADPH oxidase. J Leukoc Biol. 2008;84(1):292–301. - PMC - PubMed

LinkOut - more resources