. 2024 Apr 9:15:1367535.
doi: 10.3389/fpls.2024.1367535. eCollection 2024.

Elevated CO2 and ammonium nitrogen promoted the plasticity of two maple in great lakes region by adjusting photosynthetic adaptation

Affiliations

Elevated CO2 and ammonium nitrogen promoted the plasticity of two maple in great lakes region by adjusting photosynthetic adaptation

Lei Wang et al. Front Plant Sci. .

Abstract

Introduction: Climate change-related CO2 increases and different forms of nitrogen deposition are thought to affect the performance of plants, but their interactions have been poorly studied.

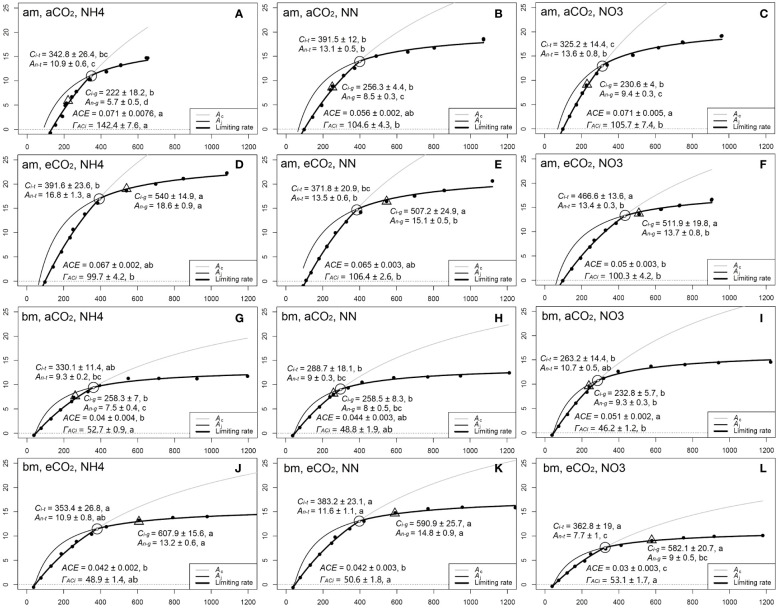
Methods: This study investigated the responses of photosynthesis and growth in two invasive maple species, amur maple (Acer ginnala Maxim.) and boxelder maple (Acer negundo L.), to elevated CO2 (400 µmol mol-1 (aCO2) vs. 800 µmol mol-1 (eCO2) and different forms of nitrogen fertilization (100% nitrate, 100% ammonium, and an equal mix of the two) with pot experiment under controlled conditions.

Results and discussion: The results showed that eCO2 significantly promoted photosynthesis, biomass, and stomatal conductance in both species. The biochemical limitation of photosynthesis was switched to RuBP regeneration (related to Jmax) under eCO2 from the Rubisco carboxylation limitation (related to Vcmax) under aCO2. Both species maximized carbon gain by lower specific leaf area and higher N concentration than control treatment, indicating robust morphological plasticity. Ammonium was not conducive to growth under aCO2, but it significantly promoted biomass and photosynthesis under eCO2. When nitrate was the sole nitrogen source, eCO2 significantly reduced N assimilation and growth. The total leaf N per tree was significantly higher in boxelder maple than in amur maple, while the carbon and nitrogen ratio was significantly lower in boxelder maple than in amur maple, suggesting that boxelder maple leaf litter may be more favorable for faster nutrient cycling. The results suggest that increases in ammonium under future elevated CO2 will enhance the plasticity and adaptation of the two maple species.

Keywords: amur maple; boxelder maple; global change; nitrogen form; photosynthetic adaptation.


Conflict of interest statement

The authors declare that the research was conducted in the absence of any commercial or financial relationships that could be construed as a potential conflict of interest. The author(s) declared that they were an editorial board member of Frontiers, at the time of submission. This had no impact on the peer review process and the final decision.

Figures

Figure 1
Figure 1
A sample of a photosynthetic light response curve (lrc) with relevant parameters (A) the photosynthetic rate at saturation light and 400 µmol mol−1 CO2 (An-max ), the curvature of the lrc (Theta, θ), apparent quantum yield (the initial slope of lrc, AQY), and light compensation point (LCP). An vs. Ci derived from the lrc database (B), where An-total and An-total/Ca are the y-intercept and slope of the An - Ci regression line. From (B), An-total /Ca = An-max /(Ca - Ci ), so An-max /An-total = (Ca - Ci )/Ca , which means that An-max /An-total + Ci /Ca = 1.
Figure 2
Figure 2
Biomass responses to CO2 and N form treatments in amur maple (A) and boxelder maple (B). “a-” means ambient CO2 (400 µmol mol−1) and “e-” means elevated CO2 (800 µmol mol−1) treatments. NH4: fertilized 10 mM (NH4)2SO4; NN: fertilized with a combination of 5 mM (NH4)2SO4 and 5 mM NaNO3; NO3: fertilized with 10 mM NaNO3. Means (± SE, n=6) with different letters indicated significant differences between treatments (Tukey host hoc test, P<0.05).
Figure 3
Figure 3
Leaf N partitioning into carboxylation (Ncb ), electron transfer (Net ), light capture systems (Nlc ), and respiratory (Nresp ) in response to CO2 and different N forms in amur maple (A) and boxelder maple (B). “a-” means ambient CO2 (400 µmol mol−1) and “e-” means elevated CO2 (800 µmol mol−1) treatments. NH4: fertilized with 10 mM (NH4)2SO4; NN: fertilized with a combination of 5 mM (NH4)2SO4 and 5 mM NaNO3; NO3: fertilized with 10 mM NaNO3.
Figure 4
Figure 4
Effects of CO2 and N forms on photosynthetic nitrogen use efficiency [PNUE, (A) and photosynthetic rate at growth CO2 (An-g , (B)] in amur maple (am) and boxelder maple (bm). aCO2: ambient CO2 (400 µmol mol−1); eCO2: elevated CO2 (800 µmol mol−1); NH4: fertilized with 10 mM (NH4)2SO4; NN: fertilized with a combination of 5 mM (NH4)2SO4 and 5 mM NaNO3; NO3: fertilized with 10 mM NaNO3. Means (± SE, n=6) with different letters indicated significant differences between treatments (Tukey host hoc test, P<0.05).
Figure 5
Figure 5
The A/Ci curves in response to different N forms in amur maple (am, A–F) and boxelder (bm, G–L) seedlings grown under ambient CO2 (aCO2, A-C in am and G-I in bm) and elevated CO2 (eCO2, D–F in am and J–L in bm). NH4: fertilized with 10 mM (NH4)2SO4 (left column); NN: fertilized with a combination of 5 mM (NH4)2SO4 and 5 mM NaNO3 (middle column); NO3: fertilized with 10 mM NaNO3 (right column). Each point denotes the means of six (Ci , An ) values in A/Ci curve. The circles represent the transition point (Ci-t , An-t ) from Rubisco carboxylation to RuBP regeneration of photosynthesis limitation. The triangles indicated the photosynthetic rate (Ci-g , An-g ) under growth Ca (400 µmol mol−1 versus 800 µmol mol−1). ACE: apparent carboxylation efficiency estimated from the initial slope of A/Ci curve; ΓACi : CO2 compensation point estimated from A/Ci curve intersects point on X-axis. Different letters of the same parameter in the same species are significantly different between treatments (Tukey host hoc test, P<0.05, see Supplementary Table S2 ).
Figure 6
Figure 6
The relative photosynthesis limitations of biochemistry (lb ), stomatal resistance (ls ), and mesophyll resistance (lm ) in response to CO2 and N form treatment in amur maple (A) and boxelder maple (B). Abbreviations are provided in Supplementary Table S1 .
Figure 7
Figure 7
Principal Component Analysis (PCA) on growth and photosynthetic parameters in amur maple exposed to CO2 (A) and N resource (B) treatments and in boxelder maple (C, D). The arrows point to near overlap, vertical, and reverse, which represent positive, no, and negative correlations between these parameters respectively. aCO2: ambient CO2 (400 µmol mol−1); eCO2: elevated CO2 (800 µmol mol−1); NH4: fertilized 10 mM (NH4)2SO4; NN: fertilized 10 mM N from 5 mM (NH4)2SO4 and 5 mM NaNO3; NO3: fertilized 10 mM NaNO3. Jmax : maximum of photosynthetic electron transport rate; PNUE: photosynthesis nitrogen use efficiency; An-t : net photosynthesis rate at transition point (Ci-t , An-t ) between Rubisco limitation and RuBP regeneration limitation based on A/Ci curve; An-g : net photosynthesis rate at a growth [CO2] which eCO2 at 800 µmol mol−1 and aCO2 at 400 µmol mol−1; gs : stomatal conductance; Nleaf : total N of the whole-plant leaf; Chl: leaf chlorophyll concentration; Ci /Ca : the ratio of Ci and Ca ; Narea : leaf N per unit area; SLA: specific leaf area; An-max /An-total : the ratio of photosynthetic rate of saturation light at 400 µmol mol−1 (An-max ) and the y-intercept of An vs. Ci fitting line (An-total ) from light response curve database; An-total/Ca : the slope of An vs. Ci fitting line from light response curve database; C/N: leaf carbon and nitrogen ratio; Vcmax : maximum rate of ribulose-1,5-bisphosphate carboxylation; See Supplementary Table S1 for other explanations.
Figure 8
Figure 8
The priori (showing all tested paths) piecewise structural equation model (pSEM) relating to direct and indirect effects of CO2 and N form on biomass (A) and An-g(B). Two CO2 treatments (ambient CO2: 400 µmol mol−1 and elevated CO2: 800 µmol mol−1) and N source (10 mM N source by three forms: NH4 +, NH4 ++NO3 - in 1:1, NO3 -) are treated as categorical variables. An-g : net photosynthesis rate at a growth [CO2] which eCO2 at 800 µmol mol−1 and aCO2 at 400 µmol mol−1; Narea : leaf N per unit area; SLA: specific leaf area; Chl: leaf chlorophyll concentration; gt : total conductance to CO2 between the leaf surface and carboxylation sites (1/gt = 1/gs + 1/gm ). Multiple regression from Vcmax and Jmax to An-g was used to construct photosynthetic capacity as a component variable (hexagonal frame). The SEM (using psem function in piecewiseSEM package R) of biomass and An-g in amur maple are in (C, D), while that of boxelder maple are in (E, F). Arrows mean the directional influence between the variables and the solid lines represent significant relationships, and the dashed lines refer to nonsignificant relationships (P > 0.05). The numbers on top of the arrows represent the standardized path coefficients (for continuous variables), and the numbers under the box with R2 refer to the degree of variation of the variable interpreted by all paths. Curved double arrows represent a significant correlation between variables (with correlation coefficient). The values on the line from the categorical variable indicated the continuous variable estimated marginal means by the treatment levels.

References

    1. Ainsworth E. A., Long S. P. (2021). 30 years of free-air carbon dioxide enrichment (FACE): What have we learned about future crop productivity and its potential for adaptation? Glob. Chang. Biol. 27, 27–49. doi: 10.1111/gcb.15375 - DOI - PubMed
    1. Andrews M., Condron L. M., Kemp P. D., Topping J. F., Lindsey K., Hodge S., et al. . (2019). Elevated CO2 effects on nitrogen assimilation and growth of C3 vascular plants are similar regardless of N-form assimilated. J. Exp. Bot. 70, 683–690. doi: 10.1093/jxb/ery371 - DOI - PubMed
    1. Barros V., Melo A., Santos M., Nogueira L., Frosi G., Santos M. G. (2020). Different resource-use strategies of invasive and native woody species from a seasonally dry tropical forest under drought stress and recovery. Plant Physiol. Biochem. 147, 181–190. doi: 10.1016/j.plaphy.2019.12.018 - DOI - PubMed
    1. Bäurle I., Laplaze L., Martin A. (2023). Preparing for an uncertain future: molecular responses of plants facing climate change. J. Exp. Bot. 74, 1297–1302. doi: 10.1093/jxb/erac493 - DOI - PMC - PubMed
    1. Berghuijs H. N. C., Yin X., Ho Q. T., Driever S. M., Retta M. A., Nicolaï B. M., et al. . (2016). Mesophyll conductance and reaction-diffusion models for CO2 transport in C3 leaves; needs, opportunities and challenges. Plant Sci. 252, 62–75. doi: 10.1016/j.plantsci.2016.05.016 - DOI - PubMed

LinkOut - more resources