

Comparison of four in vitro test methods to assess nucleus pulposus replacement device expulsion risk
- PMID: 38655007
- PMCID: PMC11037461
- DOI: 10.1002/jsp2.1332
Comparison of four in vitro test methods to assess nucleus pulposus replacement device expulsion risk
Abstract
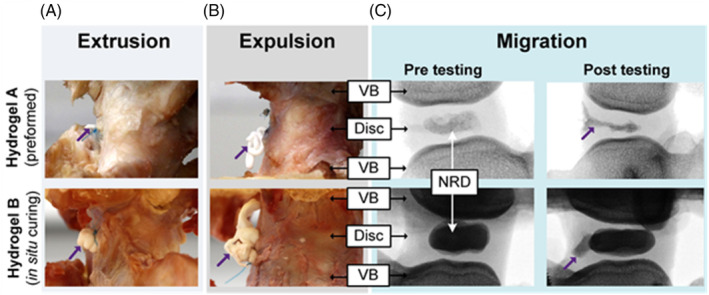
Background: Nucleus replacement devices (NRDs) are not routinely used in clinic, predominantly due to the risk of device expulsion. Rigorous in vitro testing may enable failure mechanisms to be identified prior to clinical trials; however, current testing standards do not specify a particular expulsion test. Multiple methods have therefore been developed, complicating comparisons between NRD designs. Thus, this study assessed the effectiveness of four previously reported expulsion testing protocols; hula-hoop (Protocol 1), adapted hula-hoop (Protocol 2), eccentric cycling (Protocol 3), and ramp to failure (Protocol 4), applied to two NRDs, one preformed and one in situ curing.
Methods: Nucleus material was removed from 40 bovine tail intervertebral disks. A NRD was inserted posteriorly into each cavity and the disks were subjected to one of four expulsion protocols.
Results: NRD response was dependent on both the NRD design and the loading protocol. Protocol 1 resulted in higher migration and earlier failure rates compared to Protocol 2 in both NRDs. The preformed NRD was more likely to migrate when protocols incorporated rotation. The NRDs had equal migration (60%) and expulsion (60%) rates when using unilateral bending and ramp testing. Combining the results of multiple tests revealed complimentary information regarding the NRD response.
Conclusions: Adapted hula-hoop (Protocol 2) and ramp to failure (Protocol 4), combined with fluoroscopic analysis, revealed complimentary insights regarding migration and failure risk. Therefore, when adopting the surgical approach and animal model used in this study, it is recommended that NRD performance be assessed using both a cyclic and ramp loading protocol.
Keywords: biomechanical testing; expulsion; hydrogel; intervertebral disk; nucleus replacement; spine.
© 2024 The Authors. JOR Spine published by Wiley Periodicals LLC on behalf of Orthopaedic Research Society.
Conflict of interest statement
Thomas P. Schaer was involved in research support as Principal Investigator and the patenting of the hydrogel‐based technologies for ReGelTec, Inc. and Johnson and Johnson DePuy‐Synthes. Additionally, Thomas P. Schaer is a paid consultant and stock supplier for ReGelTec, Inc. Nigel Smith was involved in the development and patenting of hydrogel‐based technologies for Synthes Spine as Director of Non‐Fusion Technologies. Nigel Smith and Erik Brewer were involved in the development and patenting with ReGelTec Inc. of the Hydrafil™ Injectable hydrogel for minimally invasive treatment for treating degenerative disk disease. Nigel Smith and Erik Brewer are current shareholders of ReGelTec Inc. (https://regeltec.com/) that is active in the clinical evaluation of Hydrafil™. Additionally, Erik Brewer receives research funding from ReGelTec, Inc.
Figures


References
-
- Daffner SD, Hymanson HJ, Wang JC. Cost and use of conservative management of lumbar disc herniation before surgical discectomy. Spine J. 2010;10:463‐468. - PubMed
-
- Rajaee SS, Bae HW, Kanim LEA, Delamarter RB. Spinal fusion in the United States: analysis of trends from 1998 to 2008. Spine. 2012;37:67‐76. - PubMed
-
- Cheh G, Bridwell KH, Lenke LG, et al. Adjacent segment disease following lumbar/thoracolumbar fusion with pedicle screw instrumentation. Spine. 2007;32:2253‐2257. - PubMed
-
- Helgeson MD, Bevevino AJ, Hilibrand AS. Update on the evidence for adjacent segment degeneration and disease. Spine J. 2013;13:342‐351. - PubMed
-
- Min J‐H, Jang J‐S, Lee S‐H. Comparison of anterior‐ and posterior‐approach instrumented lumbar interbody fusion for spondylolisthesis. J Neurosurg Spine. 2007;7:21‐26. - PubMed
LinkOut - more resources
Full Text Sources
