. 2024 Apr 9;6(2):100468.
doi: 10.1016/j.ocarto.2024.100468. eCollection 2024 Jun.

Dual-energy X-ray absorptiometry derived knee shape may provide a useful imaging biomarker for predicting total knee replacement: Findings from a study of 37,843 people in UK Biobank

Affiliations

Dual-energy X-ray absorptiometry derived knee shape may provide a useful imaging biomarker for predicting total knee replacement: Findings from a study of 37,843 people in UK Biobank

Rhona A Beynon et al. Osteoarthr Cartil Open. .

Abstract

Objective: We aimed to create an imaging biomarker for knee shape using knee dual-energy x-ray absorptiometry (DXA) scans and investigate its potential association with subsequent total knee replacement (TKR), independently of radiographic features of knee osteoarthritis and established risk factors.

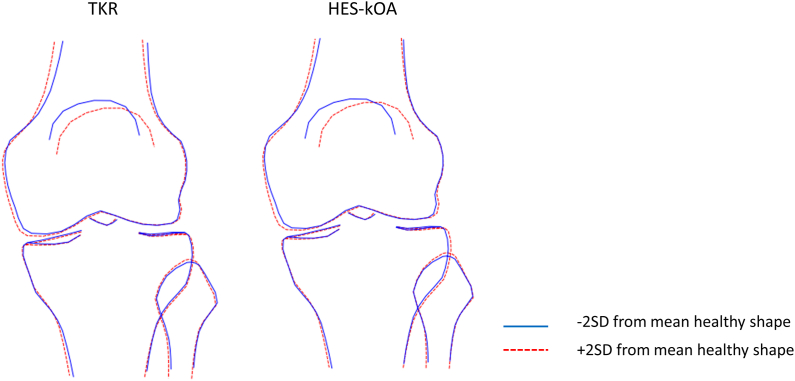
Methods: Using a 129-point statistical shape model, knee shape (expressed as a B-score) and minimum joint space width (mJSW) of the medial joint compartment (binarized as above or below the first quartile) were derived. Osteophytes were manually graded in a subset of images and an overall score was assigned. Cox proportional hazards models were used to examine the associations of B-score, mJSW and osteophyte score with TKR risk, adjusting for age, sex, height and weight.

Results: The analysis included 37,843 individuals (mean age 63.7 years). In adjusted models, B-score was associated with TKR: each unit increase in B-score, reflecting one standard deviation from the mean healthy shape, corresponded to a hazard ratio (HR) of 2.25 (2.08, 2.43), while a lower mJSW had a HR of 2.28 (1.88, 2.77). Among the 6719 images scored for osteophytes, mJSW was replaced by osteophyte score in the most strongly predictive model for TKR. In ROC analyses, a model combining B-score, osteophyte score, and demographics outperformed a model including demographics alone (AUC ​= ​0.87 vs 0.73).

Conclusions: Using statistical shape modelling, we derived a DXA-based imaging biomarker for knee shape that was associated with kOA progression. When combined with osteophytes and demographic data, this biomarker may help identify individuals at high risk of TKR, facilitating targeted interventions.

Keywords: Knee shape; Osteoarthritis; Osteophytes; Statistical shape modelling.


Conflict of interest statement

The other authors have declared no conflicts of interest. For the purpose of open access, the author has applied a CC BY public copyright licence to any Author Accepted Manuscript version arising from this submission. We confirm that there are no conflicts of interest associated with this manuscript, including any financial support or benefits from commercial sources.

Figures

Fig. 1
Fig. 1
Flow Diagram of Participant Progression through the Study. At the time of the analysis, approximately 39,000 left knee DXA scans were available. DXA images underwent a comprehensive assessment to determine their suitability for inclusion in the SSM. Reasons for exclusion included: poor image quality, artefacts, positioning issues, short femoral or tibial shafts, and search failure. A total of 220 participants withdrew from the study, and an additional 80 participants were excluded due to having undergone TKR on the contralateral knee before obtaining the DXA image of the left knee. All participants in the analytic dataset had SSM data available, which was used to derive B-score and minimum joint space width (mJSW). Within this dataset, a sub-sample of 6719 participants had additional osteophyte data available. This sub-sample, comprising participants with B-scores, mJSW and osteophyte data, were used to develop an imaging biomarker for predicting TKR. Abbreviations: QC, quality control; SSM, statistical shape model; TKR, total knee replacement; UKB, UK Biobank.
Fig. 2
Fig. 2
Associations between the top 10 knee shape modes and B-score with knee osteoarthritis outcomes (n ​= ​37,843). The top panel displays the association of knee shape with total knee replacement (TKR), whilst the bottom panel presents the association of knee shape with hospital diagnosed knee osteoarthritis (HES-kOA). Hazard ratios (HRs) and odds ratios (ORs) indicate the change in risk of TKR and HES-kOA per standard deviation increase in knee shape mode (KSM) and per standard deviation increase in B-score. Models are adjusted for age, sex, height and weight. 95% confidence intervals (CI) are provided. Associations that met the Bonferroni-significant threshold of p ​< ​0.005 are marked with an asterisk.
Fig. 3
Fig. 3
Examples of differences in bone shape corresponding to an increase and decrease in B-scores. B-scores were obtained by projecting all statistical knee shape modes (KSMs) onto a vector connecting healthy and diseased knee joint shapes. The diseased population included individuals who underwent TKR (left) or had hospital-diagnosed knee osteoarthritis (HES-kOA) (right). The figure illustrates shape changes associated with ±2 standard deviations (SD) from the mean B-score. The solid blue line depicts the shape at -2SD, while the dashed red line represents the shape at +2SD. (For interpretation of the references to color in this figure legend, the reader is referred to the Web version of this article).
Fig. 4
Fig. 4
Receiver Operating Characteristic (ROC) Curve for Prediction of HES-kOA and TKR at 5 ​Years (n ​= ​6719). Model 1: age, sex, height, and weight; Model 2: age, sex, height, weight, B-score; Model 3: age, sex, height, weight, binary osteophyte grade; Model 4: age, sex, height, weight, B-score, binary osteophyte grade. Abbreviation: AUC, area under the receiver operating characteristic curve.

References

    1. Kellgren J.H., Lawrence J.S. Radiological assessment of osteo-arthrosis. Ann. Rheum. Dis. 1957;16(4):494–502. - PMC - PubMed
    1. Bedson J., Croft P.R. The discordance between clinical and radiographic knee osteoarthritis: a systematic search and summary of the literature. BMC Muscoskel. Disord. 2008;9:116. - PMC - PubMed
    1. Hannan M.T., Felson D.T., Pincus T. Analysis of the discordance between radiographic changes and knee pain in osteoarthritis of the knee. J. Rheumatol. 2000;27(6):1513–1517. - PubMed
    1. Brouwer G.M., van Tol A.W., Bergink A.P., Belo J.N., Bernsen R.M., Reijman M., et al. Association between valgus and varus alignment and the development and progression of radiographic osteoarthritis of the knee. Arthritis Rheum. 2007;56(4):1204–1211. - PubMed
    1. Sharma L., Song J., Dunlop D., Felson D., Lewis C.E., Segal N., et al. Varus and valgus alignment and incident and progressive knee osteoarthritis. Ann. Rheum. Dis. 2010;69(11):1940–1945. - PMC - PubMed

LinkOut - more resources