

Transient Absorption Spectroscopy of Films: Impact of Refractive Index
- PMID: 38655057
- PMCID: PMC11037419
- DOI: 10.1021/acs.jpcc.4c00981
Transient Absorption Spectroscopy of Films: Impact of Refractive Index
Abstract
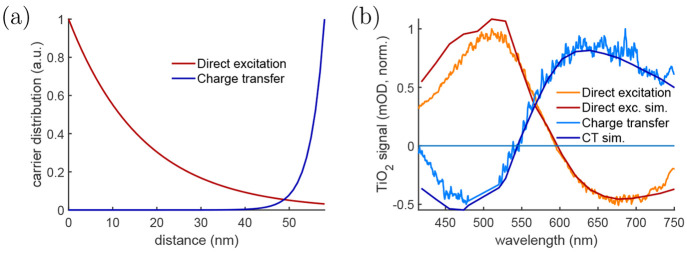
Transient absorption spectroscopy is a powerful technique to study the photoinduced phenomena in a wide range of states from solutions to solid film samples. It was designed and developed based on photoinduced absorption changes or that photoexcitation triggers a chain of reactions with intermediate states or reaction steps with presumably different absorption spectra. However, according to general electromagnetic theory, any change in the absorption properties of a medium is accompanied by a change in the refractive properties. Although this photoinduced change in refractive index has a negligible effect on solution measurements, it may significantly affect the measured response of thin films. In this Perspective paper, we examine why and how the measured responses of films differ from their expected "pure" absorption responses. The effect of photoinduced refractive index change can be concluded and studied by comparing the transmitted and reflected probe light responses. Another discussed aspect is the effect of light interference on thin films. Finally, new opportunities of monitoring the photocarrier migration in films and studying nontransparent samples using the reflected probe light response are discussed. Most of the examples provided in this article focus on studies involving perovskite, TiO2, and graphene-based films, but the general discussion and conclusions can be applicable to a wide range of semiconductor and thin metallic films.
© 2024 The Authors. Published by American Chemical Society.
Conflict of interest statement
The authors declare no competing financial interest.
Figures
Similar articles
-
Quantitative Complex Refractive Index Changes in Thin Films: A Pump-Probe Spectroscopy Analysis Approach.J Phys Chem Lett. 2024 Jun 27;15(25):6467-6475. doi: 10.1021/acs.jpclett.4c01249. Epub 2024 Jun 13. J Phys Chem Lett. 2024. PMID: 38869188
-
Refractive index change dominates the transient absorption response of metal halide perovskite thin films in the near infrared.Phys Chem Chem Phys. 2019 Jul 10;21(27):14663-14670. doi: 10.1039/c9cp02291k. Phys Chem Chem Phys. 2019. PMID: 31215557
-
Reflectivity Effects on Pump-Probe Spectra of Lead Halide Perovskites: Comparing Thin Films versus Nanocrystals.ACS Nano. 2018 Jun 26;12(6):5719-5725. doi: 10.1021/acsnano.8b01570. Epub 2018 May 15. ACS Nano. 2018. PMID: 29727155
-
Determination of the refractive-index change in the excited state based on transient absorption microscopy.Opt Lett. 2023 Dec 15;48(24):6561-6564. doi: 10.1364/OL.506090. Opt Lett. 2023. PMID: 38099799
-
Elimination of interference effects from photoinduced-transmission decay curves of thin silicon films.Appl Opt. 1995 Jun 1;34(16):2949-54. doi: 10.1364/AO.34.002949. Appl Opt. 1995. PMID: 21052448
Cited by
-
An Increase in the Rigidity of the Environment Favors MLCT over the MC State in [Ru(bpy)2(Nicotine)2](Cl)2: A Case Study of Photolabile Ligands.J Phys Chem A. 2025 Jan 16;129(2):439-446. doi: 10.1021/acs.jpca.4c04914. Epub 2024 Nov 4. J Phys Chem A. 2025. PMID: 39496280 Free PMC article.
-
Carrier Multiplication and Photoexcited Many-Body States in Solution-Processed 2H-MoSe2.ACS Nano. 2025 Mar 18;19(10):10347-10358. doi: 10.1021/acsnano.4c18254. Epub 2025 Mar 6. ACS Nano. 2025. PMID: 40047396 Free PMC article.
-
Exploring the Dynamics of Charge Transfer in Photocatalysis: Applications of Femtosecond Transient Absorption Spectroscopy.Molecules. 2024 Aug 23;29(17):3995. doi: 10.3390/molecules29173995. Molecules. 2024. PMID: 39274845 Free PMC article. Review.
References
-
- Ruckebusch C.; Sliwa M.; Pernot P.; de Juan A.; Tauler R. Comprehensive data analysis of femtosecond transient absorption spectra: A review. J. Photochem. Photobiol. C 2012, 13, 1–27. 10.1016/j.jphotochemrev.2011.10.002. - DOI
-
- Tkachenko N. V.; Khan R.. Photoinduced Processes in Metal Oxide Nanomaterials. In Tailored Functional Oxide Nanomaterials: From Design to Multi-Purpose Applications ;John Wiley & Sons, Ltd., 2022; pp 193–228.10.1002/9783527826940.ch6 - DOI
-
- Katoh R.; Furube A.; Barzykin A. V.; Arakawa H.; Tachiya M. Kinetics and mechanism of electron injection and charge recombination in dye-sensitized nanocrystalline semiconductors. Coord. Chem. Rev. 2004, 248, 1195–1213. 10.1016/j.ccr.2004.03.017. - DOI
Publication types
LinkOut - more resources
Full Text Sources