

A quality-by-design approach to improve process understanding and optimise the production and quality of CAR-T cells in automated stirred-tank bioreactors
- PMID: 38655265
- PMCID: PMC11035805
- DOI: 10.3389/fimmu.2024.1335932
A quality-by-design approach to improve process understanding and optimise the production and quality of CAR-T cells in automated stirred-tank bioreactors
Abstract
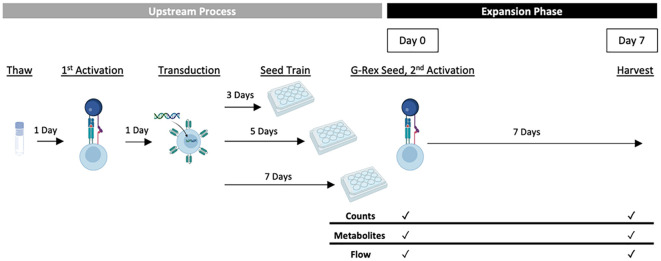
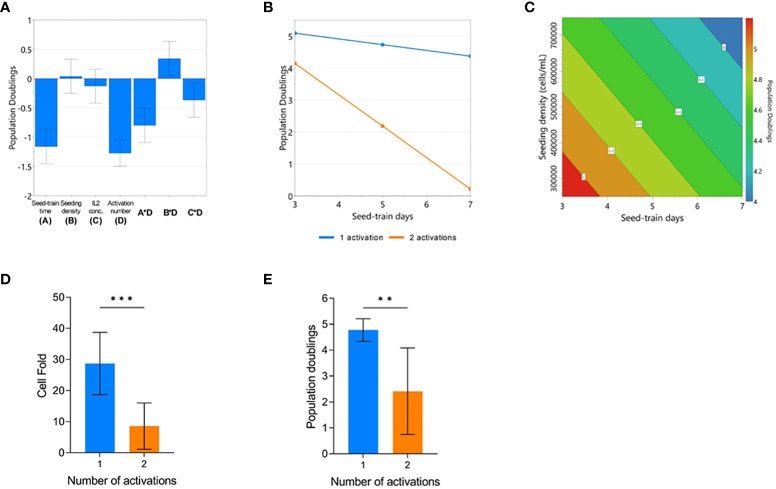
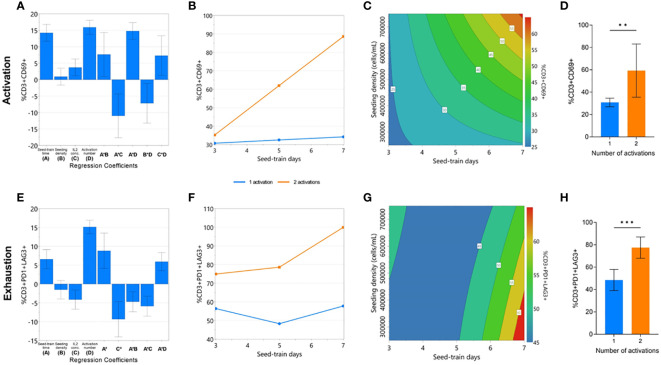
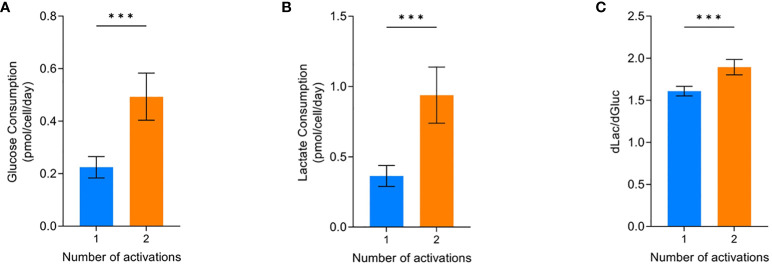
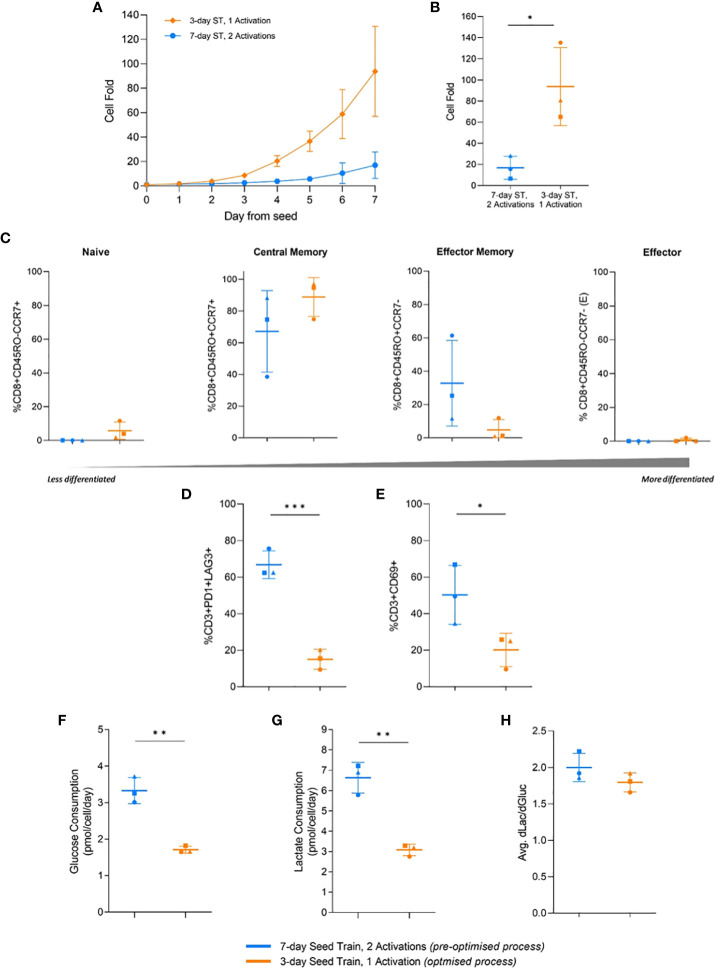
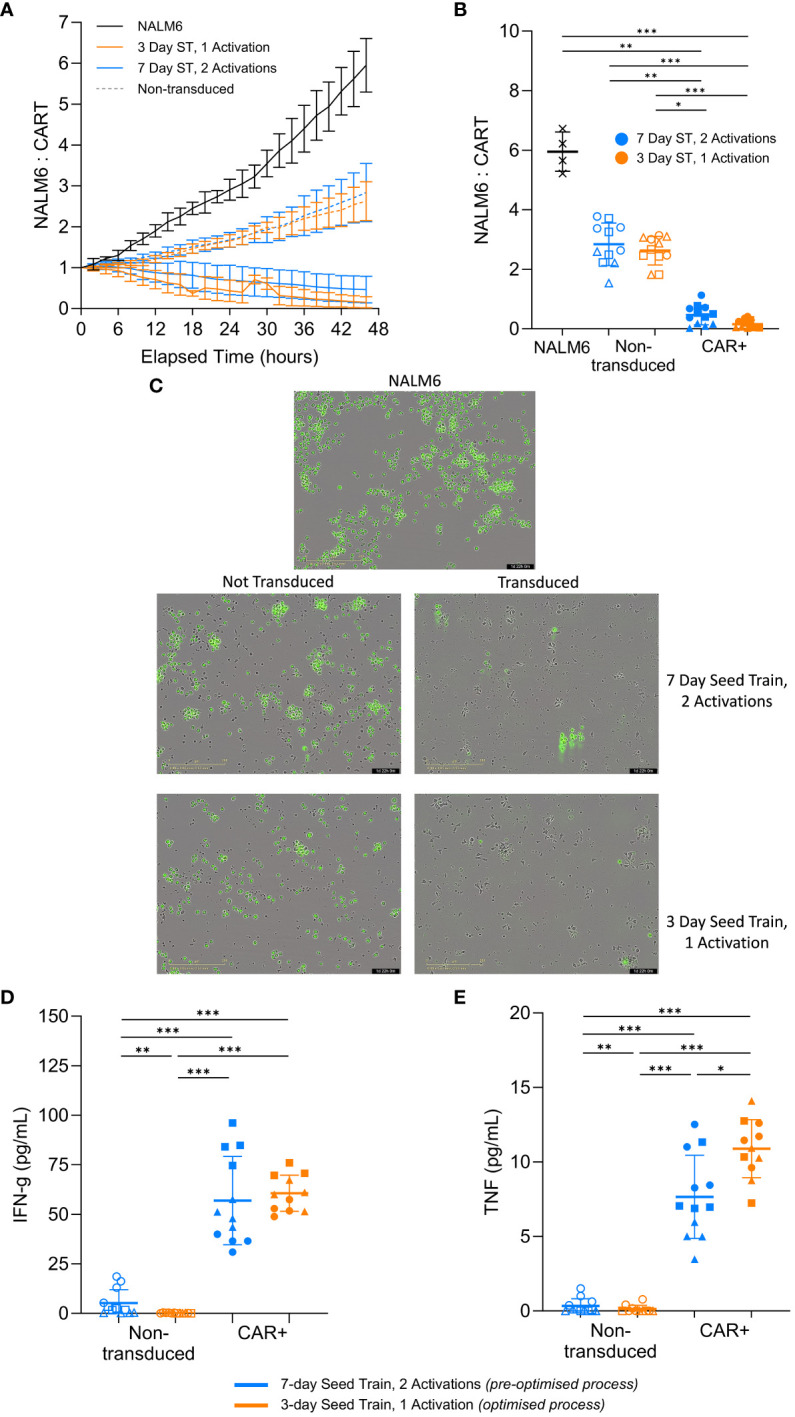
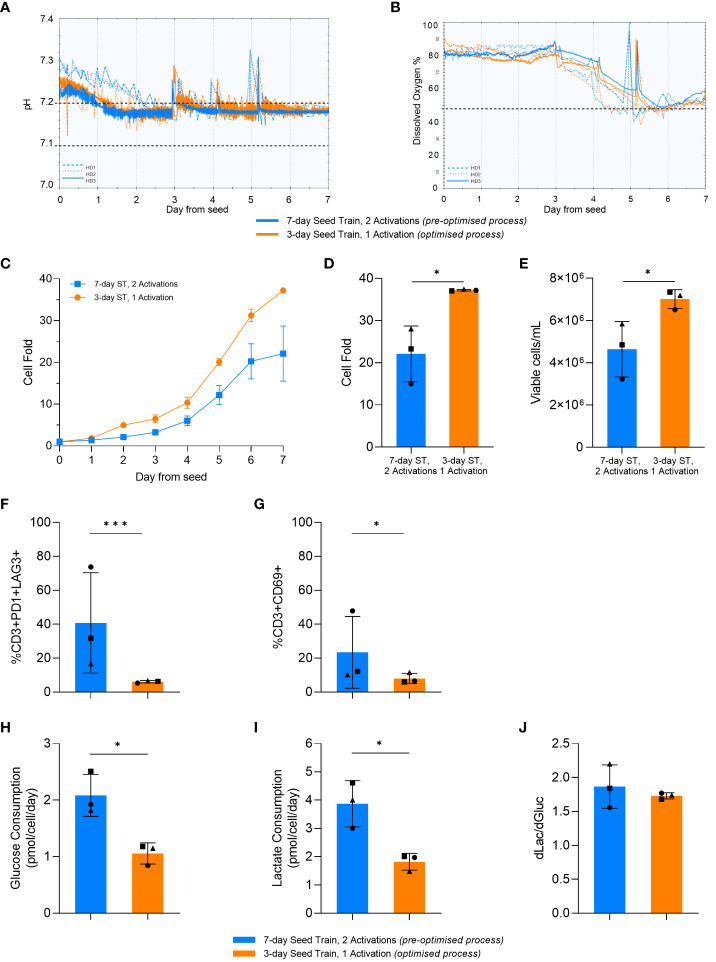
Ex vivo genetically-modified cellular immunotherapies, such as chimeric antigen receptor T cell (CAR-T) therapies, have generated significant clinical and commercial outcomes due to their unparalleled response rates against relapsed and refractory blood cancers. However, the development and scalable manufacture of these novel therapies remains challenging and further process understanding and optimisation is required to improve product quality and yield. In this study, we employ a quality-by-design (QbD) approach to systematically investigate the impact of critical process parameters (CPPs) during the expansion step on the critical quality attributes (CQAs) of CAR-T cells. Utilising the design of experiments (DOE) methodology, we investigated the impact of multiple CPPs, such as number of activations, culture seeding density, seed train time, and IL-2 concentration, on CAR-T CQAs including, cell yield, viability, metabolism, immunophenotype, T cell differentiation, exhaustion and CAR expression. Initial studies undertaken in G-Rex® 24 multi-well plates demonstrated that the combination of a single activation step and a shorter, 3-day, seed train resulted in significant CAR-T yield and quality improvements, specifically a 3-fold increase in cell yield, a 30% reduction in exhaustion marker expression and more efficient metabolism when compared to a process involving 2 activation steps and a 7-day seed train. Similar findings were observed when the CPPs identified in the G-Rex® multi-well plates studies were translated to a larger-scale automated, controlled stirred-tank bioreactor (Ambr® 250 High Throughput) process. The single activation step and reduced seed train time resulted in a similar, significant improvement in CAR-T CQAs including cell yield, quality and metabolism in the Ambr® 250 High Throughput bioreactor, thereby validating the findings of the small-scale studies and resulting in significant process understanding and improvements. This study provides a methodology for the systematic investigation of CAR-T CPPs and the findings demonstrate the scope and impact of enhanced process understanding for improved CAR-T production.
Keywords: CAR-T; T cells; immunotherapy; process optimisation; process understanding; quality-by-design; stirred-tank bioreactor.
Copyright © 2024 Hood, Slingsby, Sandner, Geis, Schmidberger, Bevan, Vicard, Hengst, Springuel, Dianat and Rafiq.
Conflict of interest statement
Authors FS, VS, WG, TS, NB, QV, JH and ND were or are Sartorius employees during the experimental studies and preparation of the manuscript. The remaining authors declare that the research was conducted in the absence of any commercial or financial relationships that could be construed as a potential conflict of interest.
Figures
Similar articles
-
Controlled activation modulates T-cell expansion and phenotype in stirred-tank bioreactors.Cytotherapy. 2025 Jun;27(6):774-781. doi: 10.1016/j.jcyt.2025.02.003. Epub 2025 Feb 14. Cytotherapy. 2025. PMID: 40019461
-
Establishing the scalable manufacture of primary human T-cells in an automated stirred-tank bioreactor.Biotechnol Bioeng. 2019 Oct;116(10):2488-2502. doi: 10.1002/bit.27088. Epub 2019 Jul 9. Biotechnol Bioeng. 2019. PMID: 31184370
-
Rapid manufacture of low-seed CAR-T cells in a GMP-grade hollow-fiber bioreactor platform.Cytotherapy. 2025 Mar;27(3):378-390. doi: 10.1016/j.jcyt.2024.11.003. Epub 2024 Nov 8. Cytotherapy. 2025. PMID: 39601749
-
CAR assembly line: Taking CAR T-cell manufacturing to the next level.Best Pract Res Clin Haematol. 2024 Dec;37(4):101595. doi: 10.1016/j.beha.2024.101595. Epub 2024 Dec 6. Best Pract Res Clin Haematol. 2024. PMID: 40074509 Review.
-
Chimeric Antigen Receptor Structure and Manufacturing of Clinical Grade CAR Engineered Cells using Different Bioreactors.Hematol Oncol Stem Cell Ther. 2022 Nov 7;15(3):137-152. doi: 10.56875/2589-0646.1048. Hematol Oncol Stem Cell Ther. 2022. PMID: 36395497 Review.
Cited by
-
Quality assessment strategy development and analytical method selection of GMP grade biological drugs for gene and cell therapy.BBA Adv. 2025 Feb 19;7:100151. doi: 10.1016/j.bbadva.2025.100151. eCollection 2025. BBA Adv. 2025. PMID: 40094061 Free PMC article. Review.
-
Establishing a scalable perfusion strategy for the manufacture of CAR-T cells in stirred-tank bioreactors using a quality-by-design approach.Bioeng Transl Med. 2025 Jan 28;10(3):e10753. doi: 10.1002/btm2.10753. eCollection 2025 May. Bioeng Transl Med. 2025. PMID: 40385527 Free PMC article.
-
Influenza A Virus Production Following Quality by Design Principles.Eng Life Sci. 2025 Apr 23;25(4):e70027. doi: 10.1002/elsc.70027. eCollection 2025 Apr. Eng Life Sci. 2025. PMID: 40271119 Free PMC article.
References
Publication types
MeSH terms
Substances
LinkOut - more resources
Full Text Sources